
Data Fusion of PRISMA Satellite Imagery for Asbestos-containing
Materials: An Application on Balangero’s Mine Site (Italy)
Giuseppe Bonifazi
1a
, Giuseppe Capobianco
1b
, Riccardo Gasbarrone
1c
, Silvia Serranti
1d
,
Sergio Bellagamba
2e
and Daniele Taddei
1,* f
1
DICMA, Department of Chemical Engineering, Materials and Environment, Sapienza - University of Rome,
via Eudossiana 18, 00184, Italy
2
INAIL - Italian Workers' Compensation Authority, Research Division, DIT - Department for Technological Innovations
and Security Equipment, Products and Human Settlements, via R. Ferruzzi 38/40, Rome, Italy
Keywords: PRISMA, Imaging Spectroscopy, Classification, Asbestos, Asbestos-containing Materials (ACMs).
Abstract: In the last few decades, the procedure for identifying, classifying and mapping the asbestos-containing
materials (ACMs), and contaminated areas, is considered one of the most important aspects for the purpose
of remediation. This task, carried out by skilled workers, can be very long and difficult to perform, and it can
also increase the risk of inhalation of asbestos fibers. The identification and characterization of areas
contaminated by asbestos using remote sensing techniques represent a valid alternative to census methods,
traditionally based on visual inspection of surfaces and in situ sampling to be analyzed later in the laboratory.
The aim of this work was to explore the possibilities of using machine learning techniques to identify possible
asbestos-contaminated areas and ACMs by using PRISMA satellite imagery in areas where chrysotile was
once extracted, processed and used in asbestos-containing products (ACPs). The study area is located in the
Balangero’s asbestos mine site. More in detail, Principal Component Analysis (PCA) was performed on a
Visible, Near-InfraRed and Short-Wave InfraRed (VNIR-SWIR) PRISMA image to reduce data
dimensionality and used as an exploratory analysis tool. Classification And Regression Trees (CART)
technique was finally utilized to test a classification of six predetermined classes on the panchromatic image.
1 INTRODUCTION
In many countries, asbestos contaminated areas are
still a relevant issue. Asbestos was widely used during
the 20th century thanks to its important physical and
mechanical characteristics.
There is not a group of minerals that, from a
mineralogical point of view, goes under the name
’asbestos’, but there are various mineral types that can
be distinguished based on their crystallographic and
chemical characteristics. According to the European
applicable legal references, the general term
‘asbestos’ is used to identify six naturally occurring
a
https://orcid.org/0000-0001-6935-2686
b
https://orcid.org/0000-0003-1914-7275
c
https://orcid.org/0000-0003-4739-1582
d
https://orcid.org/0000-0003-2435-5212
e
https://orcid.org/0000-0002-4295-0704
f
https://orcid.org/0000-0002-2814-8459
* Corresponding author: daniele.taddei@uniroma1.it, via
Eudossiana 18, 00184 Rome, Italy, Tel:+39-3471866206
silicate minerals belonging to the serpentine
(Chrysotile) and amphibole (Amosite, Crocidolite,
Tremolite, Anthophyllite and Actinolite). They can
be found in several different crystalline forms, but
only the fibrous forms are classified as asbestos
(Council of the European Union, 2003). Based on
numerous epidemiological studies carried out since
the 1960s and proving the carcinogenic nature of
these fibers, all the asbestos minerals have been
classified as carcinogens by the International Agency
for Research on Cancer (IARC) (Paglietti et al.,
2016). Many countries like Italy, have thus banned
the production, importation, processing and
distribution of Asbestos-Containing Products (ACPs)
150
Bonifazi, G., Capobianco, G., Gasbarrone, R., Serranti, S., Bellagamba, S. and Taddei, D.
Data Fusion of PRISMA Satellite Imagery for Asbestos-containing Materials: An Application on Balangero’s Mine Site (Italy).
DOI: 10.5220/0011059400003209
In Proceedings of the 2nd International Conference on Image Processing and Vision Engineering (IMPROVE 2022), pages 150-157
ISBN: 978-989-758-563-0; ISSN: 2795-4943
Copyright
c
2022 by SCITEPRESS – Science and Technology Publications, Lda. All rights reserved
(i.e. roofing sealant, pipe lagging, duct tape, furnace
cement and glue for flooring, etc.) and Asbestos-
Containing Materials (ACMs) (i.e. corrugated cement
sheets, flat cement sheets, etc.) and have
recommended action plans for the mapping and safe
removal of asbestos from public and private buildings
and remediation of highly contaminated areas
(Paglietti et al., 2016). The procedure to identify,
classify and map ACMs and contaminated areas is
considered one of the most important aspects for the
purpose of remediation; this procedure performed by
skilled workers can be very long and difficult to
perform, and it can also increase the risk of inhalation
of asbestos fibers. Scientific literature reports many
studies on the utilization of remote sensing techniques
to map asbestos in anthropic and natural environment,
using different approaches (Amano et al., 2008; Chen
et al. 2012; Aplin et al. 2008; Blaschke, 2010) as
hyperspectral remote sensing (Frassy et al., 2014;
Marino et al. 2001; Massarelli et al. 2017). Several
studies have also explored the abilities to identify
ACMs by HyperSpectral Imaging (HSI) proximal
sensing in Short-Wave InfraRed (SWIR) (Bonifazi et
al., 2018; Bonifazi et al. 2019; Serranti et al. 2019).
Aim of this work was to explore the possibilities of
using machine learning techniques to identify possible
asbestos-contaminated areas and ACMs by using
PRISMA (Hyperspectral PRecursor of the Application
Mission) satellite imagery (ASI, 2009) in areas where
chrysotile was once extracted, processed, and used in
ACPs. Principal Component Analysis (PCA) was
performed on a Visible and Near-InfraRed - Short-
Wave InfraRed (VNIR-SWIR) PRISMA image to
reduce data dimensionality and used as an exploratory
analysis tool. Classification And Regression Trees
(CART) technique was used to test a classification of
six classes (i.e. ‘ACM’, ‘Urban Area’, ‘Anthropogenic
vegetation’, ‘Natural vegetation’, ‘Water’,
‘Balangero’s mine’), predetermined on the
panchromatic image. The classification was performed
on a novel dataset, where the panchromatic image was
fused with the PCA scores resulting from the
application of PCA on the VNIR-SWIR dataset. The
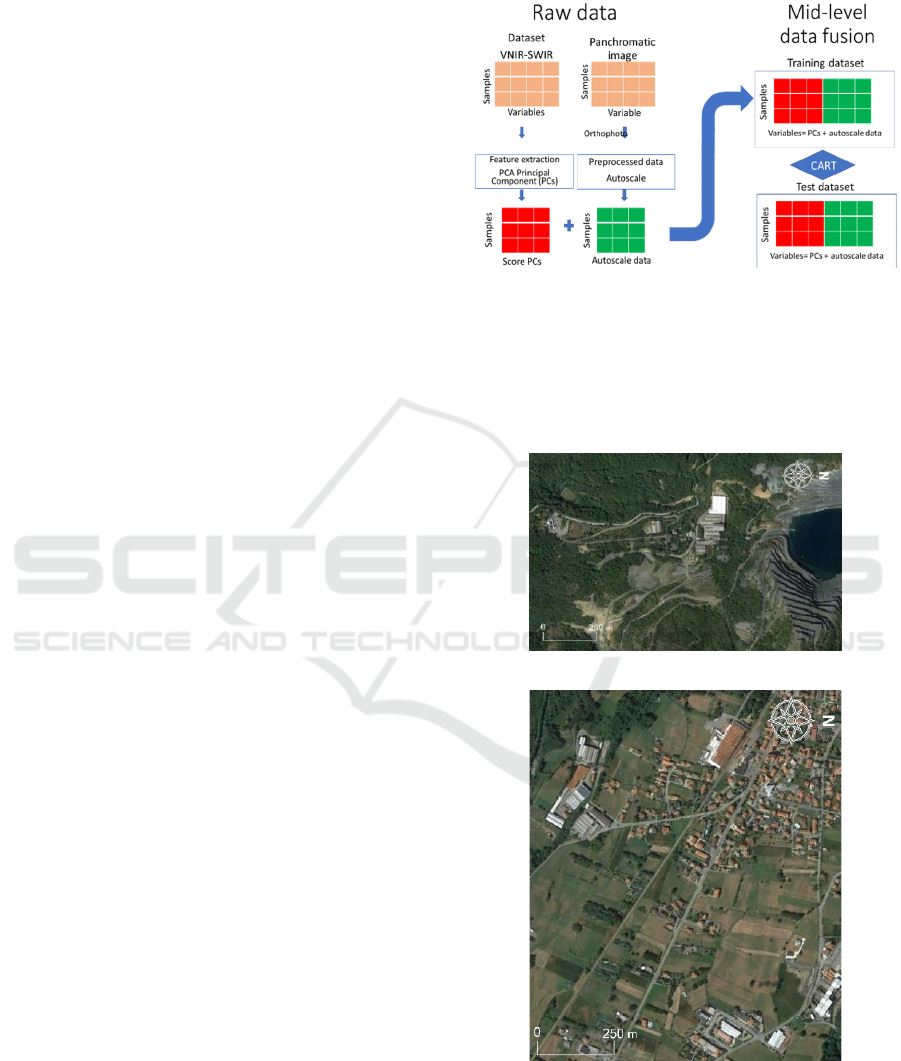
data fusion strategy selected was mid-level (Figure 1).
According to this procedure the features extracted from
the different blocks are concatenated to build a single
array which is then processed by the desired
chemometric technique (Biancolillo et al. 2014).
2 MATERIALS AND METHODS
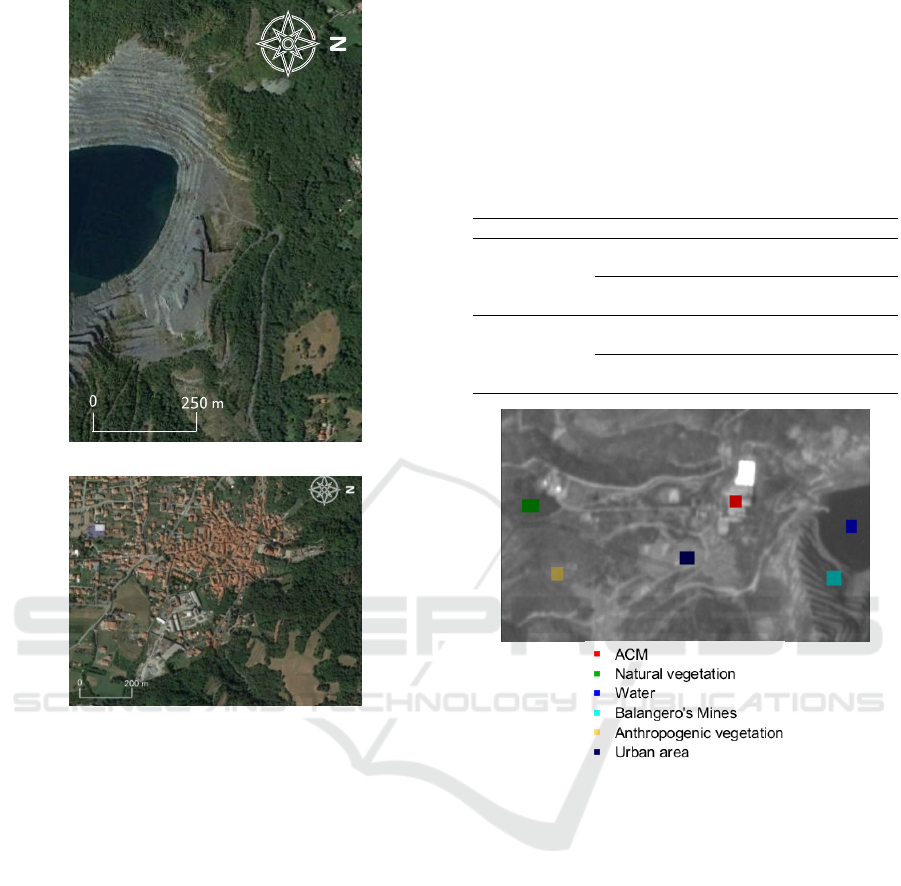
The studied areas are located near Turin, in the
Piedmont region (Northern Italy), the former
Balangero’s and Corio’s asbestos mine site (Figure 2
and Figure 3).
Figure 1: Scheme of the data-fusion and classification
approach adopted.
Figure 2 shows an asbestos mining (2a) characterized
by the presence of building roofs containing asbestos
and a rural area (2b) with building roofs where
asbestos presence was not detected.
(a)
(b)
Figure 2: Balangero’s asbestos mining site with building
roofs containing asbestos (a) and rural areas with building
roofs without asbestos (b).
Data Fusion of PRISMA Satellite Imagery for Asbestos-containing Materials: An Application on Balangero’s Mine Site (Italy)
151
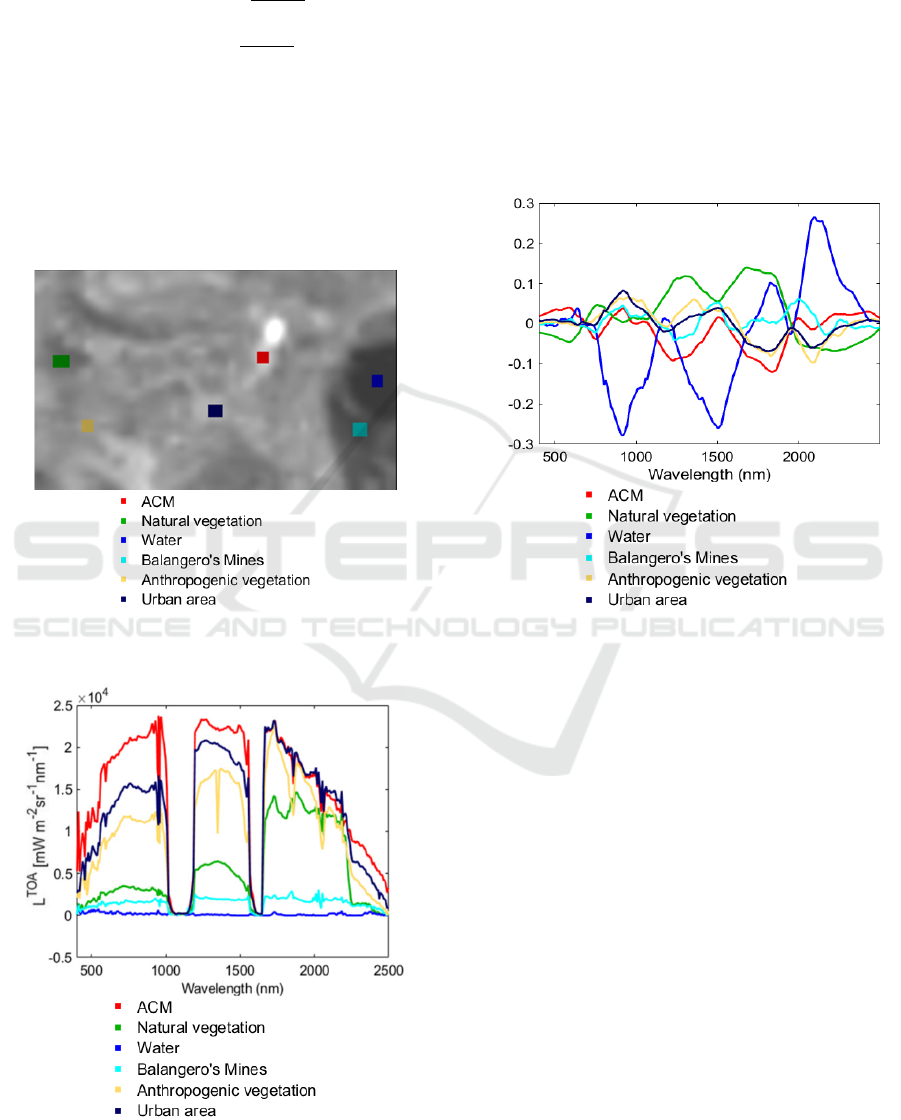
(a)
(b)
Figure 3: Portion of the underwater asbestos open-pit mine
with presence of natural vegetation (a) and urban area with
the presence of an abandoned industrial site where roofs
contain asbestos (b).
Figure 3a shows another portion of asbestos mine
with presence of natural vegetation. Figure 3b shows
and urban area with the presence of an abandoned
industrial site where building roofs contain asbestos.
The datasets corresponding to Figure 2 were used as
calibration set, while the datasets corresponding to
Figure 3 were utilized as validation set.
2.1 Data Handling and Processing
The PRISMA equipment is made up of an imaging
spectrometer, able of acquiring VNIR (Visible and
Near-InfraRed) and SWIR (Short-Wave InfraRed)
images (~ 250 bands), with a spatial resolution of 30
m on a swath of 30 km, and a panchromatic camera
with spatial resolution of 5 m. The spectral resolution
is about 12 nm in the spectral range of 400-2500 nm,
that are VNIR and SWIR regions (ASI, 2009).
The PRISMA VNIR-SWIR hyperspectral image
and the panchromatic image datasets were imported
into the MATLAB® environment (R2021a, Version
9.10, The Mathworks, Inc.). The details of utilized
dataset are shown in Table 1.
Table 1: Dataset sizes.
Area 1 Area 2
Raw data
VNIR-SWIR
Training
dataset
193*304*23
(Figure 1a)
213*224*234
(Figure 1 b)
Prediction
dataset
125*191*234
(Figure 2a)
240*190*234
(Figure 2b)
Raw data
panchromatic
image
Training
dataset
193*304*1
(Figure 1a)
213*224*1
(Figure 1 b)
Test
dataset
125*191*1
(Figure 2a)
240*190*1
(Figure 2b)
Figure 4: Region of Interests (ROIs) selected on the
panchromatic image.
The imported data were analyzed using the
PLS_Toolbox (Version 8.2 Eigenvector Research,
Inc.) (Wise et al., 2006) and Statistics and Machine
Learning Toolbox. The PLS_Toolbox was used to
pre-process data and for performing the Principal
Component Analysis (PCA), while Statistics and
Machine Learning Toolbox was utilized for setting up
the Classification And Regression Trees (CART).
2.2 Class Setting
From a small part of the panchromatic image,
depicting near a half of the open-pit mine and its
surrounding, six Region of Interests (ROIs) were
selected and the following classes were set: ACM,
Urban Area, Anthropogenic vegetation, Natural
vegetation, Water and Balangero’s mine (Figure 4).
IMPROVE 2022 - 2nd International Conference on Image Processing and Vision Engineering
152

The above-mentioned classes were then selected
according to surface truth to the ground. In ‘ACM’
was included Asbestos Containing Materials (i.e.
Eternit corrugated roofing). In ‘Urban Area’ were
included areas characterized by urban morphology. In
‘Anthropogenic vegetation’ were selected areas with
cultivated crops. In ‘Natu-ral vegetation’ were
included areas with woods and sparse trees patterns.
While, in ‘Water’ class was included the underwater
open-pit mine area. Finally, ‘Balangero’s mine’ class
was chosen selecting barren areas near the open-pit
mine. The class set of the panchromatic image was
then transferred to the VNIR-SWIR dataset.
2.3 Data Pre-processing
Spectral data preprocessing is a necessary step in
order to reduce detector noise, to eliminate the
spectral nonuniformity due to the illumination,
scattering phenomena and the influence of the
changing environmental conditions. Data pre-
treatment is also addressed to better solve the spectra
information by enhancing differences among the
classes. To choose the right pre-processing
algorithms, different pre-processing algorithms were
tested among those widely adopted (Rinnan &
Engelsen, 2009). The algorithms combination which
gave the best data decomposition of the class scores
were selected. The adopted pre-processing
combination was spatial Median Filter (MF),
Standard Normal Variate (SNV), Gap-Segment (GS)
1
st
Derivative and Multiway Center (MC).
2.4 Principal Component Analysis
The Principal Component Analysis (PCA) is a well-
known data exploratory method, widely adopted to
HSI datasets, that gives the possibility to have an
overview of complex multivariate data. PCA allows to
reduce the dimensionality of a data matrix containing
multiple interrelated variables, while retaining as much
as possible of the variation present in the data set (Bro
et al., 2014). In this case, PCA was carried out to detect
outliers and choose the data to built-up the classifiers
by reducing the dimensionality of the dataset. The PCA
was performed on the VNIR-SWIR dataset. Six PCs
were chosen. The scores of the performed PCA were
then concatenated with the panchromatic image.
2.5 Classification and Regression Trees
(CART)
Classification And Regression Trees (CART), a non-
parametric statistical technique, was used to classify
the six classes on the panchromatic image fused with
the PCA scores (Shao et al. 2012). Classification And
Regression Trees (CART), a non-parametric
statistical technique, was used to classify the six
classes on the panchromatic image fused with the
PCA scores. CART classification algorithm,
developed by Breiman et al. (1984), allows to build a
decision tree based on Gini’s impurity index as
splitting criterion. In classification and regression
problems, CART algorithm produces a decision tree
describing a response varying as a function of
multiple explanatory variables. A tree hierarchy is
produced by the subdivision process.
In the tree hierarchy, the observation subsets are
represented by the nodes, while the leaves are the
final nodes. A binary model, formulated in each node,
is responsible for the subdivision process. In each
node, all the samples satisfying the model are
clustered in a sub-group, while the remaining nodes
are assigned to another subgroup. The classification
process therefore follows a path along the tree from
the root towards a final leaf. This process can be
synthetized in three steps. In the 1
st
step of CART
analysis, the binary split procedure allows to build the
maximum tree by finding the best split which
maximizes the splitting criterion. Usually, overfitting
can occur when the maximum tree is overgrown
closely describing the used training set. To correct the
overfitted model a pruning process occurs in the 2
nd
step. The pruned model results in multiple less
complex tree, that are derived from the maximum
tree. In the 3
rd
step, finally, a cross-validation process
helps to select the optimal tree (Deconinck et al.
2006).
The main advantage of CART algorithm relies on
the fact of being nonparametric. Moreover, it can be
used in combination with other prediction algorithms
and by combining both testing with a test data and
cross-validation thus enabling to more precisely
measure the quality of the model fitting.
2.6 Classification Performance Metrics
The performance evaluation of the classification
methods was carried out in terms of prediction maps,
that is false colour images representing the
classification and in terms of the statistical
parameters: Sensitivity and Specificity (Ballabio &
Todeschini, 2009). In more detail, the Sensitivity
represents the ability of determined classifier to
correctly recognize samples belonging to a specified
class and is defined by Equation (1). On the other
hand, Specificity relates to the model ability to
Data Fusion of PRISMA Satellite Imagery for Asbestos-containing Materials: An Application on Balangero’s Mine Site (Italy)
153
correctly reject samples belonging to all the other
classes as defined by Equation (2).
(1)
(2)
TP are the total number of True Positive, FN the
total number of False Negative, TN the total number
of True Negative and FP the total number of False
Positive. Sensitivity and Specificity were calculated
according to the number of correctly or not correctly
assigned pixel to each defined class, with reference to
calibration (CAL), cross-validation (CV) and to the
prediction of the validation set (PRED).
Figure 5: Region of Interests (ROIs) transferred from the
panchromatic image to the VNIR-SWIR dataset.
Figure 6: Raw spectra of the six classes. (L
TOA
: Top of
Atmosphere radiance).
3 RESULTS AND DISCUSSION
The six Region of Interests (ROIs) selected on the
panchromatic image and transferred to the VNIR-
SWIR dataset (Figure 5) and corresponding mean
spectra are shown in Figure 6. The average spectra of
the six classes show significant spectral differences
but are also very noisy. For this reason, in order to
reduce the noise and emphasize the spectral variation
(as already explained in the Chapter 2.3), the data
were pre-processed as shown in Figure 7.
Figure 7: Pre-processed spectra averaged for the six classes.
The adopted pre-processing combination is spatial Median
Filter (MF), Standard Normal Variate (SNV), Gap-Segment
(GS) 1st Derivative and Multiway Center (MC).
After data preprocessing, a PCA model was
created (Figure 8). PCA model allows to capture
99.69% of the total variance with six principal
components. In detail, the PCA score plot of PC1 and
PC3 shows 6 separated clusters corresponding to the
6 different classes considered (i.e. ‘ACM’, ‘Urban
Area’, ‘Anthropogenic vegetation’, ‘Natural
vegetation’, ‘Water’ and ‘Balangero’s mine’). The
positive space of scores on PC3 is mainly influenced
by ‘Balangero’s Mines’ spectra. The negative space
of scores on PC1 is mainly influenced by water of
Balangero’s lake. The combination of the positive
value of scores PC1 and negative value of scores on
PC3 allows the separation of ‘Urban area’,
‘Anthropogenic’ and ‘Natural vegetation’. Finally,
the ACM class is separated from the other classes by
the combination of negative PC1 and positive PC3
values.
Pre-processed L
TOA
IMPROVE 2022 - 2nd International Conference on Image Processing and Vision Engineering
154
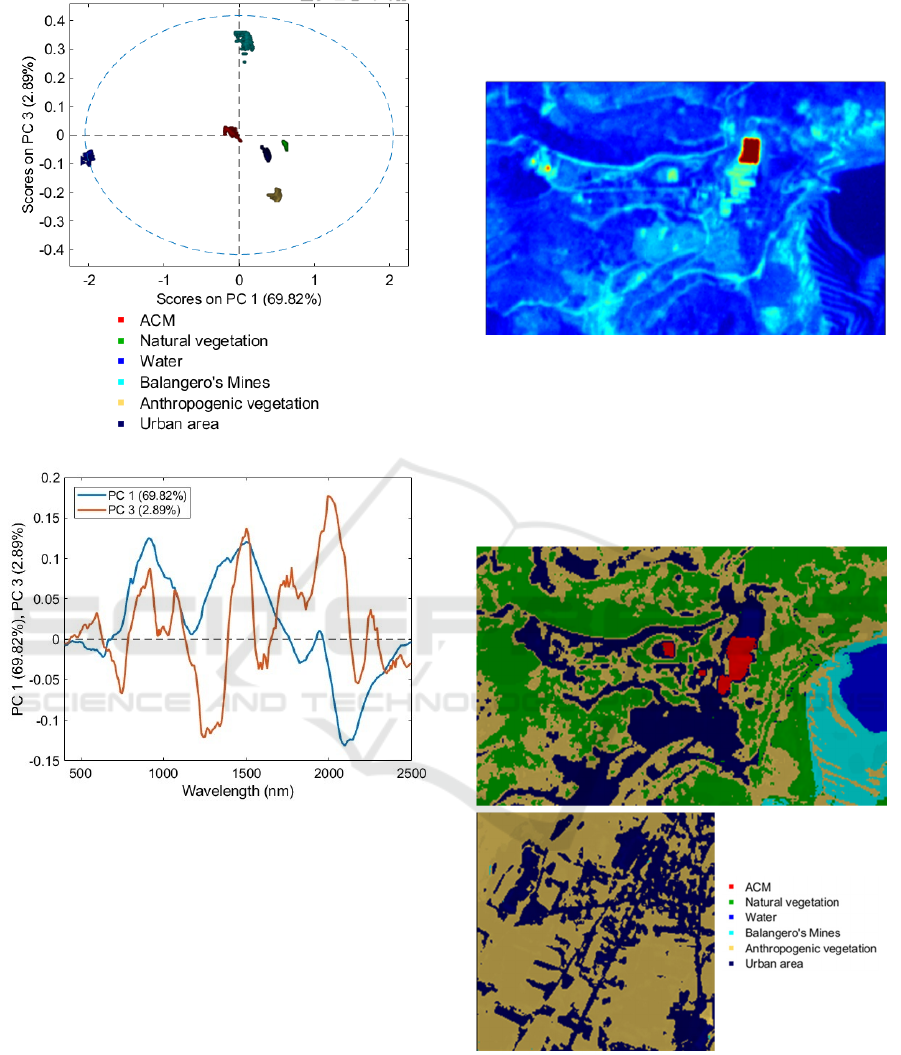
a
b
Figure 8: PCA scores plot (a) and loadings plot (b) of the
first and third PCs.
The negative space of scores on PC1 is mainly
influenced by water of Balangero’s lake. The
combination of the positive value of scores PC1 and
negative value of scores on PC3 allows the separation
of ‘Urban area’, ‘Anthropogenic’ and ‘Natural
vegetation’. Finally, the ACM class is separated from
the other classes by the combination of negative PC1
and positive PC3 values.
Starting from the good separation obtained, this
PCA model was used for the data reduction of
PRISMA hyperspectral datasets. The PCA-reduced
datasets were concatenated to the corresponding
panchromatic images as shown in the example
reported in Figure 9. In detail, the concatenated
procedure allows to combine chemical information
coming from VNIR-SWIR range with the shapes and
contours of the topographical details obtained from
the panchromatic image.
Figure 9: False color image of the novel dataset, resulting
from the fusion of VNIR-SWIR PCA scores and the
panchromatic of the studied area.
Starting from this new data set, the classes for the
calibration dataset were set as shown in Figure 10.
The calibration set was then created and utilized to
build the CART model.
Figure 10: Class map of the Training set.
The results in terms of Sensitivity and Specificity
(Table 2) confirm the good performance of the model,
with values ranging from 0.816 (‘ACM’ class) to
0.980 (‘Water’ class) and 0.979 (‘Anthropogenic
vegetation’ class) to 1.00 (‘Water class’),
respectively, both in calibration and cross-validation.
Data Fusion of PRISMA Satellite Imagery for Asbestos-containing Materials: An Application on Balangero’s Mine Site (Italy)
155
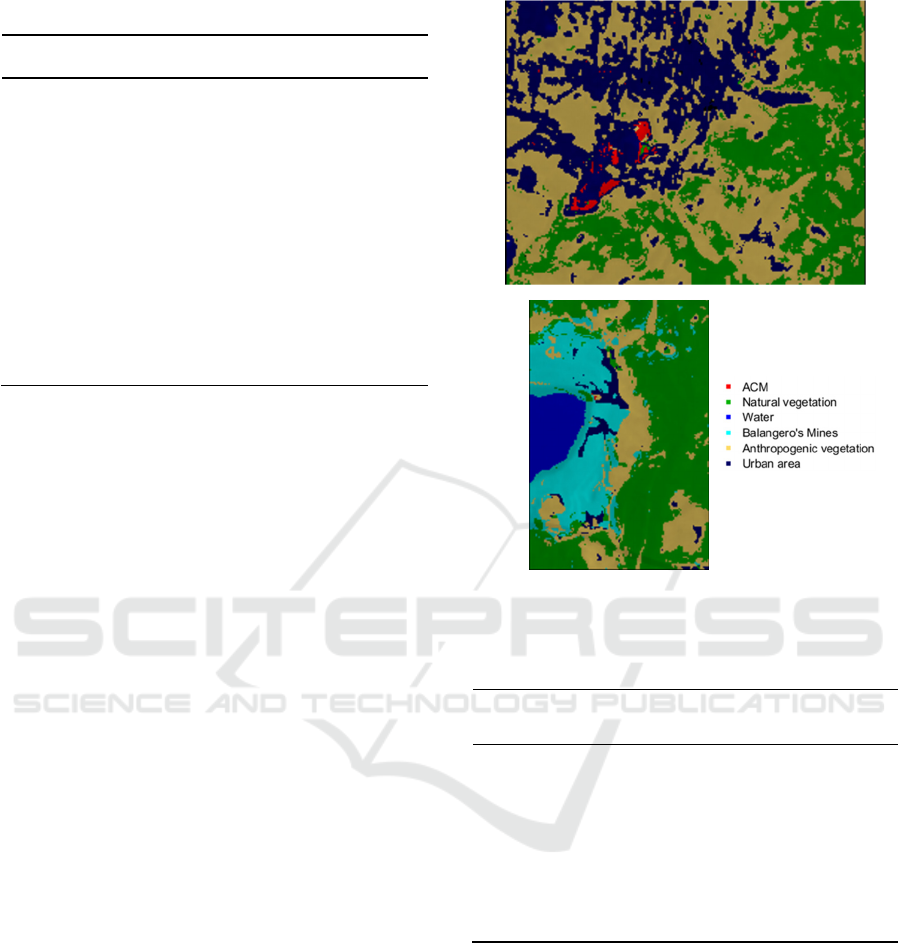
Table 2: results in terms of Sensitivity and Specificity.
Class
Sens.
(Cal)
Spec.
(Cal)
Sens.
(CV)
Spec.
(CV)
ACM 1,000 1,000 0.816 0.999
Anthropogenic
vegetation
1,000 1,000 0.981 0.979
Balangero's
Mines
1,000 1,000 0.946 0.997
Natural
vegetation
1,000 1,000 0.962 0.992
Urban area 1,000 1,000 0.963 0.988
Water 1,000 1,000 0.980 1.000
The CART prediction map of the validation set is
reported in Figure 11, whereas the performance
metrics of the classification model applied to the
validation set are shown in Table 3. The results in
terms of prediction images (Figure 11) are in
agreement with those achieved in the calibration
phase. By analyzing the performance metric
parameters reported in Table 3, despite a slight
decrease in sensitivity in the identification of ACM
roofs, is clear that the identification of the main
structures with asbestos is correct, confirming the
success of the proposed test.
4 CONCLUSIONS
In this paper, a novel approach was developed and
implemented to identify ACM from "Urban Area",
Anthropogenic and natural vegetation", "Water" and
“Balangero’s mine”.
PRISMA satellite hyperspectral images were
elaborated through multivariate statistical analysis in
order to extract the chemical features of the classes.
Subsequently, the PRISMA hyperspectral data,
reduced by PCA, were concatenated with the
panchromatic image in order to combine chemical
information with the shapes and contours of the
topographical details. Afterwards, starting from the
fused dataset, a CART classification model was
developed in order to recognize the roofing
containing asbestos from other objects on the images.
The adopted procedure proved to have a
significant discriminating capacity in terms of
sensitivity and specificity enabling the possibility to
use this approach for more extended areas.
Figure 11: CART prediction map.
Table 3: Performance metrics of CART classification in
prediction calculated on the test set.
Class
Sens.
(Pred)
Spec.
(Pred)
ACM 0.756 0.997
Anthropogenic vegetation 0.993 0.981
Balangero's Mines 0.999 0.993
Natural vegetation 0.937 0.997
Urban area 0.980 0.994
Water 1.000 1.000
The possibility of a systematic and integrated use
of PRISMA image combined with machine learning
tools for ACMs identification, proved to be a
complementary method for a faster identification and
mapping of contaminated areas, with less risk of
exposure for operators and the possibility to perform
a fast and reliable survey of ACPs by remote sensing.
The fulfilment of the previous mentioned goals
could produce positive environmental impacts, as
well as big economic benefits related to the lower
identifying and mapping costs.
IMPROVE 2022 - 2nd International Conference on Image Processing and Vision Engineering
156

ACKNOWLEDGEMENTS
The study was developed in the framework of INAIL
(italian National Institute for Insurance against
Accidents at Work) project: BRIC ID 60/2 -
Valutazione e comparazione dei livelli di
informazione ottenibili da remoto con sensoristica
ottica innovativa per l’identificazione di MCA in
diversi contesti del territorio nazionale; confronto dei
dati ottenuti con risultati analitici acquisiti in
laboratorio. Definizione di tecniche di
campionamento ed analisi per il monitoraggio della
presenza di erionite.
REFERENCES
Amano, Y, Takagi, N and Getz, AFH. (2008). A study on
the classification of urban region using hyper-spectrum
data at AVIRIS. In: Geoscience and Remote Sensing
Symposium, 2008. IGARSS 2008. IEEE International.,
Boston, MA, USA: IEEE, pp. 687-690.
Aplin, P. & Smith, G.M. (2008). Advances in Object Based
Image Classification. The International Archives of the
Photogrammetry, Remote Sensing and Spatial
Informatio Sciences, Beijing, Vol.37, 725-728.
http://www.isprs.org/proceedings/XXXVII/congress/7
_pdf/4_WG-VII-4/45.pdf
Ballabio, D. & Todeschini, R. (2009). Multivariate classifi-
cation for qualitative analysis. Infrared spectroscopy for
food quality analysis and control, 83, e102.
Biancolillo, A., Bucci, R., Magrì, A. L., Magrì, A. D., &
Marini, F. (2014). Data-fusion for multiplatform
characterization of an Italian craft beer aimed at its
authentication. Analytica chimica acta, 820, 23-31.
Blaschke, T. (2010). Object-based Image Analysis for
Remote Sensing. ISPRS Journal of Photogrammetry
and Remote Sensing, 65, 2-16.)
Bonifazi, G., Capobianco, G., & Serranti, S. (2018).
Asbestos containing materials detection and
classification by the use of hyperspectral imaging.
Journal of hazardous materials, 344, 981-993.
Bonifazi, G., Capobianco, G., & Serranti, S. (2018).
Asbestos containing materials detection and
classification by the use of hyperspectral imaging.
Journal of hazardous materials, 344, 981-993.
Bonifazi, G., Capobianco, G., & Serranti, S. (2019).
Hyperspectral imaging and hierarchical PLS-DA
applied to asbestos recognition in construction and
demolition waste. Applied Sciences, 9(21), 4587.
Breiman, L., Friedman, J., Olshen, R., & Stone, C. (1984).
Cart. Classification and Regression Trees; Wadsworth
and Brooks/Cole: Monterey, CA, USA.
Bro, R., & Smilde, A. K. (2014). Principal component
analysis. Analytical methods, 6(9), 2812-2831.
Chen, Z., Ning, X. and Zhang, J. (2012). Urban Land Cover
Classification Based on WorldView-2 Image Data.
IEEE International Symposium on Geomatics for
Integrated Water Resource Management, Lanzhou, 19-
21 October 2012, 1-5.
Deconinck, E., Zhang, M. H., Coomans, D., & Vander
Heyden, Y. (2006). Classification tree models for the
prediction of blood− brain barrier passage of drugs.
Journal of chemical information and modeling, 46(3),
1410-1419.
Directive 2003/18/EC of the European Parliament and of
the Council of 27 March 2003 amending Council
Directive 83/477/EEC on the protection of workers
from the risks related to exposure to asbestos at work.
Frassy, F., Marchesi, A., Candiani, G., Rusmini, Marco.,
Maianti, P., Marchesi, A., Rota Nodari, F., Della Via,
G., Albonico, C., Gianinetto, Marco. (2014) "Mapping
Asbestos Cement Roofing with Hyperspectral Remote
Sensing over a Large Mountain Region of the Italian
Western Alps," Sensors, vol. 14, no. 9, pp. 1590015913,
doi: 10.3390/s140915900.
Marino, C. M., Panigada, C. and Busetto, L. (2001)
Airborne hyperspectral remote sensing applications in
urban areas: asbestos concrete sheeting identification
and mapping, IEEE/ISPRS Joint Workshop on Remote
Sensing and Data Fusion over Urban Areas (Cat.
No.01EX482), pp. 212216, doi: 10.1109/DFUA.20
01.985882.
Massarelli, C., Matarrese, R., Uricchio, V. F., Muolo, M.
R., Laterza M. & Ernesto L. (2017) Detection of
asbestos containing materials in agroecosystem by the
use of airborne hyperspectral CASI1500 sensor
including the limited use of two UAVs equipped with
RGB cameras. International Journal of Remote
Sensing, 38:810, 21352149, DOI: 10.1080/01431161.
2016.1226528
Paglietti, F., Malinconico, S., della Staffa, B. C.,
Bellagamba, S., & De Simone, P. (2016). Classification
and management of asbestos-containing waste:
European legislation and the Italian experience. Waste
management, 50, 130-150.
Rinnan, Å., Van Den Berg, F., & Engelsen, S. B. (2009).
Review of the most common pre-processing techniques
for near-infrared spectra. TrAC Trends in Analytical
Chemistry, 28(10), 1201-1222.
Serranti, S., Bonifazi, G., Capobianco, G., Malinconico, S.,
& Paglietti, F. (2019, May). Hyperspectral imaging
applied to asbestos containing materials detection:
specimen preparation and handling. In Advanced
Environmental, Chemical, and Biological Sensing
Technologies XV (Vol. 11007, p. 110070S).
International Society for Optics and Photonics.
The PRISMA mission (PDF). ASI. 4 September 2009.
Archived from the original (PDF) on 4 October 2013.
Retrieved 23 August 2013.
Wise, B. M., Gallagher, N. B., Bro, R., Shaver, J. M.,
Windig, W., & Koch, R. S. (2006). Chemometrics
tutorial for PLS_Toolbox and Solo. Eigenvector
Research, Inc, 3905, 102-159.
Shao, Y., Lunetta, R. S. (2012) Comparison of support
vector machine, neural network, and CART algorithms
for the landcover classification using limited training
data points. ISPRS Journal of Photogrammetry and
Remote Sensing, Volume 70, Pages 7887.
Data Fusion of PRISMA Satellite Imagery for Asbestos-containing Materials: An Application on Balangero’s Mine Site (Italy)
157
