
Detecting Tourette’s Syndrome in Anatomical Regions of the Brain
through MRI Analysis and Naive Bayes Classifier
Murilo Costa De Barros
1 a
, Kaue Tartarotti Nepomuceno Duarte
2 b
, Wang-Tso Lee
3 c
,
Chia-Jui Hsu
4
and Marco Antonio Garcia De Carvalho
1 d
1
Computing Visual Laboratory, School of Technology UNICAMP, R. Paschoal Marmo, 1888,
Jd. Nova It
´
alia, 13484-332, Limeira, S
˜
ao Paulo, Brazil
2
Vascular Imaging Laboratory, Calgary University, 2500 University Dr. NW, Calgary, AB T2N 1N4, Canada
3
Department of Pediatrics, National Taiwan University Children’s Hospital, Taipei, Taiwan
4
Department of Pediatrics, National Taiwan University Hospital Hsinchu Branch, Taipei, Taiwan
Keywords:
Classification, Tourette Syndrome, GLCM, Naive Bayes, Image Processing, Segmentation.
Abstract:
Tourette Syndrome (TS) is an inherited condition represented by involuntary vocal and motor movements
(tics). Nowadays, there is no available cure, only psychological treatments to inhibit it, requesting the use of
medication in rare cases. The importance of diagnosing Tourette’s in childhood enables a range of possible
treatments that would decrease the intensity of TS, and in some cases, even stop it. In most cases, the TS
diagnosis considers only clinical assessment. Analyzing the brain and its anatomical regions via imaging
data can provide relevant information in order to assist doctors. This work aims to propose an approach in
order to identify the most affected anatomical region of the brain by TS. The approach consists of three major
steps: (i) the brain is segmented in its anatomical regions; (ii) texture patterns are extracted via Gray-level
Co-occurrence Matrix for each region; finally, (iii) each brain region is evaluated using Naive Bayes classifier,
determining the presence or absence of TS. We use MRI images from 68 subjects around nine years old
equally divided whether has TS or not. The regions from the limbic system were relevant in the diagnosis:
right-side accumbens reached 68% of accuracy; posterior and central parts of corpus callosum ranked in the
top four positions. Combining the top five most predictive regions led our approach to reach 78% of accuracy.
The results were significant in detecting the most affected regions in TS and providing a reliable approach to
classify the brain regions accordingly.
1 INTRODUCTION
Tourette’s Syndrome (TS) is a genetic-pathologic dis-
order that comprises neurophysiological and neu-
roanatomical aspects in subjects, commonly devel-
oped in between two and eighteen years old, the ma-
jority in male subjects (Hounie, 2006).
TS is characterized by uncontrolled movement
disorders (motor or vocals tics); the most common
tics are frequently blinking, shaking shoulders, and
other involuntary movements. Repeated vocalization
urges may be developed, such as coughing, grunting,
whistling, and easing the throat These tics can often
a
https://orcid.org/0000-0003-2452-8128
b
https://orcid.org/0000-0002-4074-3672
c
https://orcid.org/0000-0003-3231-9764
d
https://orcid.org/0000-0002-6303-5564
be temporarily suppressed by patients who have TS,
becoming overwhelming after some time. Figure 1 il-
lustrates the most common uncontrolled facial move-
ments caused by TS. The most complex and rare tics
are related to subjects who have TS; three of them of-
ten serves as guidelines to diagnose TS:(1) coprolalia:
Vocal tics with obscene and offensive words; (2) co-
propraxia: Motor tics with an obscene or offensive
gesture; (3) echolalia: Vocal tics using words repeti-
tion or word sounds (Teixeira et al., 2011).
Kobierska (Kobierska et al., 2014) stated that co-
prophenomena, i.e., actions of coprolalia and copro-
praxia, is developed in the peak period of TS where
the tics start becoming more aggressive between 8 and
12-year-old phase, often in people with mental disor-
ders and who have behavioral problems.
TS patients may present obsessive thoughts when
they see a picture, a person, or any uncomfortable
26
Costa De Barros, M., Duarte, K., Lee, W., Hsu, C. and Garcia De Carvalho, M.
Detecting Tourette’s Syndrome in Anatomical Regions of the Brain through MRI Analysis and Naive Bayes Classifier.
DOI: 10.5220/0011056800003209
In Proceedings of the 2nd International Conference on Image Processing and Vision Engineering (IMPROVE 2022), pages 26-33
ISBN: 978-989-758-563-0; ISSN: 2795-4943
Copyright
c
2022 by SCITEPRESS – Science and Technology Publications, Lda. All rights reserved
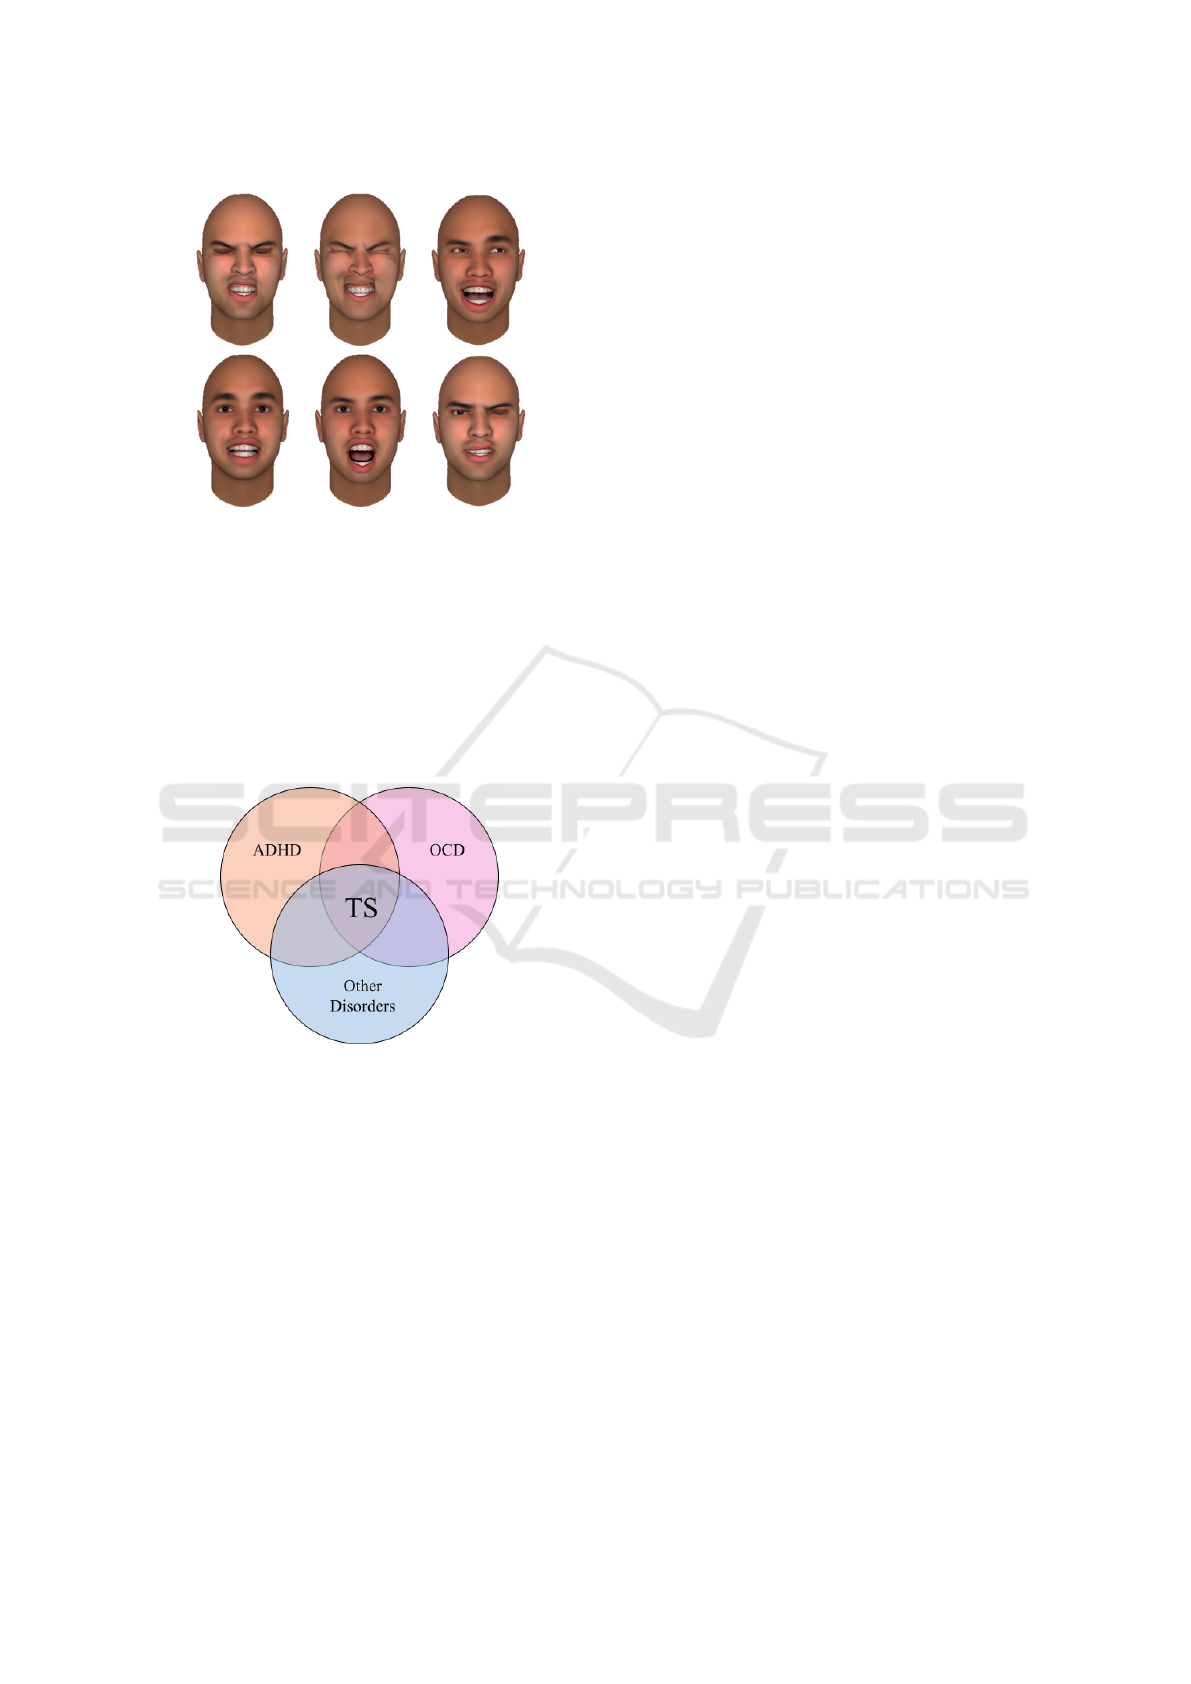
Figure 1: Common uncontrolled facial movements in a sub-
ject affected by TS.
moment that triggers high levels of anxiety and com-
pulsive behaviors, i.e., repetitive actions aiming to re-
lieve the stress caused by those obsessions. Besides,
subjects who have TS may present other disorders
(Hounie, 2006) such as Obsessive-Compulsive Disor-
der (OCD) and Attention Deficit Hyperactivity Disor-
der (ADHD), posing a challenge to diagnose TS inde-
pendently (Figure 2).
Figure 2: Disorders Intersection and TS diagnosis. Source:
Adapted from (Hounie, 2006).
Medical imaging, most specifically Magnetic Res-
onance Imaging (MRI), plays a vital role in identi-
fying TS and has commonly been used in the medi-
cal field to support doctors in their diagnosis (Muller,
2009). However, subtle and imperceptive changes
may occur in distinct anatomical brain regions, pre-
cluding TS identification without clinical assessment.
The yearning for computational approaches to auto-
matically diagnose anatomical variation in subjects
with TS using medical imaging drives the main chal-
lenge of our work.
Nowadays, Artificial intelligence (AI) has been
adopted in different fields to improve their methods
to achieve better outcomes. Not differently, the gap
between AI and the medical field has been narrow-
ing across the years, and it has been vastly used in
diseases such as Alzheimer’s and Parkinson’s. How-
ever, to the best of our knowledge, combining AI for
anatomical brain analysis using medical imaging in
TS is a novelty topic. The main contributions and
features of this work are: (1) computational approach
focused on TS; (2) feature-based information about
brain regions for TS; (3) application of machine learn-
ing to identify the most predictive regions; (4) ensem-
ble of the most predictive brain regions for TS. The
main goal of this work is to propose an approach to
automatically identify the most affected regions of TS
via texture feature extraction and Naive Bayes, em-
ploying only structural MRI.
The remainder of this paper is organized as fol-
lows: Section 2 shows the related work and the gaps
in the literature; the proposed approach is described
in Section 3; Section 4 details the results and the list
of regions affected by TS; finally, Section 5 presents
the summary and conclusions.
2 RELATED WORK
Medical imaging is crucial for TS diagnosis, in ad-
dition to clinical assessments, image processing, and
machine learning, and plays a vital role in interpret-
ing brain information, thus allowing the prediction of
possible outcomes for the subjects.
Muellner (Muellner et al., 2015) proposed an ap-
proach aiming to analyze the depth, opening, length
and thickness of the gray matter groove in exams Dif-
fusion Tensor Imaging (DTI). The author labeled the
areas using the BrainVisa Software, improving the
most affected regions, like the frontal, parietal and
temporal lobes. They considered 104 subjects, half
for TS and half for normal controls. In addition, adult
subjects were considered instead of children, which
differs from the most common approaches in the lit-
erature.
Peterson (Peterson et al., 2007) proposed an ap-
proach to analyzing the morphology of the amygdala
and the hippocampus in MR scans via ANALYZE 7.5
software. The authors focused on identifying the sim-
ilarity of those regions among TS subjects via Eu-
clidean distance. For that, the images were registered
to belong to the exact spatial location. They identified
a smaller amygdala in children with TS.
In Tinaz (Tinaz et al., 2015), an approach was pro-
posed to measure brain changes when patients pause
their medication and treatments. Their dataset com-
prises 26 functional MRIs, where 13 TS subjects are
aged between 18 to 46 years, and 13 normal control
Detecting Tourette’s Syndrome in Anatomical Regions of the Brain through MRI Analysis and Naive Bayes Classifier
27

subjects aged between 22 to 56 years. They reported
that once the treatment had stopped, alterations in the
frontal regions were shown, also reducing the right
stratothalamic nodules.
The eagerness for works that employ machine
learning or feature extraction for TS remains in
the literature since only a few bring a computa-
tional analysis for this syndrome. However, this
type of analysis has been broadly applied in diseases
such as Alzheimer’s and Parkinson’s. Long (Long
et al., 2017) analyzed the morphological changes
for Alzheimer’s disease and its mild cognitive im-
pairment stages using MRI in healthy older peo-
ple. The 3D T1-weighted images were segmented
via FreeSurfer. The images were registered using
FSL flirt to align the brain across the subjects. Next,
the Support Vector Machine (SVM) was adopted for
classification. The findings showed 96.5% accuracy
in the gray matter detection, 91.74% in progressive
Mild Cognitive Impairment (MCI), and 88.99% in the
amygdala and hippocampus detection for stable MCI.
Jafarpour (Jafarpour et al., 2012) proposes a ro-
bust method to analyze MRI via feature extraction and
classification. The authors address 120 MRI scans, 41
for normal control subjects and 79 for comorbidities.
The authors employed a Gray-Level Co-occurrence
Matrix (GLCM) to extract texture features, consider-
ing only a single direction θ = 0 and distance d = 1.
Finally, the descriptor outcome was clustered. They
reported an accuracy higher than 92% using classi-
fiers.
Solana-Lavalle (Solana-Lavalle and Rosas-
Romero, 2021) developed an approach to predict
Parkinson’s disease in MRI scans. Firstly, the brain
regions are segmented, and they are registered and
aligned across distinct subjects. A t map correspond-
ing to the difference between the labeled voxels
and the region of interest is created. They reported
significant results, with 99.01% of accuracy in men
and 96.97% accuracy in women.
In essence, our work differs from the literature
by the following topics: (1) We provide a brain seg-
mentation via Freesurfer and feature extraction for TS
subjects; (2) We propose feature-based classification
using Naive Bayes for TS subjects; (3) We propose
computational TS region analysis according to texture
information; (4) We analyze defining the most critical
regions to detect TS automatically in childhood; (5)
We separated an ensemble of the best predictive re-
gions for TS.
3 PROPOSED APPROACH
This section presents our proposed approach to ad-
dress the problem of detecting TS in brain anatomi-
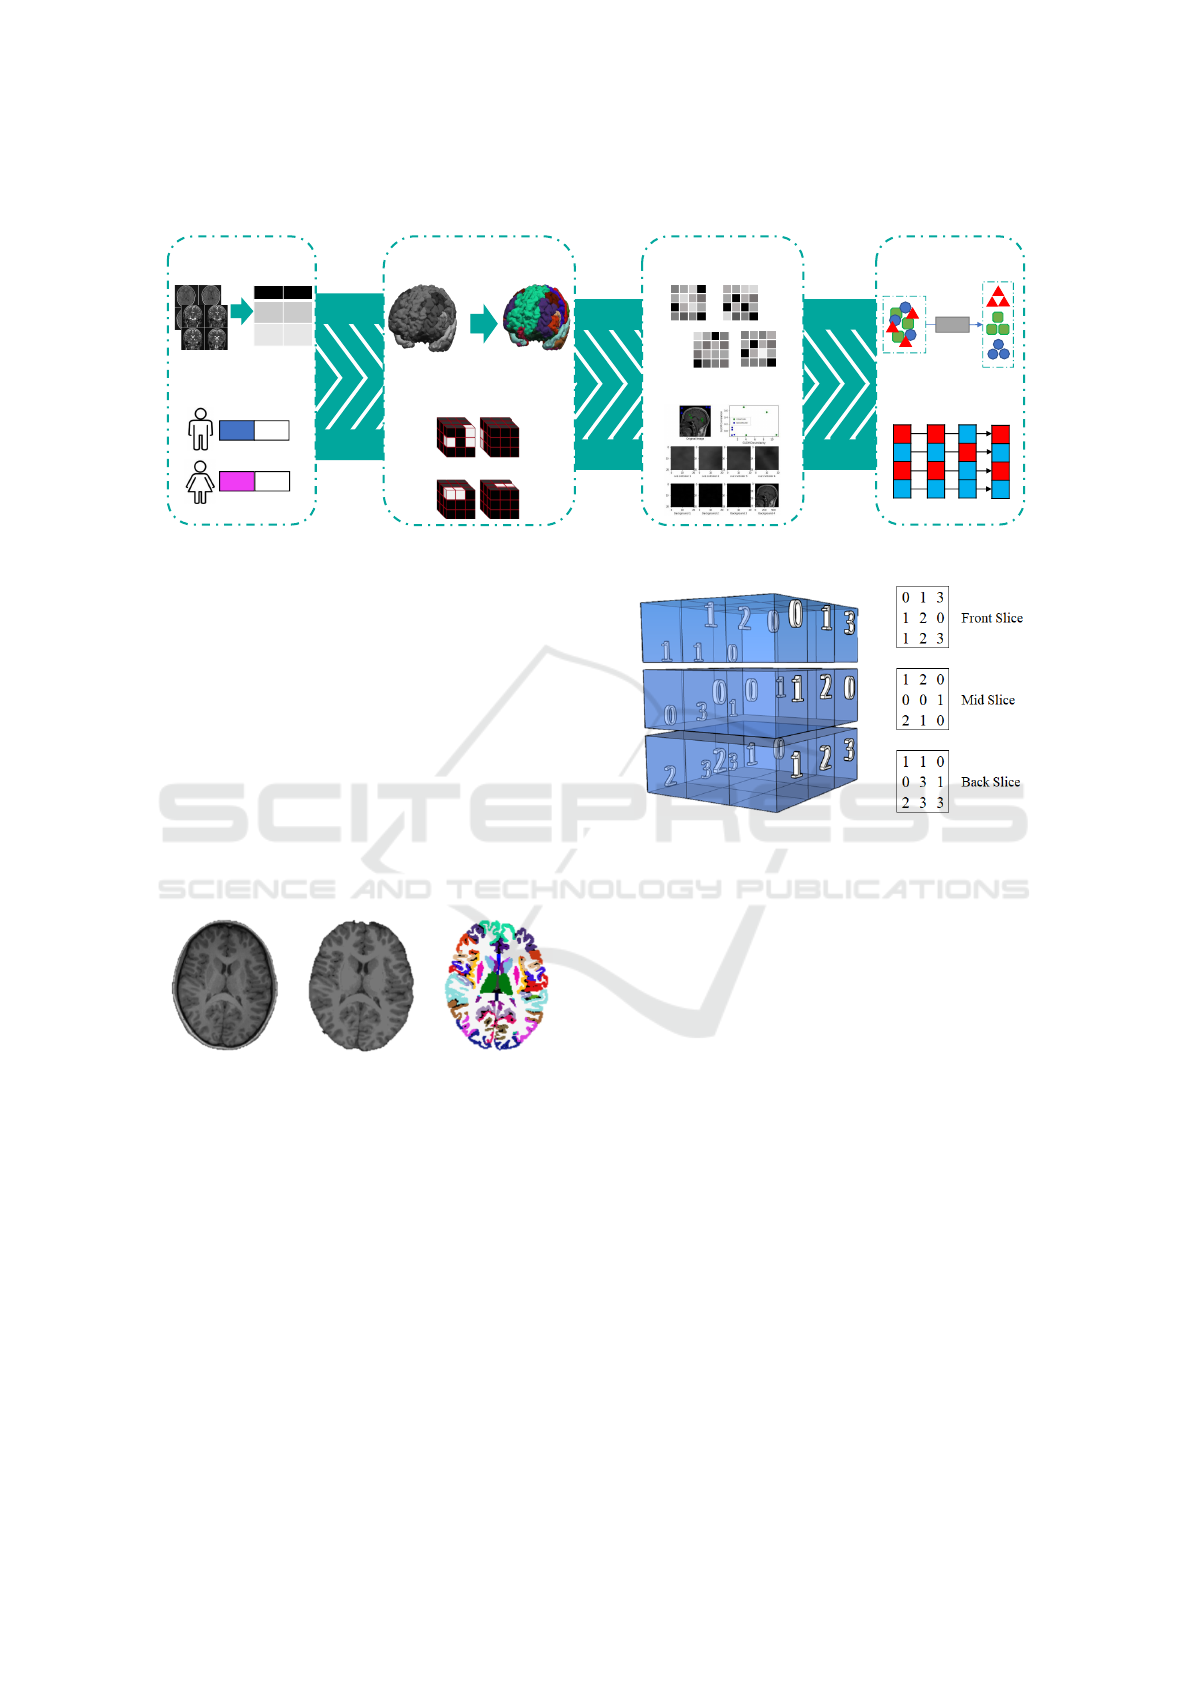
cal regions. Figure 3 illustrates the main steps of the
proposed method: (1) image acquisition; (2) volume
segmentation; (3) feature extraction; and (4) classifi-
cation and majority voting. These steps will be ex-
plained in the following subsections.
1. Image Acquisition. including the definition of the
acquisition protocol;
2. Volume Segmentation. using Freesurfer segmen-
tation, dividing into distinct region groups;
3. Feature Extraction. applying GLCM per region
volume and extracting texture information;
4. Classification and Majority Voting. detecting the
most affected regions by TS.
3.1 Image Acquisition
The image dataset was obtained by National Taiwan
University and comprises sixty-eight subjects, where
thirty-four subjects have TS, and thirty-four are nor-
mal control subjects. The age is between 6 to 14
years. Table 1 summarizes the demographic informa-
tion for the selected subjects.
The image dataset was acquired using a TrioTim
series of the SIEMENS scanner. The MRI acqui-
sition protocol defined 3T T1-weighted sMRI with
3mm voxel size and 192x256 matrix size. Repetition
time (T R) equals 2000.0 and echo time (T E) equals
26.0. Each subject’s brain volume is composed of 208
slices, enabling the construction of the entire volume
to the next step.
3.2 Volume Segmentation
FreeSurfer tool was employed to segment the brain
into deep-inner gray-matter regions (Fischl et al.,
2002). This process mainly consists of three ma-
jor steps: (1) image normalization (Figure 4 (a)) fol-
lowed by skull stripping (Figure 4 (b)); (2) smooth-
ing followed by an inflation of the surface; and (3)
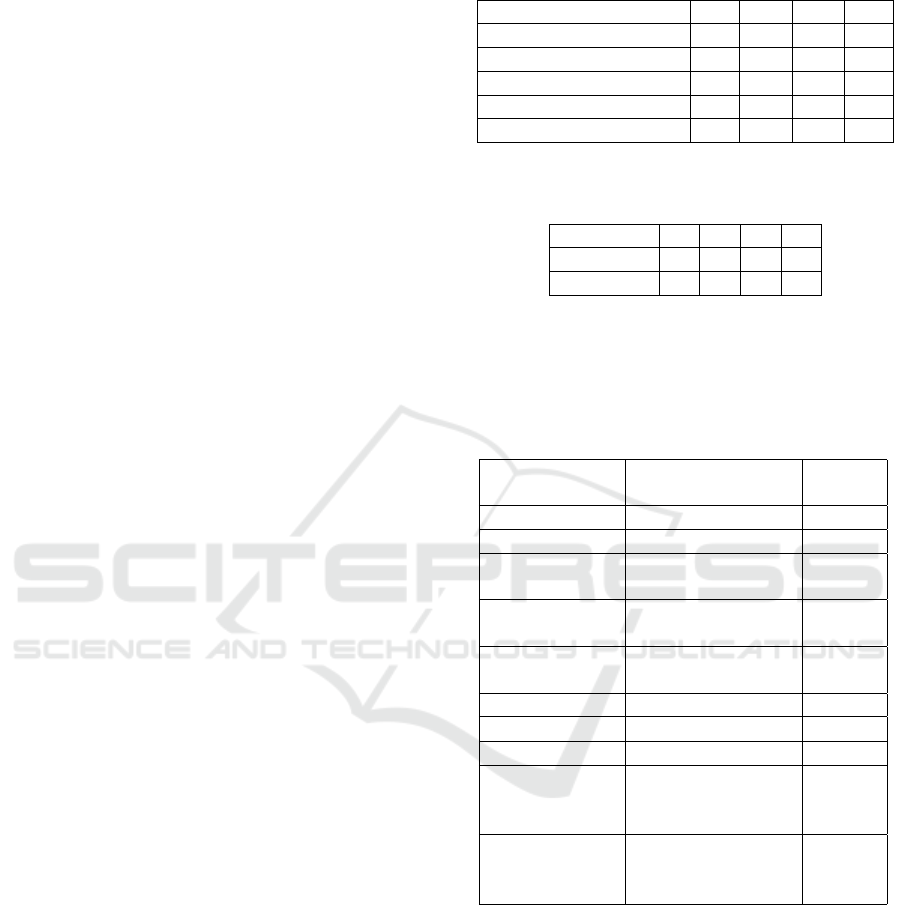
Table 1: Demographic information of the selected subjects.
Attributes
NC
(N=34)
TS
(N=34)
Age (years)
median (range)
6 to 14
8, 94
6 to 13
8, 58
Gender
% male
71% 68%
IMPROVE 2022 - 2nd International Conference on Image Processing and Vision Engineering
28
3.1. Image
Acquisition
1.2 Patient Volume Selection
3.2. Volume
Segmentation
Brain
Segmentation
Binary Matrix
Generation
region #1
region #2
region #3
region #N
Co-occurrence Matrix
Calculation
3.3. Feature
Extraction
3.4. Classification
And Majority Voting
Naïve Bayes
Classification
1.1 CSV filtering
Best Region
Majority Voting
region #1
Data
Acquisition
Demographic
Analysis
name
mri
001
001.d
cm
002
002.d
cm
%
%
Texture Descriptor
Extraction
region #2
Results
region #3
region #1 region #2
region #3
region #N
NB
Figure 3: Proposed workflow.
registration and cortical parcellation. Among the ex-
isting atlases in Freesurfer, we adopted the Desikan-
Killiany-Tourville (DKT) atlas (Figura 4.c). We re-
stricted the Freesurfer outcome to 30 internal gray-
matter regions.
After the segmentation process, each anatomical
region is represented by an unique region ID, thus al-
lowing further comparisons across distinct subjects.
Each region is separated into a three-dimensional bi-
nary volume, where the voxels are assigned to “True”
when they belong to the assigned region and “False”
otherwise. Thus, each subject has a set of thirty binary
volumes. Figure 4 illustrates the DKT atlas segmen-
tation applied to a particular brain volume.
(a) (b) (c)
Figure 4: Pre-processing using FreeSurfer: (a) Original im-
age normalized; (b) Skull stripping; (c) DKT-atlas.
3.3 Feature Extraction
This step is concerned to extract reliable texture fea-
tures using GLCM studied by (Haralick et al., 1973)
and also using radiomics according to (van Griethuy-
sen et al., 2017). The GLCM stores the pixel/voxel
affinity between a voxel value v
1
to v
2
(Figure 5). The
resultant matrix is N ×N, where N corresponds to the
maximum voxel value among the values in an image
(Figure 6).
The grayscale value represents the indexes in the
rows and columns, and the interaction f (v
1
, v
2
) is the
number of occurrences from v
1
towards v
2
.
Figure 5: 3D volume where each cube corresponds to a
gray-tone intensity voxel.
1 2 0 1
2 1 3 1
2 1 0 2
0 1 0 1
Figure 6: Matrix Co-occurrence.
The transitions are calculated majorly according
to two parameters: (1) θ angle (0º, 45º, 90º,145º); and
2) distance d = 1. Angle corresponds to the orienta-
tion from v
1
and v
2
stored in the GLCM. Distance is
defined as the interval in pixels or voxels between v
1
and v
2
.
Two adaptations were adopted to GLCM: (1) since
there are 3D structures (26-connectivity) instead of
2D (8-connectivity), we add more directions to calcu-
late the displacement vector (dx, dy, dz); (2) we refor-
mulated to rely on anatomical regions instead of the
brain, disregarding occurrences of voxels that do not
belong to a given region. In general, each anatomical
region has a distinct GLCM.
In the end, to compose the final vector con-
taining the information of each region per subject,
twenty-three metrics to GLCM-based texture descrip-
tors were extracted:
Detecting Tourette’s Syndrome in Anatomical Regions of the Brain through MRI Analysis and Naive Bayes Classifier
29

Autocorrelation; Joint Average; Cluster Promi-
nence; Cluster Shade; Cluster Tendency; Contrast;
Correlation; Difference Average; Difference Entropy;
Difference Variance; Joint Energy; Joint Entropy;
Informational Measure of Correlation 1 and 2; In-
verse Difference Moment; Maximal Correlation Co-
efficient; Inverse Difference Moment Normalized; In-
verse Difference; Inverse Difference Normalized; In-
verse Variance; Maximum Probability; Sum Average;
Sum Entropy; Sum of Squares (pyradiomics commu-
nity, 2016)
3.4 Classification and Majority Voting
Classification. Naive Bayes (NB) is a probabilis-
tic classifier based on the Bayes theorem (Zhang
and Gao, 2011), part of the supervised learning
branch of machine learning algorithms. This clas-
sifier independently analyzes attributes to identify
its affinity to a given class. Considering a data
vector x = (x
1
, x
2
, x
3
...x
n
) and a set of class w =
(w
1
, w
2
, w
3
...w
n
), thus the probability of each class
belong to a vector is represented by the expression
of p(w
i
|x). Equation 1 states the calculation of NB
(Pedrini and Schwartz, 2008).
P(w
i
|X) =
P(X|w
i
) · P(w
i
)
P(X)
. (1)
where P(w
i
|X) is the posterior probability; P(w
i
) rep-
resents a given original class probability, P(X|w
i
) cor-
responds to how likely a vector x is with the class w
i
.
Therefore, this classification has as its decision factor
two probabilities, being represented below Eq. 2.
P(w
i
|X) > P(w
j
|X). (2)
Where j = (1, 2, 3...n) with i 6= j
The version we applied uses the Gaussian param-
eter (Equation 3).
P(x
i
|y) =
1
q
2πσ
2
y
exp
−
(x
i
− µ
y
)
2
2σ
2
y
!
(3)
where µ is the average value of a given class, and
σ represents the covariance matrix of the class. We
decided to use this classifier, as it has a good multi-
class probabilistic performance, in addition to recom-
mended when the amount of data is not large.
Majority Voting. individual region outcomes are com-
bined into a single prediction using an election of
those values. The prediction is chosen according to
the most occurrent class identified in the predictions
for a given subject.
3.5 Computational Aspects
Our implementation was entirely developed in Python
3.8 using the Spyder IDE, in macOS High Sierra ver-
sion 10.13.6. Our method was implemented using the
following tools and techniques:
1. Data Acquisition. the data were stored into fold-
ers labeled id class, id is the subjects id and varies
between 1 and 34, and class is labeled M for TS
subjects and H otherwise;
2. Volume Segmentation. bash files were produced
to apply the Freesurfer tool using the command
recon − all automatically. Then, a code was used
to group the intersection between regions across
the subjects, remaining only the subjects’ regions;
3. Feature Extraction. a code was developed to ex-
tract the GLCM features using the library pyRa-
diomics, NumPy and Pandas;
4. Classification and Majority Voting. the classifi-
cation was performed using a code developed in
python using the Naive Bayes contained in the li-
brary scikit-learn. The majority voting was en-
tirely developed using NumPy and Pandas.
All source codes used in the implementation, in addi-
tion to the design of the experiment and the graphic
are available publicly in our Github directory
1
4 RESULTS AND DISCUSSION
In this section, two aspects were taken into account:
(1) effectiveness of our approach; (2) region analysis
compared with the state-of-the-art.
Four metrics were employed to evaluate our re-
sults: (1) recall - R; (2) precision - P; (3) f-measure -
F; (4) accuracy - Acc. They are calculated by combin-
ing the true-positive (TP), true-negative (TN), false-
positive (FP), false-negative (FN) values. The equa-
tions are defined as follows:
R =
T P
T P + FP
(4)
P =
T P
T P + FN
(5)
F =
2 ∗ R ∗ P
R + P
(6)
Acc =
T P + T N
T P + T N + FP + FN
(7)
1
https://github.com/muribarros/TS Feature Extractor.
git
IMPROVE 2022 - 2nd International Conference on Image Processing and Vision Engineering
30
The NB classifies the outcome for each one of the
thirty chosen brain anatomical regions, returning the
values of the metrics related how predictive the region
was to infer whether a subject has TS or not. Figure
7 shows the accuracy value of thirty anatomical re-
gions, where some nomenclature should be defined
as: Corpus Callosum (CC) and Cerebrospinal Fluid
(CSF). Among them, sixteen regions ranked greater
than 60% of accuracy.
The most predictive region, according to the re-
sults, was the right-side accumbens (Acc:68%); this
region is considered as the neural interface between
action and motivation located in the basal ganglia,
and it is the main component of the ventral striatum
and plays an essential role in the understanding of
neuroanatomical aspects of TS (Brito, 1997; Volman
et al., 2013).
There is a significant influence on the right hemi-
sphere of the brain, which is related to creative think-
ing when compared to the left hemisphere, related to
analytical thinking. Studies in the literature address
the importance of the amygdala, ranked in 9th posi-
tion in TS due to belonging to the limbic system and
how it is a reliable region to identify a subject who
has TS (Neuner et al., 2010).
According to Caminiti (Caminiti et al., 2009), the
Corpus Callosum (CC) is the primary means of com-
munication between the brain’s hemispheres, con-
necting cortical regions. The region has the follow-
ing connections, depending on the analyzed area: (1)
CC anterior, connecting with Parietal areas; (2) CC
central, connecting with the motor, sensory and vi-
sual areas; (3) CC posterior, connecting with the pre-
frontal cortex. CC Central, CC mid-posterior, and
CC posterior have achieved the second, third, and
fourth positions in the top 5 most predictive brain re-
gions for TS. This outcome goes hand in hand with
the importancestate-of-the-art, which declares the im-
portance of CC related to motor tics (Muellner et al.,
2015; Steeves et al., 2010; Greene et al., 2016a).
Although analyzing single region is crucial to in-
fer its variation in subject with TS, it is vital to assume
a better prediction by combining the most predictive
regions outcome. Table 2 and 3 defines the effective-
ness of the top 5 most predictive regions. In addi-
tion, it is also shown that combining the anatomical
regions’ outcomes is more predictive to identify TS
than the outcomes analyzed separately.
In the state of the art, no works were found that
use the Naive Bayes classification. However, there
are studies such as the one by (Greene et al., 2016b)
that uses the Support Vector Machine (SVM) classifi-
cation in MR images. In addition to being compet-
itive, both works are complementary, demonstrating
Table 2: Effectiveness of the top five brain regions to detect
TS.
Anatomical Region Acc P R F
I) Right Accumbens area 68% 61% 97% 75%
II) CC Central 66% 64% 70% 67%
III) CC Mid Posterior 66% 66% 68% 67%
IV) CC Posterior 66% 74% 50% 60%
V) Right choroid plexus 64% 62% 73% 67%
Table 3: Ensembles of the top regions, were top 3 first re-
gion and top 5 first region.
Ensembles Acc P R F
Top 3 regions73% 67% 91%77%
Top 5 regions78%72%91%80%
views of different modalities and classification char-
acteristics.
The table 4 below illustrates the summary of the
comparison of both works.
Table 4: Paper comparison.
(Greene et al., 2016b)
Proposed
method
Modality RMf RMs
Nº Image 84 68
Nº Anatomical
Region
264 86
Atlas anatomical
regions
Average fMR
scans
Freesurfer
Feature
Extraction
n/a GLCM
Classification SVM NB
Acc fMR
70% n/a
Acc sMR
n/a 68%
Acc Ensemble
Top 3 regions
sMR
n/a 73%
Acc Ensemble
Top 5 regions
sMR
n/a 78%
5 SUMMARY AND CONCLUSION
In this work, we have presented an approach to iden-
tify TS based on the combination of brain segmen-
tation, feature extraction, classification, and ensem-
ble. Our proposed workflow has four major steps: (1)
we develop an approach image acquisition, which is
consisted in acquiring the sMRI and study the demo-
graphic information of the subjects; (2) we develop an
approach volume segmentation, which is composed
of the segmenting the brain in anatomical regions; (3)
Detecting Tourette’s Syndrome in Anatomical Regions of the Brain through MRI Analysis and Naive Bayes Classifier
31
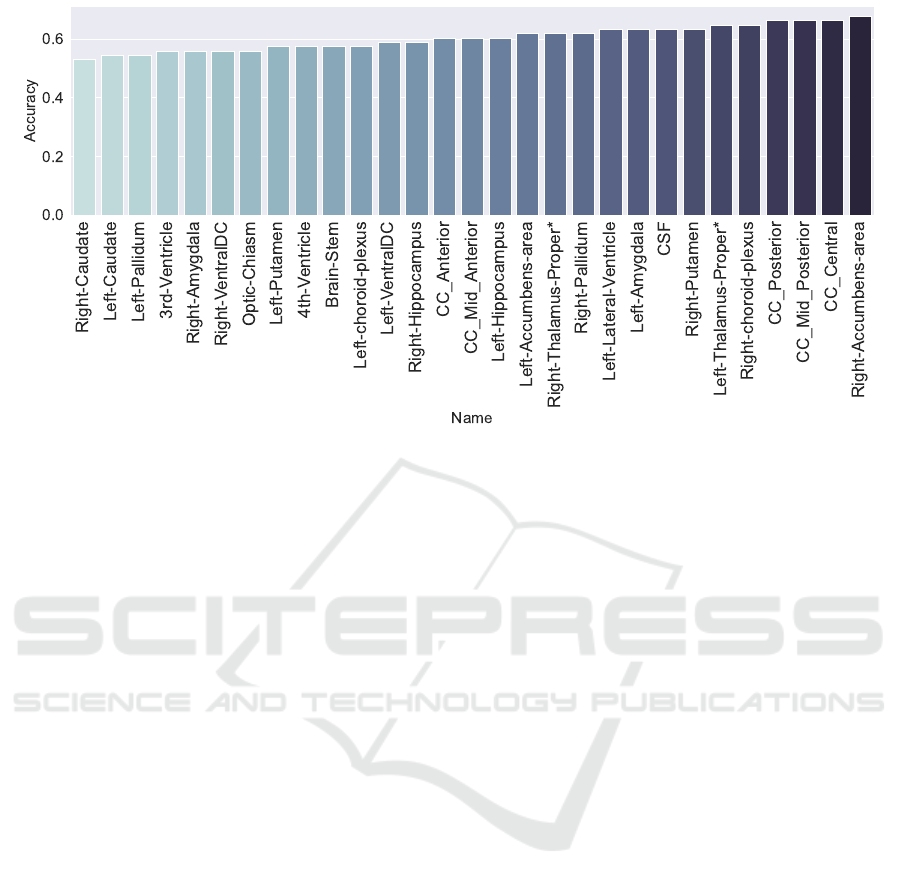
Figure 7: Best accuracies among the regions to detect TS ranked from the lowest (left) to highest (right).
we develop an approach feature extraction, responsi-
ble for identifying texture patterns in the regions via
GLCM; (4) we develop an approach classification and
majority voting, which classify the patients according
to their regional texture patterns, combine the most
significant regions into a single detection.
Tourette’s syndrome is a disorder that affects mo-
tor and vocal capabilities, commonly developed in
childhood. Although there is no cure, treatments
are often prescribed through behavioral analysis us-
ing clinical assessment. However, this analysis may
not consider imaging, which gathers reliable informa-
tion about the subject’s brain. Moreover, there are few
works that use computational approaches thus turning
into a gap to be addressed.
Our contributions in this work were: (1) proposing
an approach focused on computational analysis using
imaging; (2) extracting feature focusing on anatom-
ical regions; (3) presenting a rank of the most pre-
dictive regions using Naive Bayes; (4) analyzing an
ensemble to detect TS using a group of regions. Fea-
ture extraction and classification are being extensively
studied in Parkinson’s and Alzheimer’s disease; how-
ever, those topics are not widespread in TS.
The limbic system has shown an essential part for
analyzing TS since the top regions selected using our
approach that reached higher accuracy belong to this
system. The importance of the limbic system is also
addressed in the literature but not via a computational
approach. Nevertheless, the ensemble (i.e., combi-
nation) of the most predictive regions’ outcome has
increased the detection, thus highlighting the need for
detecting TS based on multiple regions outcomes. For
future work, we suggest the adoption of possible fea-
tures, described as follows:
1. The use of new modalities, such as functional
MRI and Positron Emission Tomography scans;
2. The use of additional anatomical regions, consid-
ering the white matter and cortical areas;
3. The use of 3D shape and texture descriptors,
which may lead to a new interpretation of the re-
gions;
4. Classification using other techniques, such as
SVM, Neural Networks, and Random Forest;
ACKNOWLEDGEMENTS
The authors thank the group Department of Pedi-
atric Neurology from National Taiwan University, lo-
cated in Taipei-Taiwan, for providing T1-weighted
MR scans used in this work. This study was financed
in part by the Coordenac¸
˜
ao de Aperfeic¸oamento de
Pessoal de N
´
ıvel Superior – Brasil (CAPES) – Fi-
nance Code 001.
REFERENCES
Brito, G. (1997). A neurobiological model for tourette syn-
drome centered on the nucleus accumbens. Medical
Hypotheses, 49(2):133–142.
Caminiti, R., Ghaziri, H., Galuske, R., Hof, P. R., and Inno-
centi, G. M. (2009). Evolution amplified processing
with temporally dispersed slow neuronal connectivity
IMPROVE 2022 - 2nd International Conference on Image Processing and Vision Engineering
32

in primates. Proceedings of the National Academy of
Sciences, 106(46):19551–19556.
Fischl, B., Salat, D. H., Busa, E., Albert, M., Dieterich,
M., Haselgrove, C., van der Kouwe, A., Killiany, R.,
Kennedy, D., Klaveness, S., Montillo, A., Makris, N.,
Rosen, B., and Dale, A. M. (2002). Whole brain
segmentation: Automated labeling of neuroanatomi-
cal structures in the human brain. Neuron, 33(3):341–
355.
Greene, D., Iii, A., Koller, J., Schlaggar, B., and Black,
K. (2016a). Brain structure in pediatric tourette syn-
drome. Molecular psychiatry, 22:9.
Greene, D. J., Church, J. A., Dosenbach, N. U., Nielsen,
A. N., Adeyemo, B., Nardos, B., Petersen, S. E.,
Black, K. J., and Schlaggar, B. L. (2016b). Multi-
variate pattern classification of pediatric tourette syn-
drome using functional connectivity mri. Develop-
mental Science, 19(4):581–598.
Haralick, R. M., Shanmugam, K., et al. (1973). Textural
features for image classification. IEEE Transactions
on systems, man, and cybernetics, (6):610–621.
Hounie, A. G. (2006). Tiques, Cacoetes, S
´
ındrome de
Tourette, volume 1 of 1. Artmed, The address, 1 edi-
tion.
Jafarpour, S., Sedghi, Z., and Amirani, M. C. (2012). A ro-
bust brain mri classification with glcm features. Inter-
national Journal of Computer Applications, 37:1–5.
Kobierska, M., Sitek, M., Gocyła, K., and Janik, P. (2014).
Coprolalia and copropraxia in patients with gilles de la
tourette syndrome. Neurologia i Neurochirurgia Pol-
ska, 48(1):1–7.
Long, X., Chen, L., Jiang, C., and Zhang, L. (2017). Pre-
diction and classification of alzheimer disease based
on quantification of mri deformation. PLoS One,
3(12):1–19.
Muellner, J., Delmaire, C., Valabr
´
egue, R., Sch
¨
upbach, M.,
Mangin, J.-F., Vidailhet, M., Leh
´
ericy, S., Hartmann,
A., and Worbe, Y. (2015). Altered structure of cor-
tical sulci in gilles de la tourette syndrome: Further
support for abnormal brain development. Movement
Disorders, 30(5):655–661.
Muller, K. R. (2009). Prefrontal and anterior cingu-
late cortex abnormalities in tourette syndrome: evi-
dence from voxel-based morphometry and magneti-
zation transfer imaging. bmc neuroscience. Springer
Science and Business Media LLC, pages 1–13.
http://dx.doi.org/10.1186/1471-2202-10-47.
Neuner, I., Kellermann, T., St
¨
ocker, T., Kircher, T., Habel,
U., Shah, J. N., and Schneider, F. (2010). Amyg-
dala hypersensitivity in response to emotional faces
in tourette’s patients. The World Journal of Biological
Psychiatry, 11(7):858–872.
Pedrini, H. and Schwartz, W. (2008). An
´
alise de imagens
digitais: princ
´
ıpios, algoritmos e aplicac¸
˜
oes. THOM-
SON PIONEIRA.
Peterson, B. S., Choi, H. A., Hao, X., Amat, J. A., Zhu,
H., Whiteman, R., Liu, J., Xu, D., and Bansal, R.
(2007). Morphologic features of the amygdala and
hippocampus in children and adults with tourette syn-
drome. Archives of General Psychiatry, 64(11):1281.
pyradiomics community (2016). Radiomic features.
Solana-Lavalle, G. and Rosas-Romero, R. (2021). Classifi-
cation of ppmi mri scans with voxel-based morphom-
etry and machine learning to assist in the diagnosis
of parkinson’s disease. Computer Methods and Pro-
grams in Biomedicine, 198:105793.
Steeves, T. D. L., Ko, J. H., Kideckel, D. M., Rusjan, P.,
Houle, S., Sandor, P., Lang, A. E., and Strafella, A. P.
(2010). Extrastriatal dopaminergic dysfunction in
tourette syndrome. Annals of Neurology, 67(2):170–
181.
Teixeira, L. L. C., Junior, J. M. S. P., Neto, F. X. P., Targino,
M. N., Palheta, A. C. P., and da Silva, F. A. (2011).
S
´
ındrome de la tourette: revis
˜
ao de literatura. Ar-
quivos Internacionais de Otorrinolaringologia (Im-
presso).
Tinaz, S., Malone, P., Hallett, M., and Horovitz, S. G.
(2015). Role of the right dorsal anterior insula
in the urge to tic in tourette syndrome. ovement
Disorders, [s.l.], v. 30, n. 9, pages 1190–1197.
http://dx.doi.org/10.1002/mds.26230.
van Griethuysen, J. J., Fedorov, A., Parmar, C., Hosny, A.,
Aucoin, N., Narayan, V., Beets-Tan, R. G., Fillion-
Robin, J.-C., Pieper, S., Aerts, H. J., and et al. (2017).
Computational radiomics system to decode the radio-
graphic phenotype. Cancer Research, 77(21).
Volman, S. F., Lammel, S., Margolis, E. B., Kim, Y.,
Richard, J. M., Roitman, M. F., and Lobo, M. K.
(2013). New insights into the specificity and plastic-
ity of reward and aversion encoding in the mesolimbic
system. 33(45):17569–17576.
Zhang, W. and Gao, F. (2011). An improvement to naive
bayes for text classification. Procedia Engineering,
15:2160–2164. CEIS 2011.
Detecting Tourette’s Syndrome in Anatomical Regions of the Brain through MRI Analysis and Naive Bayes Classifier
33
