
Indirect Network Impact on the Energy Consumption in Multi-clouds for
Follow-the-renewables Approaches
Miguel Felipe Silva Vasconcelos
1,2 a
, Daniel Cordeiro
2 b
and Fanny Dufoss
´
e
1 c
1
Univ. Grenoble Alpes, Inria, CNRS, Grenoble INP, LIG, 38000 Grenoble, France
2
School of Arts Science and Humanities, Univ. of S
˜
ao Paulo, S
˜
ao Paulo, Brazil
Keywords:
Cloud Computing, Scheduling, Follow-the-renewables.
Abstract:
Cloud computing has become an essential component of our digital society. Efforts for reducing its environ-
mental impact are being made by academics and industry alike, with commitments from major cloud providers
to be fully operated by renewable energy in the future. One strategy to reduce nonrenewable energy usage is
the “follow-the-renewables”, in which the workload is migrated to be executed in the data centers with the
most availability of renewable energy. In this paper, we study the indirect impacts on the energy consumption
caused by the additional load in the network generated from the live migrations of the “follow-the-renewables”
approaches. We then provide an algorithm that thoroughly considers the network to schedule the live migra-
tions and, combined with an accurate estimation model for the duration of the migrations, is able to perform
the live migrations without network congestion with the same or even reducing the brown energy consumption
in comparison to other state-of-the-art algorithms.
1 INTRODUCTION
Cloud infrastructures became a critical component
of society in the last decade, from private life to
big company development. The energy efficiency
of these platforms has been widely studied and im-
proved by academics and Cloud providers (Muralid-
har et al., 2020). This progress, however, did not lead
to a reduction of global Cloud energy consumption.
In (Masanet et al., 2020), authors estimate the growth
of Data Centers (DCs) needs between 2010 and 2018
to a 10-fold increase in IP traffic, a 25-fold increase in
storage capacity, and a 6-fold increase of DCs work-
load. The impact of this explosion of usages has thus
been limited by efficiency improvement of platforms
to an energy increase of only 6%. Projections over
the following years are, however, quite pessimistic.
In (Koot and Wijnhoven, 2021), authors consider dif-
ferent scenarios for the period 2016–2030, with pre-
dictions ranging between a wavering balance and a
significant increase in electricity needs.
These predictions consider big trends in IT, but
they do not embrace unpredictable events, such as
a
https://orcid.org/0000-0001-5085-1995
b
https://orcid.org/0000-0003-4971-7355
c
https://orcid.org/0000-0002-2260-2200
the COVID pandemic, and particularly the lockdown
periods, that overturned the global Information Tech-
nologies (IT) usages (Feldmann et al., 2021).
Another approach to reducing the environmental
impact of cloud computing energy needs consists of
studying DCs’ energy sources. Most Cloud providers
have made commitments to renewable energy usage
in recent years. According to a Greenpeace report,
(Greenpeace, 2017), many DCs were already fully
supplied by renewable energy in 2017. However, they
are not the majority of cases. A typical example is
the IT infrastructures of Virginia, which are named
the “Ground zero for the Dirty Internet”, with 2% of
renewable energy power plants against 37% of coal.
They are known to host 70% of US internet traffic.
Green computing is still chimerical.
A critical question on renewable energy produc-
tion facilities is their intermittency. Hydroelectric
dams and, to a certain extent, offshore windmills can
provide constant energy. However, they are not appro-
priate for on-site electricity production for a DC. On-
shore windmills and solar farms are more likely to be
deployed with minimal constraints. The on-site elec-
tricity production is thus determined by local weather.
In contrast to wind speed, which can be difficult to
predict, solar irradiance follows daily and yearly pat-
terns. Photovoltaic (PV) panels are thus more appro-
44
Vasconcelos, M., Cordeiro, D. and Dufossé, F.
Indirect Network Impact on the Energy Consumption in Multi-clouds for Follow-the-renewables Approaches.
DOI: 10.5220/0011047000003203
In Proceedings of the 11th International Conference on Smart Cities and Green ICT Systems (SMARTGREENS 2022), pages 44-55
ISBN: 978-989-758-572-2; ISSN: 2184-4968
Copyright
c
2022 by SCITEPRESS – Science and Technology Publications, Lda. All rights reserved

priate for predictable on-site renewable energy pro-
duction facilities.
The work by (Camus et al., 2017; Camus et al.,
2018) studied the allocation of virtual machines
(VMs) to physical resources on geographically dis-
tributed DCs (also described as multi-clouds in the lit-
erature) powered by solar panels and the regular elec-
trical grid and is the basis of this work. It proposed
different stochastic models to estimate renewable en-
ergy production and greedy heuristic algorithms to al-
locate VMs to physical resources meeting the work-
load demands. VMs are allowed to be migrated dur-
ing the execution either to a computer within the same
DC or to a computer in another geographic loca-
tion. The algorithms proposed to allow server consol-
idation intra-DCs and a “follow-the-renewables” ap-
proach inter-DCs. The scheduling algorithm consid-
ers the network cost of the migration.
This paper presents an extension of this work to
analyze the indirect impact of network usage on the
energy consumption in multi-clouds for “follow-the-
renewables approaches”. The direct impact is caused
by the use of the network devices themselves. How-
ever, as shown in (Hlavacs et al., 2009) the energy
consumption of a network device does not change sig-
nificantly based on its usage, and it can be considered
static. The indirect impact is generated by migrating
the VMs. Furthermore, the duration of a migration
can be impacted by network congestion, resulting in
unnecessary computation on both the origin and the
target server. For the first, it can be turned off or allo-
cated to another computation only after the migration
finishes. For the latter, it will only start executing the
new VM after the end of the migration process.
The paper is organized as follows. Section 2 is
devoted to the related work. In Section 3 the model
of (Camus et al., 2018) is summarized. Section 4 de-
tails the new scheduling method for the migrations,
while Section 5 is devoted to simulations parameters.
Results are detailed in Section 6. Finally, Section 7
concludes the paper.
2 RELATED WORK
Reducing the total energy consumption and carbon
footprint of DCs is a major goal for Cloud Computing
platforms. Virtualization allows DCs to employ intel-
ligent resource allocation and scheduling algorithms
to optimize how the underlying computing resources
are used and to reduce the number of utilized physical
resources. In particular, DCs can apply VM consoli-
dation techniques in order to relocate the VMs into the
smallest number of physical machines and turn off the
idle machines. (Dias et al., 2021) present a systematic
literature review on such techniques.
Large hosting and Cloud Computing providers
have DCs distributed on different geographic
locations—some of them on different time zones—in
order to provide services with low latency and
high availability. Scheduling algorithms can take
advantage of this to mitigate the intermittent avail-
ability of renewable energy by redistributing the
workload based on renewable energy availabil-
ity. This idea is known in the literature as the
“follow-the-renewables” (Shuja et al., 2016).
(Xu and Buyya, 2020) present a comprehensive
overview of the classical techniques used for reduc-
ing the energy consumption on DCs. They also intro-
duce a workflow shifting algorithm that redistributes
the workload among different DCs located in differ-
ent time zones. The objective of their algorithm is
to minimize the total carbon emission while ensuring
the average response time of the requests. In their
work, jobs are initiated in the selected DCs instead of
migrated after starting its execution, and there is no
server consolidation.
Minimization of energy consumption, costs, and
environmental impact while ensuring the workload
performance were studied by (Ali et al., 2021). They
proposed a solution that manages geographic dis-
tributed DCs with heterogeneous servers in a dis-
tributed fashion. The solution has two main algo-
rithms that use greedy heuristics: the first performs
the allocation of the incoming workload to the servers
of the DCs according to a defined policy (lower en-
ergy prices or more available green power); and the
second either migrate the workload only among the
servers inside a DC (intra-DC migration) to reduce the
number of utilized servers, or migrate the workload
among different DCs (inter-DC migration) according
to an arbitrary policy (use the DCs with lower electric-
ity price, or more green power available). The migra-
tions in the second algorithm can result in a decrease
in performance, given that a task could be migrated
to a server that is not as powerful as the one where it
was running before being migrated, and the proposed
solution considers this metric.
“Follow-the-renewables” is an interesting solution
for mitigating the intermittency of renewable energy
availability, but it also has limitations. First, the pro-
cess of migrating a VM between different DCs con-
sumes energy itself. The scheduling algorithm must
consider this energy consumption before deciding if
the migration is advantageous. Second, the network
communications links between the DCs can suffer
from contention, which may increase the execution
time of the jobs, migration duration, and costs. An ef-
Indirect Network Impact on the Energy Consumption in Multi-clouds for Follow-the-renewables Approaches
45

ficient scheduling algorithm must consider those fac-
tors to decrease the carbon footprint of the DCs oper-
ations.
The following sections will present the study of
these limitations and details of how the proposed
scheduling algorithm handles them.
3 THE NEMESIS MODELING
NEMESIS (Camus et al., 2018) is a resource manage-
ment framework with a central controller that man-
ages a Cloud composed of DCs geographically dis-
tributed across a country. The Cloud workload con-
sists of heterogeneous VMs in terms of the number
of cores, RAM size, and requested execution time.
The Cloud infrastructure is supplied from the regular
electrical grid and locally installed PV panels. Given
the intermittency of renewable energy, the NEMESIS
algorithm uses the stochastic modeling of SAGITTA
(Camus et al., 2017) for obtaining the expected value
of the renewable energy available at a given time to
be used as input for the scheduling algorithms.
The workload execution is scheduled at time slots
of 5 minutes, and it uses greedy heuristics inspired
by the Best-Fit algorithm. While not resulting in the
optimal solution, greedy heuristics can provide an ac-
ceptable result in a reasonable amount of time. The
scheduling algorithm has four main steps detailed as
follows.
In the first step of the algorithm (pre-allocation
of the incoming VMs), for each VM received during
the time slot, the controller will try to allocate it to
a server. There are two restrictions for this schedul-
ing algorithm: i) the server has available computa-
tional resources to host the VM; and ii) executing the
VM in this server would result in the minimum in-
crease in the expected brown energy consumption. If
a server is found, the algorithm makes a reservation
(pre-allocation) for the VM being processed and goes
to the next VM. If no server is found, the VM will be
delayed to be processed in the next time slot.
The greedy heuristics used in the last step of
the algorithm may not provide the optimal solution.
Hence, the second step of the algorithm (revision of
the pre-allocations) performs a revision of the reserva-
tions. The strategy is to move the reservation from the
DCs expected to consume more brown energy to the
DCs expected to have the most availability of green
energy. There are two constraints for this algorithm:
it exists a host in the DC being evaluated that can host
the VM and the expected brown energy is reduced.
The availability of green energy may change dur-
ing the execution of the VMs, and the third step of
the algorithm (migration of the running VMs) eval-
uates if migrating the workload in execution reduces
the brown energy consumption. It uses the same strat-
egy as the previous step of the algorithm, moves the
workload from DCs using more brown power to DCs
that have more green power available, and with the
following restrictions: i) the migration needs to finish
during the considered time slot; ii) the VM will keep
running at least until the end of its migration; iii) one
DC can only migrate to another 2 DCs during a time
slot; and iv) the migrations from one DC are planned
to execute one after another, that is, they cannot hap-
pen simultaneously in parallel. Restrictions (iii) and
(iv) are simple heuristics to avoid network congestion
with the load generated by the VM live migrations.
The energy cost of the servers represents about
50% of the total energy consumption of a DC
(Frazelle, 2020), and the final step of the algorithm
(server consolidation) tries to minimize the number of
servers that are turned on. For each DC, the algorithm
evaluates whether it can redistribute the running VMs
(by performing live migrations among the servers of
the DC — intra-DC migrations) in a way that reduces
the number of servers being used.
3.1 Cloud Modeling
The Cloud modeling of NEMESIS is based on a real
Cloud infrastructure: the Grid’5000 testbed
1
. It mod-
els 1035 servers distributed among 9 DCs in France
and Luxembourg: 116 servers in Grenoble; 74 servers
in Lille; 38 servers in Luxembourg; 103 servers in
Lyon; 240 servers in Nancy; 44 servers in Reims; 129
servers in Rennes; 151 servers in Sophia Antipolis;
and 140 servers in Toulouse. These servers are con-
sidered homogeneous in terms of memory, CPU, and
energy consumption, and are based in the Taurus node
of the Grid’5000, equipped with two Intel Xeon E5-
2630 CPUs (6 cores per processor), and 32 GB RAM.
The servers inside the DCs are interconnected by
network links with 1 Gbps of bandwidth, and the net-
work links that interconnect the different DCs have
10 Gbps. Figure 1 presents the network topology of
the cloud platform, and the placement of the DCs was
not based on their geographic location, but to better
visualize the network links. It is important to notice
that some network links are shared by multiple DCs,
thus the migration planning needs to consider this in-
formation to avoid generating network congestion and
the resulting waste of resources.
Regarding the energy consumption of the servers,
a linear model based on CPU usage is considered. The
server presents a fixed consumption for its IDLE state
1
https://www.grid5000.fr
SMARTGREENS 2022 - 11th International Conference on Smart Cities and Green ICT Systems
46

Figure 1: Topology of the Cloud platform, where “GRE”
is Grenoble, “LIL” is Lille, “LUX” is Luxembourg,“LY” is
Lyon, “NCY” is Nancy, “RMS” is Reims, “RNS” is Rennes,
“SPH” is Sophia, and “TLS” is Toulouse.
(97 W), and the power consumption based on core
usage is as follows: 128 W for 1 core; 146.4 W for
2 cores; 164.8 W for 3 cores; 183.2 W for 4 cores;
201.6 W for 5 cores; and 220 W with 6 cores. Further-
more, the energy consumption of turning on a server
(127 W during 150 s), turning off a server (200 W
for 10 s), and when the server is off (8 W) are mod-
eled as well. Finally, only the power consumption
of the servers is considered to model the power con-
sumption of the DCs (Power Usage Effectiveness, or
P.U.E., equals to 1), as we are focusing on the energy
consumption of the computing part — the major con-
sumer. Choosing a P.U.E. different than 1 would not
affect the scheduling decisions made by the migration
planning algorithm (supposing that we consider a ho-
mogeneous P.U.E for all the DCs), since only the total
power consumption would be increased by a constant
factor, and the ordering of the DCs in terms of green
energy availability would be the same.
3.2 VM Live Migration Model
The VM live migration model of NEMESIS has 3
phases: i) transferring all the memory pages of the
VM; ii) sending a message to notify the end of the
stop-and-copy step (end of finishing copying all the
memory pages); iii) sending the commitment message
(after which the VM will be destroyed in the server of
origin and resumed in the destination host). The du-
ration of the migration is essential for the scheduling,
and Algorithm 1 executes this estimation, where: lin-
kLatency is the latency of the link; routeSize is the
number of links that interconnects the host where the
VM is originally running to the target host of the mi-
gration; windowSize = 4,194,304 Bytes, is the TCP
maximum window size; bandWidthRatio = 0.97, rep-
resents the additional load caused by the headers of
TCP/IP; bandwidth = the minimum bandwidth among
the links that interconnect the host of origin with the
target host; α = 13.01, simulates the TCP slow start
factor, that is, not all the bandwidth is instantly avail-
able for the communication; and γ is used to represent
the Bottleneck effect of the TCP protocol.
The parameters used in Algorithm 1 were based
on (Velho et al., 2013). The difference between Al-
gorithm 1 and NEMESIS is the routeSize variable:
NEMESIS used fixed values (5 for live migrations
intra-DC, and 11 for live migrations inter-DC), and
now is supposed that the DC operator has informa-
tion about the network topology of his DC, thus the
real number of links that interconnect the two hosts is
used.
Algorithm 1: Estimation of the migration duration.
theLatency ← linkLatency · routeSize
trans f erLat ← theLatency +
γ
bandwidth
throughputL ←
windowSize
2·trans f erLatency
throughputB ← bandwidth
throughput ← min(throughputL, throughputB)
throughput ← throughput · bandWidthRatio
timeToMigrate ← 3 · α · trans f erLat +
vmRamSize
throughput
4 PLANNING THE MIGRATIONS
Algorithms 2 and 3 plan the migrations considering
the bandwidth usage. They are inspired in the mi-
gration planning of NEMESIS, with the following
modifications: i) the bandwidth of the links, and the
history of its usage is considered; ii) migrations are
performed in parallel between DCs; iii) the intra-
DC migrations do not execute simultaneously and are
distributed in time; iv) the estimation algorithm for
the duration of migrations consider the real number
of links that interconnects the origin and the target
server. This new algorithm is called c-NEMESIS,
where the “c” stands for congestion and its full name
is “Congestion and Network-aware Energy-efficient
Management framework for distributEd cloudS In-
frastructures with on-Site photovoltaic production”.
First, the DCs are sorted by increasing order of
expected remaining green energy (ERGE). The main
idea of the algorithms is to migrate VMs from the
DCs that have the least amount of green energy to
the DCs that have the highest availability, that is, mi-
Indirect Network Impact on the Energy Consumption in Multi-clouds for Follow-the-renewables Approaches
47

grating from the DCs at the beginning of the list to
the ones at the end of the list. For each DC, the run-
ning VMs information is collected (grouped by the
servers). The planning starts at the beginning of the
time slot. For each VM that can be migrated from the
DC that is sending, the algorithm tries to find a server
in the destination DC with the following restrictions:
i) it has resources available to host the VM (CPU and
memory); ii) the links that interconnect the server of
origin (where the VM is running) and the target server
can receive the additional load of the migration with-
out violating their bandwidth constraint; iii) the VM
migration finishes during the current time slot; and iv)
performing the migration reduces the expected brown
energy consumption. If all these restrictions are re-
spected, the VM is planned to migrate, and the al-
gorithm registers in the linkHistory that the links that
connect these two servers will be used until the instant
when the VM migration is expected to finish.
Algorithm 2: General planning of the migrations.
DCs ▷ Sorted by increasing ERGE
plannedTime ← 0
timeSlotDuration ← 300
linksHistory ←
/
0
while plannedTime < timeSlotDuration do
dc tx ← first item of DCs
while dc tx ̸= last item of DCs do
dc rx ← last item of DCs
if dc tx has VMs that can be migrated then
while dc tx ̸= dc rx do
evaluate if it is worth to migrate
VMs from dc tx to dc rx using Alg. 3
dc rx ← previous DC of DCs
end while
end if
dc tx ← next DC of DCs
end while
if no VM migration was planed and no migra-
tion is in execution then
exit
end if
plannedTime ← instant after the expected end
of next migration
end while
The DC with the most available green energy (ini-
tially at the beginning of the list) is denoted by M, and
N is the DC with the least green energy (initially at the
end of the list). The algorithm first tries to migrate all
the VMs from the DC M to the DC N, and if there
is still VMs that could be migrated, it tries to migrate
to the DC N-1, and so on until all the VMs from DC
M are planned to migrate, or all the DCs were pro-
Algorithm 3: Detailed migration planning between two
DCs.
Require: dc tx, dc rx
V Ms ← list of VMs of dc tx
for vm in V Ms do
origin ← server where the vm is running
target ← server from dc rx being evaluated
worth ← brownMig < brownNotMig
e time ← estimate the migration time using
Alg. 1
band ok ← links between source and target
can receive the additional load of the migration
if worth and band ok then
registers the planning of the migration and
updates the link history
end if
end for
cessed. After finishing processing for the DC M, the
algorithm repeats the same process for the DC M+1
until all the DCs are processed. After evaluating all
the possible DCs that could send the VM at that in-
stant of the time, the algorithm will use the link usage
history to see at what time is expected the next migra-
tion to finish (they are sorted chronologically in time),
and execute the planning again if there are still VMs
to be migrated. Then, the process repeats until there
are no more VMs to migrate or the evaluation time
reaches the end of the time slot.
After planning the migrations, server consolida-
tion will only be applied to the DCs that didn’t have
inter-DC migrations planned, to avoid generating net-
work congestion — given that the intra-DC migra-
tions could use the same network links as the inter-DC
migrations planned in the previous step.
The algorithms “pre-allocation of the incoming
VMs”, “revision of the pre-allocations” are the same
as NEMESIS. For the server consolidation algorithm,
the only difference is that the migrations are dis-
tributed in time using the estimation computed with
Algorithm 1 to avoid overlapping them.
The computational complexity of the Algorithm 3
is O(n
V MS
× n
servers
× n
links
), where n
V MS
is the num-
ber of running VMs on the DC that is sending the
VM, n
servers
is the number of candidate servers that
have the least possible amount of free cores to run the
VM in the destination host, and n
links
represents the
number of links that interconnects the VM’s host of
origin and the target host. For Algorithm 2, the com-
putational complexity is given by O(n
DCs
logn
DCs
+
n
DCs
2
× n
V MS
× n
servers
× n
links
), where n
DCs
is the
number of DCs.
SMARTGREENS 2022 - 11th International Conference on Smart Cities and Green ICT Systems
48

4.1 Energy Cost of Migrations
NEMESIS models the energy consumption of the live
migration with a computational task executed in the
destination host during the migration. This task uses
1 CPU core at 100% performance. If the migration
takes more time than necessary, energy is wasted both
from the server where the VM was initially running as
in the target server.
Algorithm 4: Extra cost of migrating.
pCore ← 20.5
wastedOrigin ← 0
wastedTarget ← 0
for mig in Migrations do
vmCores ← amount of cores of the VM being
migrated
extraTime ← mig.Time − mig.TimeNoCong
if extraTime > 0 then
wastedOrigin+ = extraTime · pCore ·
vmCores
wastedTarget+ = extraTime · pCore
end if
end for
The wasted energy is proportional to the extra time
migrating, that is, the difference between the dura-
tion of the migration process compared to the dura-
tion that it would take if there were no network con-
gestion. Given this extra time, a lower bound for
the wasted energy both on the server of origin and
the target server can be computed using Algorithm 4.
For the first, the energy consumed is brown(er), in-
creasing the overall brown energy consumption of the
cloud. For the second, the energy wasted is green(er)
and could have been used to execute another VM,
since the objective of the “follow-the-renewables ap-
proach” is to move the workload to the DCs that have
more availability of green energy. The value of pCore
is an estimate for the additional cost of executing a
core, and is obtained as follows: the server consumes
220 W at full load and subtracting the power con-
sumption of the IDLE state (97 W) it results in 123 W.
Finally, this value is divided by the total amount of
cores of the server (6), resulting in 20.5 W. Notice
that pCore is only multiplied by the number of cores
of the VM for the server of origin, since it remains
executing the VM until the end of the migration.
5 SIMULATIONS
Our simulations were developed using Simgrid
(Casanova et al., 2014) (version 3.28), a framework
that allows modeling distributed computing experi-
ments, as cloud platforms, and it is well validated by
the scientific community with over 20 years of usage.
For the network, it was used the default flow-level
TCP modeling of Simgrid that produces precise re-
sults for large distributed computing scenarios (as in
our case with thousands of servers) in a reasonable
amount of time, in contrast to packet-level simula-
tion, that despite being more precise, would result in
huge execution time for the simulations (Velho et al.,
2013). Regarding the cloud infrastructure, it was con-
sidered an adapted version of the Grid’5000, same as
NEMESIS, and presented in Section 3.1.
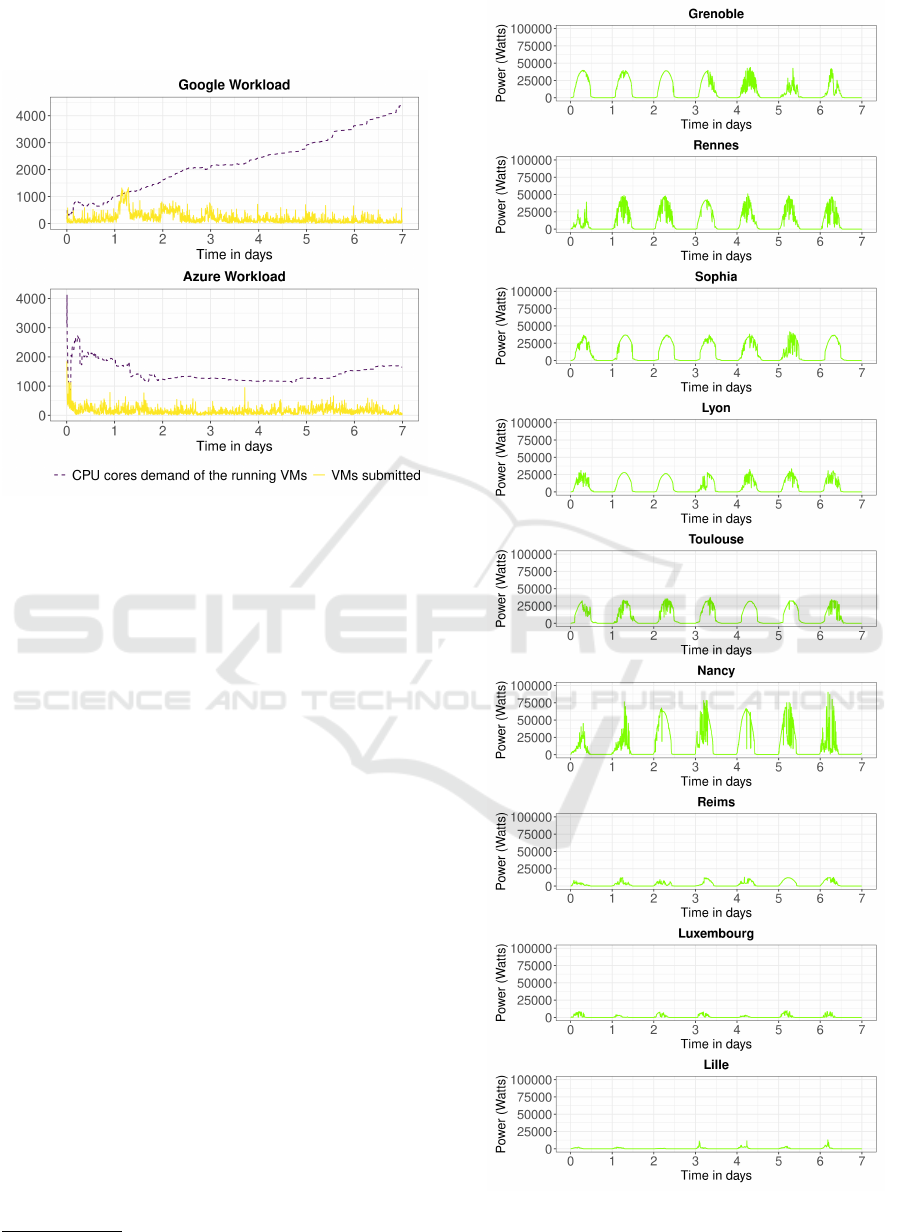
5.1 Workload
In the experiments, the workload was based on traces
from real cloud providers. The data extracted from
the traces were: the number of CPU cores requested,
when the task was submitted, and its duration. The
workloads are scaled to use at a maximum of 80% of
the computational resources of the cloud platform at
any given simulated time. This decision ensures that
the tasks will always be allocated to the servers and
allows analyzing the different scheduling approaches.
Figure 2 illustrates the distributions of the VMs sub-
mitted during the week (in yellow), and the cumula-
tive demand of CPU cores requested at a given time
(in purple), that is, the sum of the CPU cores that the
running VMs are using.
The first workload was based on the 2011 Google
Cluster Workload traces (Reiss et al., 2011), and con-
sists of over 380,000 VMs. In this workload, the VMs
have a long execution time, as can be seen in Figure 2
that the value of the running VMs’ CPU cores demand
keeps increasing throughout the week. The second
workload was based on traces from Microsoft Azure
(Hadary et al., 2020), more specifically the Azure
Trace for Packing 2020, and contains over 304,000
VMs. This workload has a different behavior than the
first: during the beginning of the week, there is a peak
in the VM submissions, and the VMs have a shorter
execution time, as seen that the CPU cores demand
does not keep increasing during the week.
The network usage by the workload is not mod-
eled, since the traces do not provide this data. The
additional load in the network is generated by the live
migration of the VMs, so this work can be seen as
a lower bound for the real world scenario. Regard-
ing the requested RAM per VM, it is considered that
each VM will consume 2 GB per core requested, sim-
ilar to the t2.small instance of Amazon EC2
2
. It
is also considered that the VMs executes with a full
2
https://aws.amazon.com/ec2/instance-types/
Indirect Network Impact on the Energy Consumption in Multi-clouds for Follow-the-renewables Approaches
49
CPU usage of the requested cores, the worst scenario
for energy consumption.
Figure 2: Workloads used as input for our simulations.
5.2 Green Energy Traces
The traces for the energy produced by the PV panels
were collected from the Photovolta project by Uni-
versit
´
e de Nantes
3
. The data represents an actual PV
panel’s power production at intervals of 5 minutes. In
order to simulate the different production of the DCs
geographically distributed, each DC considered a dif-
ferent week of the production trace. Furthermore,
each DC had 3 PV panels per server. The PVs in-
stalled in the DCs generated the following amount of
energy during the simulated week: i) Grenoble: 1.58
MWh; ii) Lille: 0.07 MWh; iii) Luxembourg: 0.15
MWh; iv) Lyon: 1.19 MWh; v) Nancy: 2.16 MWh;
vi) Reims: 0.38 MWh; vii) Rennes: 1.63 MWh; viii)
Sophia: 1.75 MWh; and ix) Toulouse: 1.53 MWh.
In total, around 10.5 MWh of green power was pro-
duced in the simulated week. Figure 3 shows the
green power production per DC during the simulated
week.
6 RESULTS
In this section, the results of the simulations are pre-
sented. First, it is analyzed the accuracy of the esti-
mation algorithm for the duration of migration (Al-
gorithm 1, an essential component of NEMESIS and
3
http://photovolta.univ-nantes.fr/
Figure 3: Green power production (in Watts) produced by
DC during the simulated week.
SMARTGREENS 2022 - 11th International Conference on Smart Cities and Green ICT Systems
50
c-NEMESIS algorithms. Then, an analysis of the live
migrations performed and their impact on network
congestion, wasted energy, and the total and brown
energy consumption is presented. To further evaluate
the effectiveness of using “follow-the-renewables ap-
proaches”, results from two state-of-the-art works are
presented.
The first is the WSNB algorithm (Workload shift-
ing non brownout) (Xu and Buyya, 2020). Initially,
the VM is assigned to the nearest DC (to ensure low
response time) and to the server that will increase the
energy consumption by the least. Then, if this initial
DC does not have enough green power to run the VM,
the algorithm will search for other DC (the DCs are
sorted by available green energy) that match this de-
mand and do not exceed a threshold for the response
time. If another DC is found, the VM will be real-
located to it. The algorithm does not perform server
consolidation. The response time restriction from the
algorithm was removed, since the used workloads do
not have this data.
The second work from state of the art is the
FollowMe@Source (or FollowMe@S) algorithm (Ali
et al., 2021) with its two versions: FollowMe@S In-
tra (that only perform VM migrations inside the same
DC) and FollowMe@S Inter (that only perform VM
migrations between different DCs). Both algorithms
have the same general steps, described as follows.
There are two main steps in the FollowMe@S al-
gorithm: allocation and migrations. In the allocation
step, the DCs are sorted by the availability of green
energy. The algorithm will traverse the DC list and
search for a server that can host the VM for each VM
to be scheduled. If no server was found after search-
ing through all DCs, the VM will be processed in the
next scheduling round. In the migration step, either
only intra-DC or inter-DC migrations are performed.
First, the running VMs are collected. Then the un-
derutilized hosts (less than 20% of CPU usage) are
marked to be turned off. These underutilized hosts
will only be the origin of the migrations. In the intra-
DC case, the algorithm will run in each DC sepa-
rately. For each VM, it will try to find a server that can
host the VM, and if it succeeds, the migration is per-
formed. In the inter-DC case, for each VM that can
be migrated, the algorithm will sort the DCs by the
availability of green energy, and migrate the VM to
the server of the first DC that can host the VM. Notice
that FollowMe@S does not consider the network to
schedule its migrations. The following modifications
were performed in the algorithm: the network costs of
a distributed algorithm and the workload degradation
performance by migrating the VM (since a homoge-
neous platform is used) are not considered.
Regarding the baselines, it is important to no-
tice that WSNB and FollowMe@S Intra only uses
“follow-the-renewables” for the initial scheduling,
and the VMs are not migrated to other DCs during
their execution. On the other hand, the algorithm
FollowMe@S Inter performs VM migrations to other
DCs — same strategy adopted by NEMESIS and c-
NEMESIS.
The code for the simulations, the traces for the
workloads and green power production, and the in-
structions to run and extract the results are available
on a public Git repository
4
. Furthermore, only results
for a single execution of the simulations are presented
because they are deterministic for these algorithms
and workloads.
6.1 Accuracy of the Estimation
Algorithm
Table 1 presents the number of live migrations that
were underestimated by NEMESIS and c-NEMESIS,
and the percentage value that is based on the total
number of migrations (that can be found in Table 3).
An underestimated migration is a migration whose
duration takes more than the estimation. For both
workloads, it is possible to observe that c-NEMESIS
presented almost no underestimation for the migra-
tions compared to NEMESIS. Furthermore, it is inter-
esting to notice that virtually all the intra-DC migra-
tions were underestimated in NEMESIS because all
migrations start simultaneously, resulting in network
congestion.
Table 1: Number of underestimated live migrations and the
ratio of the overestimation, where “W” stands for “Work-
load”, “G” for Google, and “A” for Azure.
Algorithm W Inter Intra
NEMESIS G 245 (4.4%) 3393 (95.7%)
c-NEMESIS G 0 (0%) 61 (2.9%)
NEMESIS A 140 (3.6%) 3324 (94.1%)
c-NEMESIS A 24 (0.1%) 49 (3.8%)
Only the number of underestimated migrations is
not enough to properly evaluate the estimation algo-
rithm, and two metrics to assess its accuracy were
used: the Mean Absolute Percentage Error (M.A.P.E.)
and the Root Mean Square Error (R.M.S.E.). The
M.A.P.E. is defined by:
1
n
∑
n
i=1
|R
i
−F
i
|
R
i
, where n rep-
resents the amount of values being considered, i the
index of the value being considered, R
i
the real dura-
tion of migration, and F
i
the estimated duration. The
results of the M.A.P.E. is a percentage value, and it
4
https://gitlab.com/migvasc/c-nemesis
Indirect Network Impact on the Energy Consumption in Multi-clouds for Follow-the-renewables Approaches
51
represents the relative value of the estimation errors
compared to the original value, thus it is a metric easy
to understand metric. The R.M.S.E. is defined by:
q
1
n
∑
n
i=1
(R
i
− F
i
)
2
. The R.M.S.E. is a metric simi-
lar to the standard deviation, and it allows to validate
how far from the original value was the estimation.
Table 2 lists the results for the measurements
of accuracy, and it is possible to observe that c-
NEMESIS is accurate with low error values. The dif-
ference between the precision values of the two ver-
sions of the estimation algorithm is explained by us-
ing the actual number of links that interconnect the
servers involved in the migration process, and the im-
pact caused by the network congestion.
Table 2: Accuracy measurements, where “W” stands for
“Workload”, “G” for Google, and “A” for Azure. The
M.A.P.E. value is in percentage (%), and the R.M.S.E. in
seconds.
Algorithm W M.A.P.E. R.M.S.E.
c-NEMESIS G 0.70 0.395
NEMESIS G 32.895 18.56
c-NEMESIS A 0.649 0.432
NEMESIS A 34.01 20.03
6.2 Analysis of the VM Live Migrations
Performed
Table 3 lists the number of live migrations performed
during the simulated week. NEMESIS performed the
lowest number of inter-DC migrations for both work-
loads, since its migration planning does not allow for
migrations in parallel leaving or arriving at the same
DC. The c-NEMESIS algorithm executed more inter-
DC migrations than NEMESIS, since it allows for
migrations in parallel. It had the lowest number of
intra-DC migrations for two factors: i) only performs
server consolidation for the DCs that are not perform-
ing inter-DC migrations; and ii) intra-DC migrations
are distributed in time. The FollowME@S algorithm
had the highest number of inter and intra-DC migra-
tions overall because the planning does not consider
network usage.
6.2.1 Total and Brown Energy Consumed by the
Cloud Platform
Table 4 lists the total and brown energy consumption
of the cloud platform during the simulated week. The
c-NEMESIS had the lowest brown energy consump-
tion among all algorithms, except for NEMESIS with
the Azure workload, in which the consumption was
the same. Regarding the total energy, c-NEMESIS
Table 3: Number of VM live migrations performed, where
“W” stands for “Workload”, “G” for Google, and “A” for
Azure.
Algorithm W Inter Intra
NEMESIS G 5617 3545
c-NEMESIS G 18056 2074
FollowMe@S Intra G 0 560862
FollowMe@S Inter G 96464 0
NEMESIS A 3863 3532
c-NEMESIS A 17479 1300
FollowMe@S Intra A 0 177086
FollowMe@S Inter A 93388 0
consumed more than NEMESIS because it performed
more migrations. However, more green energy was
harnessed, since the brown energy consumed was the
same or lower. Regarding the FollowME@S algo-
rithm, both inter and intra versions had similar brown
energy consumption, but the inter-DC approach con-
sumed less brown energy than the intra-DC (around
0.3% for the Google workload and 0.04% for the
Azure workload). The WSNB algorithm had the high-
est consumption of both total and brown energy.
Table 4: Comparison of energy consumption (MWh), where
“W” stands for “Workload”, “G” for Google, and “A” for
Azure.
Algorithm W Total Brown
NEMESIS G 25.46 17.23
c-NEMESIS G 25.56 17.18
FollowMe@S Intra G 27.56 19.13
FollowMe@S Inter G 27.59 19.07
WSNB G 29.49 20.89
NEMESIS A 30.43 21.21
c-NEMESIS A 30.55 21.20
FollowMe@S Intra A 31.69 22.41
FollowMe@S Inter A 31.69 22.40
WSNB A 33.56 24.23
The difference between the total and brown en-
ergy consumed with the green energy generated in
the simulated week (10.5 MWh) is compared to ob-
tain the green energy usage of the algorithms. For the
Google workload, the usage of green energy was: c-
NEMESIS = 80%, NEMESIS = 79%, FollowMe@S
Intra = 80%, FollowMe@S Inter = 81%, and WSNB
= 82%. Regarding the Azure workload, the usage
was: c-NEMESIS = 89%, NEMESIS = 88%, Fol-
lowMe@S Intra = 89%, FollowMe@S Inter = 89%,
and WSNB = 89%.
The scheduling policies and how the algorithms
adopt “follow-the-renewables” justify the difference
between the total and brown energy consumption,
and the relative value of green energy used. The
SMARTGREENS 2022 - 11th International Conference on Smart Cities and Green ICT Systems
52
Table 5: Extra seconds during migrations compared to the case when there is no congestion, where “W” stands for “Work-
load”, “G” for Google and, “A” for Azure. “avg.” for the average of the observations, “max.” for the maximum value, “abs.”
for the absolute value, and “rel.” for the relative value.
Algorithm W avg. abs. max. abs. avg. rel. max. rel. Total seconds
NEMESIS G 10.11 56.98 1.53 3.98 92915.7
c-NEMESIS G 0.22 0.88 1.0 1.05 4331.93
FollowMe@S Intra G 113.94 1028.51 6.37 40.82 64525098.3
FollowMe@S Inter G 215.18 4875.8 10.67 155.5 22058949.9
NEMESIS A 11.62 62.96 1.59 3.98 86235.46
c-NEMESIS A 0.23 6.14 1.0 1.32 4224.43
FollowMe@S Intra A 91.08 938.48 4.39 25.56 16384188.8
FollowMe@S Inter A 186.56 8047.89 7.8 157.24 18531893.3
algorithms WSNB and FollowMe@S Intra that pre-
sented the highest brown energy consumption only
used “follow-the-renewables” for the initial schedul-
ing, and didn’t migrate the workload to other DCs as
the green energy availability changed over time. To
further understand the difference in these results, the
next section will analyze the live migrations’ impact
on the total and brown energy consumption.
6.2.2 Wasted Resources in the Migrations
To evaluate wastage of resources (network and en-
ergy), all the live migrations performed in the algo-
rithms are compared with a perfect scenario for the
migrations, where the migrations are performed indi-
vidually and isolated, having full access to the net-
work.
Table 5 presents statistics about the extra seconds
it took to migrate the VMs in the simulations. The ab-
solute value is the absolute difference in seconds. For
example, on average, the live migrations performed
by the NEMESIS algorithm took 10.11 more seconds
compared to the perfect scenario for the Google work-
load. The relative value is the ratio of the differ-
ence. For example, in the FollowMe@S Inter with the
Google workload, the migration duration was more
than 10 times longer compared to the perfect scenario.
The c-NEMESIS algorithm performed better for
both workloads, with values close to the perfect sce-
nario: the average relative difference (avg. rel.) was
approximately 1. The NEMESIS algorithm had low
extra seconds values, and the duration of the migra-
tions took, on average, about 1.5 more than in the
perfect scenario. The migrations performed by Fol-
lowME@S, both intra and inter-DC cases, had the
most waste of resources. The duration of migrations
took, on average, from 4 to 10 times more than the
perfect scenario. These results highlight the impor-
tance of considering the network for the migration
scheduling, since c-NEMESIS and NEMESIS pre-
sented the lowest wastage of resources.
Table 6: Wasted energy in the migrations (Wh), where “W”
stands for “Workload”, “G” for Google, and “A” for Azure.
Algorithm W Origin Target
NEMESIS G 545.1 529.1
c-NEMESIS G 35.42 24.67
FollowMe@S Intra G 473971.6 367434.6
FollowMe@S Inter G 153829.96 125613.5
NEMESIS A 539.59 491.06
c-NEMESIS A 39.31 24.06
FollowMe@S Intra A 163128.14 93298.9
FollowMe@S Inter A 175086.3 105528.8
Using the wasted seconds of migrations, a lower
bound for the wasted energy is computed using Al-
gorithm 4 and present the results on Table 6. The al-
gorithm FollowMe@S (both inter and intra-DC ver-
sions) was the algorithm that most wasted energy.
The c-NEMESIS algorithm had the lowest wastage of
energy overall, despite performing more migrations
than NEMESIS (that was the second better in terms
of wastage of energy). These values are justified by
the fact that wasted energy is directly proportional
to the duration of the migrations, thus bad planning
will have a direct impact on energy consumption. It
is important to notice that this wasted green energy
could even be used to power the cloud platform: in the
FollowMe@S intra-DC with the Google workload, it
could power all the servers at maximum capacity of
the Luxembourg DC for approximately 44 hours.
7 CONCLUSIONS
Reducing brown energy consumption in cloud com-
puting platforms is a complex and challenging prob-
lem currently being addressed from multiple angles.
In this work, we focus on the strategy “follow-the-
renewables”, and study the indirect impact on the en-
ergy consumption caused by the additional load gen-
erated in the network. Our experiments were based
Indirect Network Impact on the Energy Consumption in Multi-clouds for Follow-the-renewables Approaches
53

on real-world data for the cloud infrastructure, work-
loads, and photovoltaic power production.
This work demonstrates that the indirect network
impact on the energy consumption in multi-clouds for
“follow-the-renewables” approaches is generated by
bad scheduling policies for the migrations. This re-
sults in the wastage of resources in terms of the net-
work — which could be used by the applications run-
ning on the VMs or even to perform more live migra-
tions — and energy — that could be used to power
the cloud platform. Also, “follow-the-renewables”
approaches need to consider the whole execution of
the workload. The state-of-the-art algorithms that
only used the green energy information for the initial
scheduling had the highest brown energy consump-
tion.
We also provide an estimation algorithm for the
duration of the live migrations that is accurate. This
estimation algorithm is essential for c-NEMESIS, and
it was able to increase the number of migrations by a
least 3-fold without network congestion, while main-
taining or reducing the brown energy consumption
compared to other state-of-the-art works.
As future work, the network usage by the work-
load and how it will compete for network resources
with the live migrations needs further investigation.
This work can also be easily extended to consider vir-
tualization with containers by updating the estimation
algorithm with a model for container live migration.
Finally, recent approaches explore turning off the net-
work devices to deal with their static energy con-
sumption. This technique reduces the available net-
work links in the cloud platform, and it is necessary
to analyze if the energy savings are more significant
than the impacts caused by the network congestion.
ACKNOWLEDGEMENTS
This work has been partially supported by the LabEx
PERSYVAL-Lab (ANR-11-LABX-0025-01) funded
by the French program Investissement d’avenir and
by grant #2021/06867-2, S
˜
ao Paulo Research Foun-
dation (FAPESP). This research is part of the INCT
of the Future Internet for Smart Cities funded
by CNPq proc. 465446/2014-0, Coordenac¸
˜
ao de
Aperfeic¸oamento de Pessoal de N
´
ıvel Superior –
Brasil (CAPES) – Finance Code 001, FAPESP proc.
14/50937-1, and FAPESP proc. 15/24485-9.
REFERENCES
Ali, H., Zakarya, M., Rahman, I. U., Khan, A. A., and
Buyya, R. (2021). Followme@ls: Electricity price and
source aware resource management in geographically
distributed heterogeneous datacenters. Journal of Sys-
tems and Software, 175:110907.
Camus, B., Dufoss
´
e, F., Blavette, A., Quinson, M., and Org-
erie, A. (2018). Network-Aware Energy-Efficient Vir-
tual Machine Management in Distributed Cloud In-
frastructures with On-Site Photovoltaic Production. In
2018 30th International Symposium on Computer Ar-
chitecture and High Performance Computing (SBAC-
PAD), pages 86–92, Lyon, France. IEEE.
Camus, B., Dufoss
´
e, F., and Orgerie, A. (2017). A stochas-
tic approach for optimizing green energy consump-
tion in distributed clouds. In SMARTGREENS 2017
- International Conference on Smart Cities and Green
ICT Systems, Porto, Portugal. SMARTGREENS.
Casanova, H., Giersch, A., Legrand, A., Quinson, M.,
and Suter, F. (2014). Versatile, scalable, and accu-
rate simulation of distributed applications and plat-
forms. Journal of Parallel and Distributed Comput-
ing, 74(10):2899–2917.
Dias, A. H. T., Correia, L. H. A., and Malheiros, N. (2021).
A systematic literature review on virtual machine con-
solidation. ACM Comput. Surv., 54(8).
Feldmann, A., Gasser, O., Lichtblau, F., Pujol, E., Poese, I.,
Dietzel, C., Wagner, D., Wichtlhuber, M., Tapiador,
J., Vallina-Rodriguez, N., et al. (2021). The lockdown
effect: Implications of the covid-19 pandemic on the
internet traffic. In Broadband Coverage in Germany;
15th ITG-Symposium, pages 1–5. VDE.
Frazelle, J. (2020). Power to the People. ACM Queue,
18(2):5–18.
Greenpeace (2017). Clicking Green: who is winning the
race to build a green Internet. Greenpeace report.
Hadary, O., Marshall, L., Menache, I., Pan, A., Greeff,
E. E., Dion, D., Dorminey, S., Joshi, S., Chen, Y.,
Russinovich, M., et al. (2020). Protean: VM alloca-
tion service at scale. In 14th USENIX Symposium on
Operating Systems Design and Implementation (OSDI
20), pages 845–861.
Hlavacs, H., Da Costa, G., and Pierson, J.-M. (2009).
Energy Consumption of Residential and Professional
Switches. In 2009 International Conference on Com-
putational Science and Engineering, volume 1, pages
240–246.
Koot, M. and Wijnhoven, F. (2021). Usage impact on data
center electricity needs: A system dynamic forecast-
ing model. Applied Energy, 291:116798.
Masanet, E., Shehabi, A., Lei, N., Smith, S., and Koomey,
J. (2020). Recalibrating global data center energy-use
estimates. Science, 367(6481):984–986.
Muralidhar, R., Borovica-Gajic, R., and Buyya, R. (2020).
Energy efficient computing systems: Architectures,
abstractions and modeling to techniques and stan-
dards. arXiv preprint arXiv:2007.09976.
Reiss, C., Wilkes, J., and Hellerstein, J. L. (2011). Google
SMARTGREENS 2022 - 11th International Conference on Smart Cities and Green ICT Systems
54

cluster-usage traces: format+ schema. Google Inc.,
White Paper.
Shuja, J., Gani, A., Shamshirband, S., Ahmad, R. W., and
Bilal, K. (2016). Sustainable cloud data centers: a sur-
vey of enabling techniques and technologies. Renew-
able and Sustainable Energy Reviews, 62:195–214.
Velho, P., Schnorr, L., Casanova, H., and Legrand, A.
(2013). On the Validity of Flow-level TCP Network
Models for Grid and Cloud Simulations. ACM Trans-
actions on Modeling and Computer Simulation, 23(4).
Xu, M. and Buyya, R. (2020). Managing renewable energy
and carbon footprint in multi-cloud computing envi-
ronments. Journal of Parallel and Distributed Com-
puting, 135:191–202.
Indirect Network Impact on the Energy Consumption in Multi-clouds for Follow-the-renewables Approaches
55
