
Analysis of Psychological Test Data by using K-means Method
Angel Alberto Jiménez Sarango
1a
, Andrés Patiño
1b
, María-Inés Acosta-Urigüen
1c
,
Juan Gabriel Flores Sanchez
1d
, Priscila Cedillo
1,2 e
and Marcos Orellana
1f
1
Laboratorio de Investigación y Desarrollo en Informática - LIDI,
Universidad del Azuay, Av. 24 de mayo, Cuenca, Ecuador
2
Universidad de Cuenca, Cuenca, Ecuador
juanfloressanchez@es.uazuay.edu.ec, {icedillo, marore}@uazuay.edu.ec
Keywords: Stroop, Stress, Machine Learning, K-means, Clustering.
Abstract: The Stroop test also called the colors and words test, is a widely used attention test to detect
neuropsychological problems. Moreover, the stress test is a psychological instrument used to diagnose the
level of stress and to identify the most common symptoms. This research aims to evaluate whether there is a
relationship between the score of the Stroop test and the participant's level of stress. Data are collected through
a web application, where participants answered the stress test and completed the Stroop test. Several variables
were collected, such as the precision of each answer, the time spent, and demographic information. The
machine learning technique called k-means was applied to process the collected data; the results include
clusters of unlabeled data to find relationships. The main findings show that a person's stress level is directly
linked to the number of correct answers obtained in the Stroop test; according to the clusters that show higher
stress levels, the number of correct answers decreased progressively.
1 INTRODUCTION
The Stroop test, also known as the color and word
test, was first proposed in 1935 by the American
Psychologist J. Ridley Stroop (Stroop, 1935). It is an
efficient neuropsychological test, widely used for
experimental and clinical purposes. This evaluation
tool is designed to measure an individual's reaction
time in a specific task, and the reaction time with the
number of correct answers obtained by the
participant. The application of the Stroop test is
performed through the fastest possible reading of
three different tables. The first two represent
“Congruent Conditions”, while the third represents an
“Incongruent Condition” (Scarpina & Tagini, 2017).
A congruent condition is a word whose color matches
correctly, while an incongruous condition occurs
a
https://orcid.org/0000-0003-0018-4535
b
https://orcid.org/0000-0001-9504-6498
c
https://orcid.org/0000-0003-4865-2983
d
https://orcid.org/0000-0002-1249-2255
e
https://orcid.org/0000-0002-6787-0655
f
https://orcid.org/0000-0002-3671-9362
when the word and the color represented are different
(van Maanen et al., 2009).
There are two ways to score the Stroop test: the
time it takes the subject to complete the entire test and
the number of correct answers within a specific
period of time (Golden, 2001). Although, several
studies have shown that, in ordinary people, the
results of both methods are the same (Scarpina &
Tagini, 2017), (Geukes et al., 2015).
Stress is a feeling of physical or emotional tension
in the life of the human being, which is experienced
at some point, more or less frequently. For example,
a person can experience stress when dealing with
changes in their environment, feeling frustrated,
finding themselves in a situation that cannot control,
among others, which alter the mood (National Center
for Biotechnology Information, 2005). According to
Szabo and Somogyi (2012), Hans Selye points out
that stress is human behavior based on demands that
236
Sarango, A., Patiño, A., Acosta-Urigüen, M., Sanchez, J., Cedillo, P. and Orellana, M.
Analysis of Psychological Test Data by using K-means Method.
DOI: 10.5220/0011046900003188
In Proceedings of the 8th International Conference on Information and Communication Technologies for Ageing Well and e-Health (ICT4AWE 2022), pages 236-243
ISBN: 978-989-758-566-1; ISSN: 2184-4984
Copyright
c
2022 by SCITEPRESS – Science and Technology Publications, Lda. All rights reserved

specify several stages as a form of alarm, resistance,
and exhaustion; therefore, it is an adaptive process
and a moment of emergency, necessary for survival.
Machine learning is a data analysis method, which
automates the construction of models. It will allow to
generate predictions by analyzing the data, so
unobserved results or future behaviors can be
predicted (Orrù et al., 2020). According to Bleidorn
& Hopwood (2019), one of the great uses of machine
learning in psychological science is the developing of
assessment tools that can predict a person's
personality through information circulating on the
Internet (e.g., Facebook, Twitter, Instagram). It
allows to create predictions using supervised models,
such as decision trees, Naive Bayes, neural networks,
and unsupervised models like clustering (Yarkoni &
Westfall, 2017). Monitored models are created from
tagged samples; in contrast, unsupervised models are
developed using unlabeled examples, consisting of
grouping examples based on their similarities (Orrù
et al., 2020). These models allow to classify and find
relationships between different variables entered into
the algorithm and generate predictions (Yarkoni &
Westfall, 2017). Shatte et al. (2019), show that in
recent years, the application of machine learning
within mental health has developed multiple uses.
Around 300 investigations that used this method to
facilitate data analysis, obtained and generated
predictions with extremely high reliability.
Furthermore, these techniques let researchers better
understand their results, and consider better future
projects that may derive from them (Yarkoni &
Westfall, 2017).
There are several studies about the Stroop test,
van Maanen et al. (2009), Nishikawa et al. ( 2019),
Kim et al.(2015). However, none of them show a
direct relationship between the application of the
Stroop test with stress. In this context, the use of
machine learning is proposed as a tool that can find
out the relationship between different variables
(Nishikawa et al., 2019), (Shatte et al., 2019),
(Srividya et al., 2018).
This research aims to apply machine learning
techniques to data obtained from the Stroop test to
find patterns affected by stressful situations. Then, the
Stroop test will be applied to a group of individuals,
forming a dataset to apply a machine learning
algorithm. Finally, the data will be analyzed to
generate predictions through unsupervised learning,
leaving the proposed model to classify the common
characteristics among them. Also, patterns of anxiety
or depression are expected to be found within the
group to be tested.
The structure of this document is as follows:
Section 1 presents the introduction. Section 2
discusses the related work. Section 3 presents the
methodology used in this research. Section 4 deals
with the results obtained by the investigation. Finally,
Section 5 presents the conclusions and future work.
2 RELATED WORK
The Stroop test has significant importance in
psychology, because it allows to evaluate individual’s
ability to inhibit cognitive interference, when
processing characteristics that affect a simultaneous
stimulus of another attribute of the same stimulus
(Stroop, 1935). In this context, Tulen et al. (1989)
demonstrate in their research the existence of
significant changes in feelings of anxiety and tension
based on data obtained about the heart rate. Likewise,
De Paula et al. (2020), applied this test to older
people, highlighting its potential to serve as cognitive
exercises, which could be a helpful tool for the
prevention and treatment of aging diseases. On the
other hand, Karthikeyan et al. (2012) affirmed that
there is a significant change in the results obtained
between an individual's normal state and the state of
stress after applying the Stroop test, with a precision
level of 79.17%. Regarding the methods of its
application, Wu et al. (2010) show a way of executing
it: through a cognitive performance evaluation test of
reality, the user faces a driving simulation. Here,
people read words written in different colors,
coherent or not, with their semantic meaning. In this
way, the researchers obtain reaction time and user
error data gathered from users’ different stimuli.
Likewise, Prado et al. (2021) show a comfortable way
to apply the Stroop test for the user when performing
it through a simple application connected to an eye
tracker, that allows automating data collection.
In psychology, Lu et al. (2012) proposed a method
to detect stress, based on the analysis of the variations
of the articulation of speech using smartphones. The
authors reported a predictive stress accuracy of 81%
and 76% for indoor and outdoor environments,
respectively, using the vocal production of 14
subjects. Likewise, Maxhuni et al. (2017) used an
intermediate method to represent a person's mood and
use it to build a predictive stress model that obtained
an accuracy of 78.2%. On the other hand, Arriba-
Pérez et al. (2019) show alternative ways to detect
stress through new technologies, such as smart
bracelets. In this way, the data collection can be
automated to estimate a person's stress without the
Analysis of Psychological Test Data by using K-means Method
237
need for clinical measurements supervised by health
professionals.
While in the field of machine learning, according
to Shatte et al. (2019), mental health applications for
machine learning were identified in four key
domains: detection and diagnosis of mental health
conditions; prognosis, treatment and support; public
health; and research and clinical administration. In
these aspects, Khoury et al. (2019) worked on the
diagnosis of Alzheimer's through the use of
supervised and unsupervised machine learning
approaches. After comparing them with three studies
of the same data set using traditional techniques, valid
results could be reached. On the other hand, Seo et al.
(2019) showed that it is possible to apply machine
learning and deep learning techniques to multiple data
sets of information to recognize mental stress within
the workplace. Likewise, Ho et al. (2019)
demonstrate that stress analysis using machine
learning and deep learning is effective since
conventional machine learning algorithms, such as
SVM and AdaBoost, produced results with a
precision of 64.74% ± 1.57% and 71.13% ± 2.96%,
respectively. In contrast, deep learning algorithms,
such as deep belief networks and convolutional neural
network models, have obtained results with an
accuracy of 84.26% ± 2.58% and 72.77% ± 1.92%,
respectively.
According to the research of Xu et al. (2015), the
k-means algorithm provides good results in the
analysis of stress-related data. Additionally, Laird et
al. (2005) demonstrate that clustering in data analysis,
obtained from the Stroop test generates optimal
results. The clustering k-means is one of the most
widely used algorithms to find hidden or theoretically
suspected groups in an unlabeled data set.
Furthermore, it also allows discovering relationships
between data groups, which would not have been
recognized manually (Xu et al., 2015).
Even though stress and Stroop's test concepts have
been widely studied separately, there is no research
evidence based on the relationship between them.
Multiple scenarios can be analyzed to determine if
environmental variables affect the Stroop test results
based on this relation.
3 METHODOLOGY
For the experiment, a stress test will be carried out to
determine the stress levels in the testing subjects.
Subsequently, a web page will be developed in which
the Stroop test will be applied. Afterward, a machine
learning algorithm known as k-means will be applied
to the data to analyze them. Due to the characteristics
described in section 2, the k-means algorithm has
been selected for the data analysis because of its wide
application in research and ease of implementation.
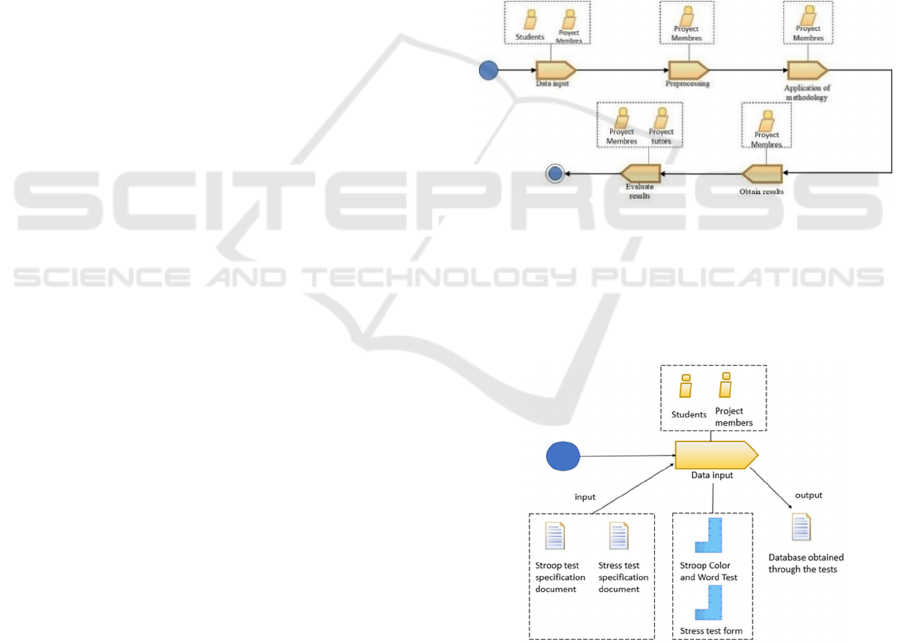
The project's development is shown in Figure 1,
which specifies the research process following the
parameters of the Software Process Engineering
Meta-Model (SPEM). SPEM is a “meta-model” and
a UML 2.0 profile used to define software
development processes and systems and their
components (Ruiz-Rube et al., 2013). Therefore, it is
a standardized scheme for describing development
processes managed by the Object Management Group
(Omg, 2008).
To apply the stress and Stroop tests, a group of
110 individuals between 19 and 30 years old was
selected. The data obtained were processed and stored
in a database on the cloud.
Figure 1: SPEM Diagram.
3.1 Data Entry
Data will be obtained with the application of both the
stress test and the Stroop test.
Figure 2: SPEM Diagram.
3.2 Stress Test
First, a stress test composed of 12 specific questions
will be applied to determine the stress level. The
questions are related to aspects such as physical and
psychological conditions. This type of test is a
ICT4AWE 2022 - 8th International Conference on Information and Communication Technologies for Ageing Well and e-Health
238
derivative of the psychosomatic problems
questionnaire that has already been used with good
results by Rincón (2019).
The questionnaire asks if the participant has felt
any of twelve symptoms in the last three months. The
answers are evaluated through a Likert’s scale with six
possible values in terms of frequency (1=Never; 2=
Rarely; 3=Occasionally; 4= Sometimes; 5= Relatively
often; 6= Very often) (Rincón, 2019). Therefore, by
adding results, it is possible to calculate the stress level
of the participant, as shown in Table 1.
Table 1: Stress levels.
Total sum Stress level
Sum<24
N
o stress
24>=Sum<36 Low stress
36>=Sum<48 Medium stress
48>=Sum<60 Hi
g
h stress
60>=Su
m
Critical stress
3.3 Stroop Test
Prado et al. (2021) proposed an application based on
the Stroop test containing only the last section of the
original one, related to concentration. The test
classification carried out considering the hits
performed at a specific time (van Maanen et al.,
2009). For this test, a total of 95 seconds is selected.
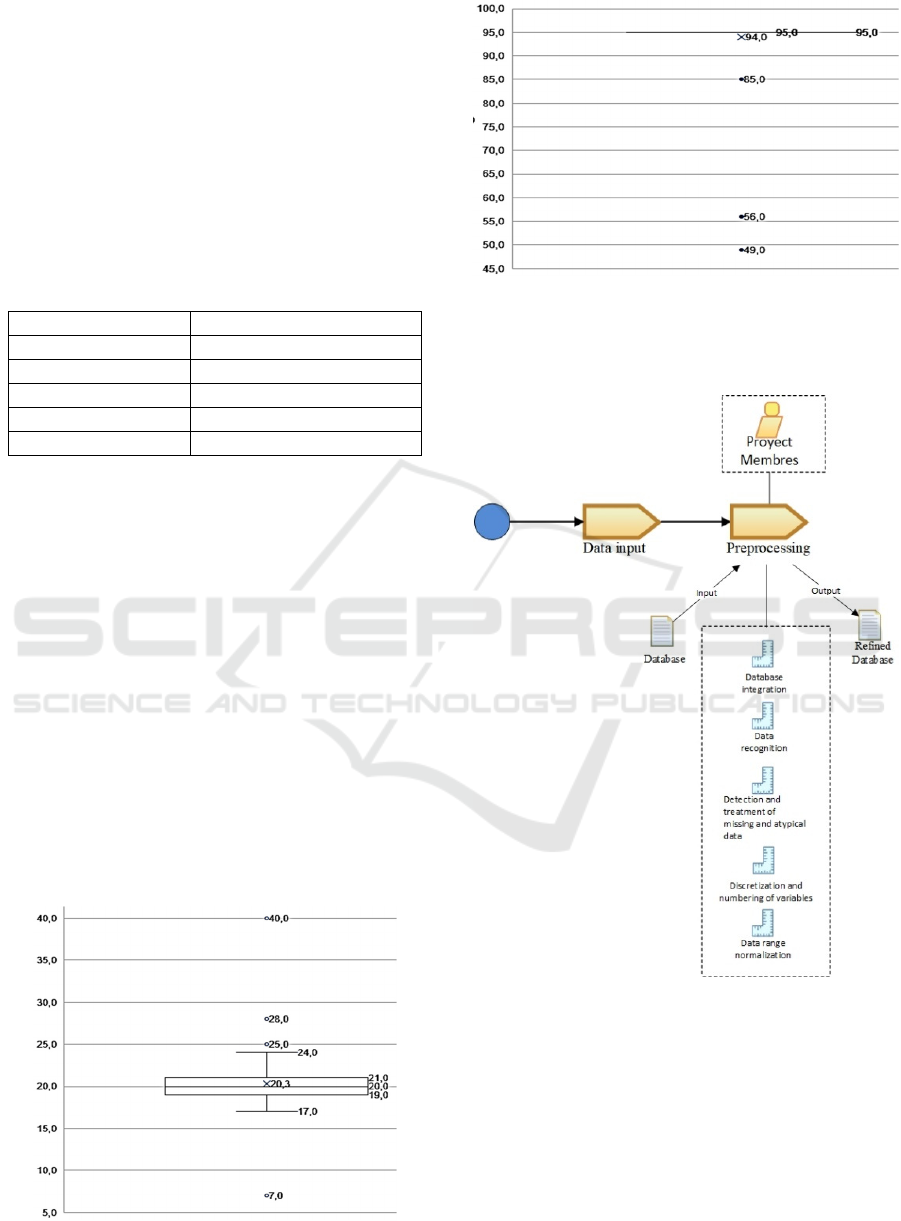
3.4 Data Processing
Once the data has been collected, a process based on
the proposed by Seid & Pooja (2019) is defined. The
information obtained from the tests will be debugged
and standardized; the missing values and outliers
were not considered. The inter-quartile range analysis
method was used to find and eliminate outliers, as
shown in Figure 3 and Figure 4.
Figure 3: Inter-quartile range analysis to age variable.
Figure 4: Inter-quartile range analysis to time variable.
The z-transform method is executed to obtain
standard range among the entire data set.
Figure 5: Preprocessing diagram.
3.5 The K-means Method
The machine learning algorithm k-means is applied,
where the distance is used to calculate the k-groups.
In order to determine the number of clusters, a
Silhouette’s coefficient method is applied. This
method combines the cohesion and separation factors
of the clusters. Cohesion is the average distance to the
examples they find inside the same cluster.
Analysis of Psychological Test Data by using K-means Method
239
Separation is the average distance to the closer cluster
(Yuan & Yang, 2019). It is calculated as follows:
s(x)=(b(x)-a(x))/(max(a(x),b(x))) (1)
The resulting value is in the range [−1, +1]. If the
value is near 1, it indicates a close relationship
between the object and the cluster.
RapidMiner software was used for data analysis
and data mining.
4 RESULTS
This study uses 105 records from the Stroop and
stress test. To apply the k-means method, three
different data configurations were used. The variables
referring to stress levels and Stroop test results were
used in the first form. Occupation and age were
added in the second and third forms, respectively. The
Figure 6 shows the Silhouette coefficient calculated
for every configuration.
Figure 6: Silhouette’s coefficient for every configuration of
Clusters.
When the results are analyzed, the most
significant value of cohesion and separation in the
clusters is achieved when k=3. Table 2 and Figures 7,
8, and 9 show the distribution of the cluster.
Table 2: K-means results.
Stress-
Stroop
Occupation-
Stress-
Stroop
Age-
Stress-
Stroop
Cluster 0 29 items 51 items 26 items
Cluster 1 51 items 29 items 20 items
Cluster 2 15 items 15 items 49 items
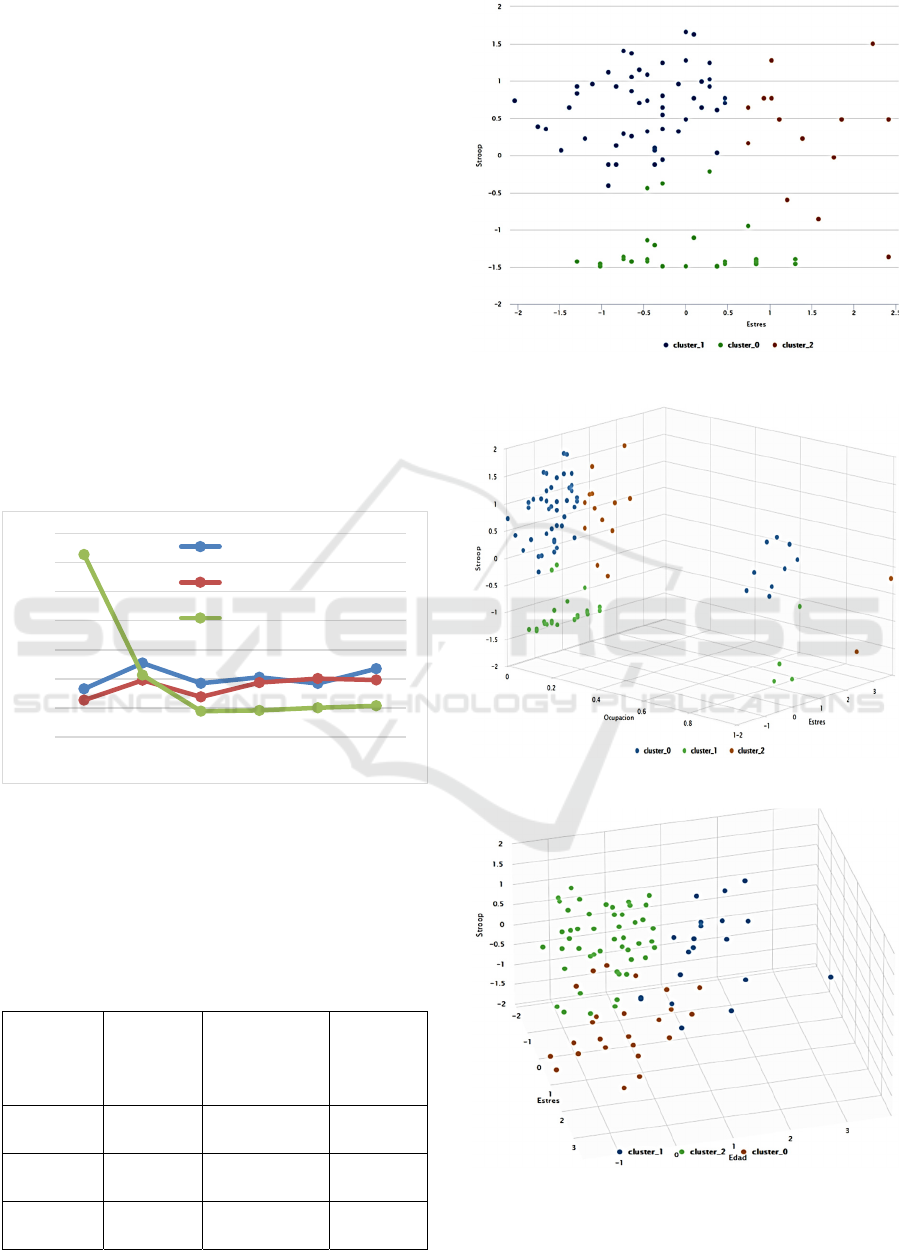
Figure 7: Clusters resulted of the Stroop Stress.
Figure 8: Clusters Occupation Stroop Stress.
Figure 9: Clusters of Age variable.
0,2
0,3
0,4
0,5
0,6
0,7
0,8
0,9
234567
Stroop Stress
Occupation Stroop Stress
Age Stroop Stress
ICT4AWE 2022 - 8th International Conference on Information and Communication Technologies for Ageing Well and e-Health
240
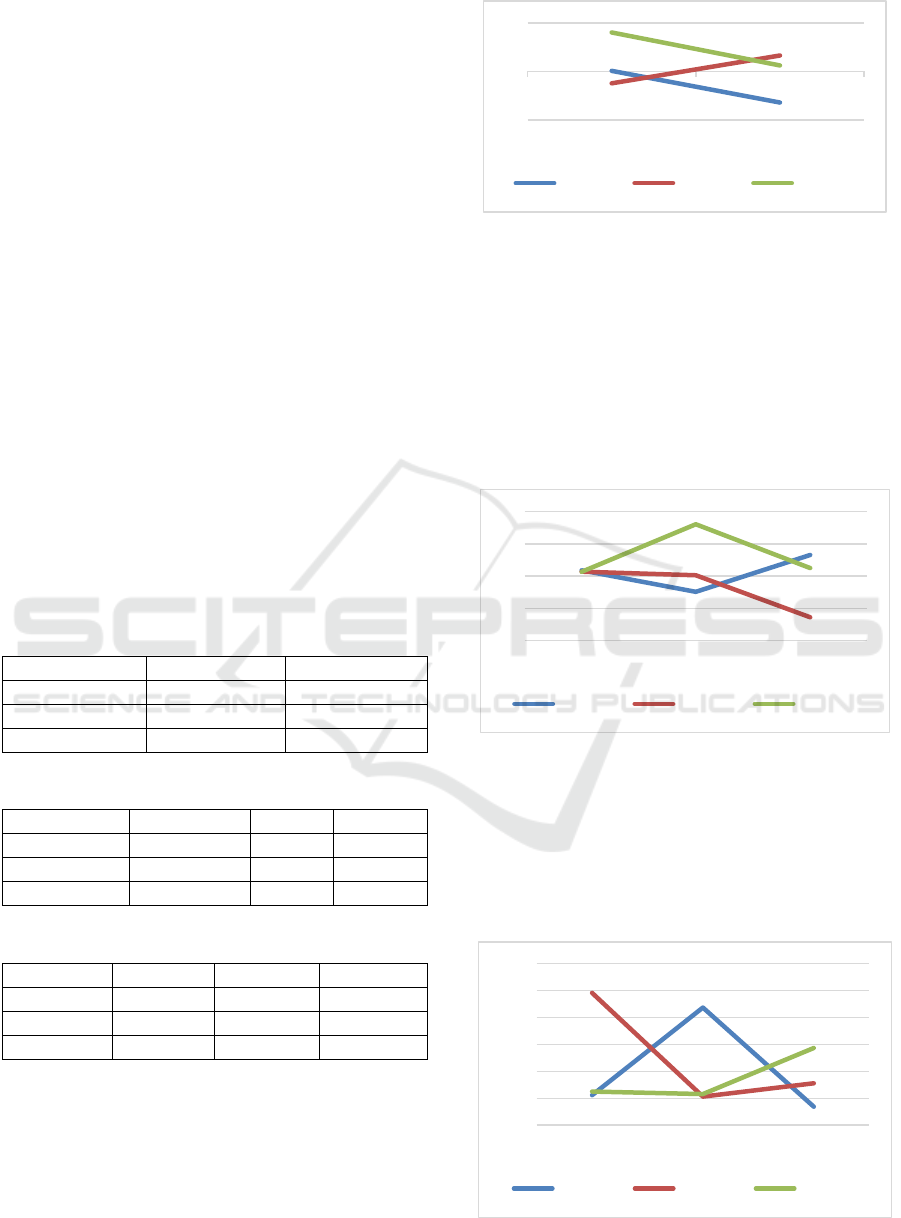
Figure 7 shows how “Cluster 0” groups most of
the data with a low score on the Stroop test regardless
of the person's stress level.
While in “Clusters 1” and “Cluster 2” the best
results of the Stroop test are divided by the level of
stress presented by the people, being “Cluster 1” the
one that groups the results with the lowest level of
stress and “Cluster 2” those with the highest level of
stress.
Figure 8 shows a distribution similar to the one
gotten in Figure 7 with the difference that the names
of “Cluster 0” and “Cluster 1” are changed. This is
due to the fact that the occupation variable divides the
data without any change in the distribution of the
clusters, when it has fewer classes. Table 2 presents
the described results.
In Figure 9, it can be seen that the age variable
causes to change completely the distribution of
clusters data. This can be interpretated as the results
of the stress test are low with an older age while at a
younger age, the level of stress of the person can vary
more.
A comparative analysis of the results was
performed to detect whether the stress levels (detailed
in Table 1) generate significant changes of the
possible results of the Stroop test.
Table 3: Table of centroids Stress-Stroop.
Stress Stroop
Cluster 0 0.025 -1.281
Cluster 1 -0.488 0.656
Cluster 2 1.610 0.247
Table 4: Table of centroids Occupancy.
Occupation Stress Stroop
Cluster 0 0.176 -0.488 0.656
Cluster 1 0.138 0.025 -1.281
Cluster 2 0.133 1.610 0.247
Table 5: Table of centroids Age.
Age Stress Stroop
Cluster 0 -0.444 1.185 -0.656
Cluster 1 1.458 -0.468 -0.222
Cluster 2 -0.376 -0.422 0.435
The Stress-Stroop relationship (Table 3) shows
that “Cluster 1” has a positive correlation; however,
“Cluster 0” and “Cluster 2” show an inverse trend.
This shows that people who have a lower stress level
at the time of taking the Stroop test will obtain higher
scores on it than people whose stress level is moderate
or high.
Figure 10: Stress-Stroop Relation.
Adding the Occupation variable to the analysis,
shows that “Cluster 0” and “Cluster 1” exchange their
trends, while “Cluster 2” remains unchanged. This is
due to the fact that the data referring to the occupation
of the people were centralized for the most part in one
type of occupation, which caused the distribution of
the data not to change and the relationship shown in
Figure 11 to be the same than in Figure 10, with the
only change in the “Cluster 0” and “Cluster 1”.
Figure 11: Occupancy-Stress-Stroop Relation.
Finally, by adding the age variable to the analysis,
“Cluster 0” and “Cluster 1” maintain their original
trends, but the relationship of “Cluster 2” is reversed.
This is because the age variable causes the
distribution of the Stress and Stroop data vary. It can
be seen in Table 5 and Figure 12 where lower levels
Figure 12: Age-Stress-Stroop Relation.
-2
0
2
Stress Stroop
Cluster 0 Cluster 1 Cluster 2
-2
-1
0
1
2
Occupation Stress Stroop
Cluster 0 Cluster 1 Cluster 2
-1
-0,5
0
0,5
1
1,5
2
Age Stress Stroop
Cluster 0 Cluster 1 Cluster 2
Analysis of Psychological Test Data by using K-means Method
241

of stress correspond to older age. While at lower age
values, the distribution of the reference data remains
similar to the two previous study cases, since the
relationship of lower stress level with higher results
in the Stroop test is maintained.
5 CONCLUSIONS
In this research, the analysis of the data obtained
through applying the stress and Stroop tests were
carried out. First, the dataset was cleaned, and then
the k-means method was applied, from which data
clusters were obtained for analysis. It is observed that
the relationship between the Stroop and stress tests
does not maintain a fixed correlation.
With the intention of analyzing if the inclusion of
demographic variables alters or not the results of the
clusters, different combinations were used. The
variables “occupation” (person activity) and “age”
were considered to perform this data analysis.
The results show that the age variable does not
alter the trends of the clusters, while the occupation
variable exchanges the labels of the clusters. This
demonstrates that the inclusion of demographic
variables does not change the relationship between
the two tests.
In the future, other machine learning techniques
could be applied to obtain the relationship between
demographical variables and the Stress-Stroop test. It
is also considered a larger dataset that includes more
diverse demographic variables.
ACKNOWLEDGMENTS
The authors wish to thank the Vice Rectorate for
Research of the Universidad del Azuay for the
financial and academic support. We thank our
colleagues from Laboratorio de Investigación y
Desarrollo en Informática (LIDI) who provided
insight and expertise that greatly assisted this work.
As well as the Grupo de Investigación e Innovación
Tecnológica (GIIT) from the Departamento de
Ciencias de la Computación de la Universidad de
Cuenca for allowing us to be part of this area of study.
REFERENCES
Bleidorn, W., & Hopwood, C. J. (2019). Using Machine
Learning to Advance Personality Assessment and
Theory. Personality and Social Psychology Review,
23(2), 190–203. https://doi.org/10.1177/10888683187
72990
de Arriba-Pérez, F., Santos-Gago, J. M., Caeiro-Rodríguez,
M., & Ramos-Merino, M. (2019). Study of stress
detection and proposal of stress-related features using
commercial-off-the-shelf wrist wearables. Journal of
Ambient Intelligence and Humanized Computing,
10(12), 4925–4945. https://doi.org/10.1007/s12652-
019-01188-3
De Paula, G., Valentim, P., Seixas, F., Santana, R., &
Muchaluat-Saade, D. (2020). Sensory effects in
cognitive exercises for elderly users: Stroop game.
Proceedings - IEEE Symposium on Computer-Based
Medical Systems, 2020-July, 132–137.
https://doi.org/10.1109/CBMS49503.2020.00032
Geukes, S., Gaskell, M. G., & Zwitserlood, P. (2015).
Stroop effects from newly learned color words: Effects
of memory consolidation and episodic context.
Frontiers in Psychology, 6(MAR), 1–17.
https://doi.org/10.3389/fpsyg.2015.00278
Golden, C. (2001). Test de Colores y Palabras (3rd ed.).
TEA Ediciones.
Ho, T. K. K., Gwak, J., Park, C. M., & Song, J. I. (2019).
Discrimination of Mental Workload Levels from Multi-
Channel fNIRS Using Deep Leaning-Based
Approaches. IEEE Access, 7, 24392–24403.
https://doi.org/10.1109/ACCESS.2019.2900127
Karthikeyan, P., Murugappan, M., & Yaacob, S. (2012).
Analysis of stroop colorword test-based human stress
detection using electrocardiography and heart rate
variability signals. Arabian Journal for Science and
Engineering, 39(3), 1835–1847.
https://doi.org/10.1007/s13369-013-0786-8
Khoury, N., Attal, F., Amirat, Y., Oukhellou, L., &
Mohammed, S. (2019). Data-driven based approach to
aid Parkinson’s disease diagnosis. Sensors
(Switzerland), 19(2), 1–27. https://doi.org/10.3390/s19
020242
Kim, J. W., Sharma, V., & Ryan, N. D. (2015). Predicting
methylphenidate response in ADHD using machine
learning approaches. International Journal of
Neuropsychopharmacology, 18(11), 1–7.
https://doi.org/10.1093/ijnp/pyv052
Laird, A. R., McMillan, K. M., Lancaster, J. L., Kochunov,
P., Turkeltaub, P. E., Pardo, J. V., & Fox, P. T. (2005).
A comparison of label-based review and ALE meta-
analysis in the stroop task. Human Brain Mapping,
25(1), 6–21. https://doi.org/10.1002/hbm.20129
Lu, H., Rabbi, M., Chittaranjan, G. T., Frauendorfer, D.,
Mast, M. S., Campbell, A. T., Gatica-Perez, D., &
Choudhury, T. (2012). StressSense: Detecting stress in
unconstrained acoustic environments using
smartphones. UbiComp’12 - Proceedings of the 2012
ACM Conference on Ubiquitous Computing, 351–360.
https://doi.org/10.1145/2370216.2370270
Maxhuni, A., Hernandez-Leal, P., Morales, E., & Sucar, E.
(2017). Using Intermediate Models and Knowledge
Learning to Improve Stress Prediction. 2, 189.
https://doi.org/10.1007/978-3-319-49622-1
ICT4AWE 2022 - 8th International Conference on Information and Communication Technologies for Ageing Well and e-Health
242

National Center for Biotechnology Information. (2005).
STRESS AND HEALTH: Psychological, Behavioral,
and Biological Determinants. https://www.ncbi.nlm.
nih.gov/pmc/articles/PMC2568977/
Nishikawa, T., Hashimoto, Y., Minami, K., Watanuki, K.,
Kaede, K., & Muramatsu, K. (2019). Examination of
the brain areas related to cognitive performance during
the stroop task using deep neural network. In Advances
in Intelligent Systems and Computing (Vol. 774).
Springer International Publishing.
https://doi.org/10.1007/978-3-319-94944-4_11
Omg. (2008). Software & Systems Process Engineering
Meta-Model Specification V2.0. April, 236.
http://www.omg.org/spec/SPEM/2.0/PDF
Orrù, G., Monaro, M., Conversano, C., Gemignani, A., &
Sartori, G. (2020). Machine learning in psychometrics
and psychological research. Frontiers in Psychology,
10(January), 1–10. https://doi.org/10.3389/fpsyg.20
19.02970
Prado, D., Cedillo, P., & Cordova, F. (2021). Improving
Cognitive Functions in Older People: Stroop Task
Solution. Advances in Intelligent Systems and
Computing. https://doi.org/https://doi.org/10.1007/9
78-3-030-73103-8_64
Rincón, J. (2019). Relación de respuestas psicosomáticas y
emocionales con los niveles de estrés laboral en
funcionarios públicos: Un estudio transversal en el
Instituto Colombiano de Bienestar Familiar Regional
Antioquia en el año 2019. Universidad de San
Buenaventura Colombia, 2–39.
Ruiz-Rube, I., Dodero, J. M., Palomo-Duarte, M., Ruiz, M.,
& Gawn, D. (2013). Uses and applications of Software
& Systems Process Engineering Meta-Model process
models. A systematic mapping study. Journal of
Software: Evolution and Process, 25(9), 999–1025.
https://doi.org/https://doi.org/10.1002/smr.1594
Scarpina, F., & Tagini, S. (2017). The stroop color and
word test. Frontiers in Psychology, 8(APR), 1–8.
https://doi.org/10.3389/fpsyg.2017.00557
Seid, S., & Pooja. (2019). Road accident data analysis: Data
preprocessing for better model building. Journal of
Computational and Theoretical Nanoscience, 16(9),
4019–4027. https://doi.org/10.1166/jctn.2019.8288
Seo, W., Kim, N., Kim, S., Lee, C., & Park, S. M. (2019).
Deep ECG-respiration network (DeepER net) for
recognizing mental stress. Sensors (Switzerland),
19(13), 1–16. https://doi.org/10.3390/s19133021
Shatte, A. B. R., Hutchinson, D. M., & Teague, S. J. (2019).
Machine learning in mental health: A scoping review of
methods and applications. Psychological Medicine,
49(9), 1426–1448. https://doi.org/10.1017/S003329171
9000151
Srividya, M., Mohanavalli, S., & Bhalaji, N. (2018).
Behavioral Modeling for Mental Health using Machine
Learning Algorithms. Journal of Medical Systems,
42(5). https://doi.org/10.1007/s10916-018-0934-5
Stroop, J. R. (1935). Studies of interference in serial verbal
reactions. Journal of Experimental Psychology, 18(6),
643–662. https://doi.org/10.1037/h0054651
Szabo, S., Tache, Y., & Somogyi, A. (2012). The legacy of
Hans Selye and the origins of stress research: A
retrospective 75 years after his landmark brief “letter”
to the Editor# of Nature. Stress, 15(5), 472–478.
https://doi.org/10.3109/10253890.2012.710919
Tulen, J. H. M., Moleman, P., van Steenis, H. G., &
Boomsma, F. (1989). Characterization of stress
reactions to the Stroop Color Word Test.
Pharmacology, Biochemistry and Behavior, 32(1), 9–
15. https://doi.org/10.1016/0091-3057(89)90204-9
van Maanen, L., van Rijn, H., & Borst, J. P. (2009). Stroop
and picture-word interference are two sides of the same
coin. Psychonomic Bulletin and Review, 16(6), 987–
999. https://doi.org/10.3758/PBR.16.6.987
Wu, D., Courtney, C. G., Lance, B. J., Narayanan, S. S.,
Dawson, M. E., Oie, K. S., & Parsons, T. D. (2010).
Optimal arousal identification and classification for
affective computing using physiological signals:
Virtual reality stroop task. IEEE Transactions on
Affective Computing, 1(2), 109–118.
https://doi.org/10.1109/T-AFFC.2010.12
Xu, Q., Nwe, T. L., & Guan, C. (2015). Cluster-Based
Analysis for Personalized Stress. Ieee Journal of
Biomedical and Health Informatics, 19(1), 275–281.
Yarkoni, T., & Westfall, J. (2017). Choosing Prediction
Over Explanation in Psychology: Lessons From
Machine Learning. Perspectives on Psychological
Science, 12(6), 1100–1122. https://doi.org/10.1177/
1745691617693393
Yuan, C., & Yang, H. (2019). Research on K-Value
Selection Method of K-Means Clustering Algorithm. J,
2(2), 226–235. https://doi.org/10.3390/j2020016
Analysis of Psychological Test Data by using K-means Method
243
