
Vocabulary Volume: A New Metric for Assessing Vocabulary Knowledge
Dolc¸a Tellols
1
, Takenobu Tokunaga
1 a
and Hikaru Yokono
2 b
1
School of Computing, Tokyo Institute of Technology, Tokyo, Meguro,
ˆ
Ookayama 2-12-1, Japan
2
School of Information Science, Meisei University, Tokyo, Hino-shi, Hodokubo 2-1-1, Japan
Keywords:
Vocabulary Assessment, Vocabulary Volume, Word Difficulty, Semantic Diversity, Natural Language
Processing, Word Embedding.
Abstract:
This paper presents Vocabulary Volume, a new metric to assess vocabulary knowledge. The existing metrics for
vocabulary knowledge assessment rely on word difficulty, which is often defined in terms of the use frequency
of words. In addition to word difficulty, our proposed metrics consider the semantic diversity of words. To
formalise semantic diversity, every word is transformed into a vector representation in the semantic space by
using the word embedding techniques developed in the natural language processing research. The semantic
diversity is defined as the volume of a convex hull that covers all points corresponding to the words. The
Vocabulary Volume score (VVS) is calculated from both semantic diversity and word difficulty. To prove
the validity of our proposed metric, we conducted experiments using data gathered from Japanese language
learners and native Japanese speakers. The experiments explored various options for each component in
calculating VVS: word embeddings, dimension reduction methods, and word difficulty scale. The metric was
evaluated by distinguishing between the learners’ responses with different levels of language proficiency. The
experimental results suggested the best configuration of the components and showed that our proposed metric
is better than an existing metric that considers only word difficulty.
1 INTRODUCTION
Second language (L2) learning and language abil-
ity assessment have gained researchers’ attention in
many fields. In particular, there is an increas-
ing interest from the Artificial Intelligence (AI) re-
search community due to the possibility of develop-
ing Intelligent Computer-Assisted Language Learn-
ing (ICALL) tools (Meurers and Dickinson, 2017)
and using Natural Language Processing (NLP) tech-
niques to enhance the learning experience.
When assessing language proficiency, vocabulary
is an important aspect to consider. Vocabulary knowl-
edge is further divided into receptive and productive
vocabulary (Laufer and Nation, 1999; Webb, 2008;
Henriksen, 1999; Schmitt, 2014; Nation, 2001; Read,
2000). Receptive vocabulary is the lexicon we use to
understand texts and utterances, while productive vo-
cabulary is the lexicon we use to express ourselves
through writing and speaking.
Tests and metrics designed to assess vocabulary
typically aim at estimating the size of language learn-
a
https://orcid.org/0000-0002-1399-9517
b
https://orcid.org/0000-0001-8517-9051
ers’ vocabulary. Most of the existing metrics for vo-
cabulary size calculate a score based on a sample of
words known by the learner and their word difficulty.
The word difficulty is often determined by their use
frequency in a large corpus. Use frequencies are com-
monly adopted with the hypothesis that more frequent
words are easier to learn; therefore, learners learn
those words first. Consequently, it is assumed that
learners who know words with a particular difficulty
also know more difficult words.
In addition to word difficulty, this research intro-
duces a different aspect, semantic diversity, for as-
sessing vocabulary knowledge. This aspect has been
taken into consideration before when evaluating text
cohesion and readability using techniques like Latent
Semantic Analysis (Graesser et al., 2004). In formal-
ising semantic diversity, we employ the word embed-
ding techniques developed in the NLP research field
to convert words into vectors represented as points in
the semantic space. A close distance between words
(points) in the space means they have a similar mean-
ing. The semantic diversity is determined by the ex-
panses of sampled words in the semantic space. Our
proposing metric, Vocabulary Volume, considers both
56
Tellols, D., Tokunaga, T. and Yokono, H.
Vocabulary Volume: A New Metric for Assessing Vocabulary Knowledge.
DOI: 10.5220/0011046300003182
In Proceedings of the 14th International Conference on Computer Supported Education (CSEDU 2022) - Volume 2, pages 56-65
ISBN: 978-989-758-562-3; ISSN: 2184-5026
Copyright
c
2022 by SCITEPRESS – Science and Technology Publications, Lda. All rights reserved

frequency-based word difficulty and semantic diver-
sity of the sampled words.
After reviewing existing tests and metrics estimat-
ing vocabulary size (Section 2), we introduce a new
metric, Vocabulary Volume, with its score calculation
procedure (Section 3). To prove that Vocabulary Vol-
ume is valid to assess vocabulary knowledge, we per-
form an extensive analysis using data from Japanese
language learners and native speakers gathered using
a test to assess free productive vocabulary (Section 4).
2 RELATED WORK
There exist numerous tests and metrics aimed at es-
timating language learners’ vocabulary knowledge,
more specifically, the vocabulary size, i.e. how many
words they know. The Vocabulary Levels Test (Na-
tion, 1983) is one of the standard tests for assess-
ing receptive vocabulary knowledge. This test tar-
gets the English language and has five receptive vo-
cabulary knowledge levels defined based on the word
frequency bands. Each level has six sections, and in
each section, learners are presented with six words
and three definitions, and they have to answer a cor-
responding word for each of the three definitions.
Through level-wise investigation, we obtain more in-
sightful information about the student knowledge and
what vocabulary level should be studied more. More
recently, revisions of this test have also been pub-
lished (Schmitt et al., 2001).
Another well-known test is Meara’s Eurocentres
Vocabulary Size Test (Meara and Jones, 1988), also
known as the Yes/No Vocabulary Test because of its
format. This test also targets English and attempts
to measure the total vocabulary size and estimates it
by asking learners if they know or not certain words
which could be real or imaginary (distractors). The
test also presents words in a particular order consid-
ering frequency bands and uses all the gathered re-
sponses to estimate a score representing their recep-
tive vocabulary knowledge.
More recently, there have also been new proposals
such as the Vocabulary Size Test (Beglar and Nation,
2007), another test to measure the written receptive
vocabulary size of English learners and natives. It is
a multiple-choice test where test-takers are presented
with different sentences. Each sentence contains a tar-
get word from a particular frequency band, and learn-
ers have to choose the most appropriate meaning of
the word according to its context from four different
options. The original version of the test attempts to
assess knowledge of the most frequent 14,000 words.
It has 140 items, and the points obtained for each cor-
rect item need to be multiplied by 100 to get their total
receptive vocabulary size.
Regarding tests assessing productive vocabulary,
standards are still unclear, and new ideas for tests and
metrics keep arising. These tests can focus on the con-
trolled or free abilities (Laufer and Paribakht, 1998;
Laufer and Nation, 1999). Tests assessing controlled
productive vocabulary have questions that expect re-
stricted responses. In contrast, tests for free produc-
tive vocabulary need to use question items that less
constrain test takers’ responses, as their free will is
emphasised.
Controlled productive vocabulary tests include the
Productive Vocabulary Levels Test (PVLT) (Laufer
and Nation, 1999), which is based on sentence
completion tasks-
1
, and the Productive Vocabulary
Knowledge Test (VKT) (Koizumi, 2003), based on
translation tasks and designed for novice Japanese
learners of English.
On the other hand, the most representative tests
and metrics assessing free productive vocabulary are
the Lexical frequency profile (LFP) (Laufer and Na-
tion, 1995) and Lex30 (Meara and Fitzpatrick, 2000).
Lexical frequency profile (LFP) (Laufer and Na-
tion, 1995) is a metric representing the size of free
productive vocabulary as the distribution of words at
four different frequency bands. For measuring LFP,
test takers are typically asked to write two English
compositions on different topics with 300 or more
words
2
.
Lex30 (Meara and Fitzpatrick, 2000) is a test
to estimate English free productive vocabulary size
based on a word association task. Given a stimulus
word, test takers are instructed to write words that first
come to their minds (three words in the initial version
and at most four in recent ones (Fitzpatrick and Clen-
ton, 2017; Gonz
´
alez and P
´
ıriz, 2016)). For instance,
given the stimulus word “music,” a test taker might re-
spond with “concert,” “instrument,” “harmony,” and
“artist.” The test has 30 stimuli presented one at a
time, and test takers have 30 seconds to write down
words for each of them. The amount of less common
terms in the responses is counted by Lex30 to deter-
mine its score.
More recently, there have been other proposals to
estimate vocabulary size. P Lex (Meara and Bell,
2001) is a metric that generates an index represent-
ing how likely unusual words occur in learners’ text.
(Dong et al., 2010) provided a metric generated by
creating the weighted fusion of two components us-
1
The test targeting English can be performed online:
https://lextutor.ca/tests/levels/productive/
2
Online tools like VocabProfiler (https://lextutor.ca/vp)
can calculate English LFP from lexical input.
Vocabulary Volume: A New Metric for Assessing Vocabulary Knowledge
57

ing the Sugeno measure (Sugeno, 1975). Those two
components are the lexical frequency profile (sim-
plified to only consider the value of the third fre-
quency band), and lexical richness (measured through
the type-token ratio). And other researchers proposed
tests that attempted to estimate free productive vo-
cabulary size and used formulas from the capture-
recapture method, which is typically used in ecol-
ogy for estimating animal populations, to estimate
it (Meara and Alcoy, 2010; Alcoy, 2013).
The present work proposes Vocabulary Volume, a
new metric that aims to assess vocabulary knowledge
considering not only word difficulty but also the se-
mantic diversity of words. Vocabulary Volume can
apply to both receptive and productive vocabulary as-
sessment.
3 VOCABULARY VOLUME
Vocabulary Volume is a metric representing vocabu-
lary knowledge that considers two different aspects:
word difficulty and semantic diversity. Word diffi-
culty is the base to approximate vocabulary size in
most existing tests and metrics. It has widely been
considered through word frequencies under the hy-
pothesis that more frequent words are learned ear-
lier (Gonz
´
alez and P
´
ıriz, 2016) and are considered
to be “easier”. Thus we consider that a learner who
knows more difficult words has a more extensive vo-
cabulary size.
The second aspect, semantic diversity, represents
how words in the learner’s vocabulary are semanti-
cally distant from each other. This aspect concerns the
semantic expanses of words in the vocabulary in terms
of the semantic space. Existing metrics on vocabulary
assessment only concern the first aspect. Therefore,
introducing the second one is our main contribution.
Having a metric that provides a score from these two
aspects is important because it represents how “wide”
is the vocabulary knowledge of people in terms of top-
ics that can be covered, and also how “complex” it is
in terms of the difficulty of the words being used.
In the recent NLP research, representing words as
high dimensional numerical vectors, also referred to
as word embeddings, is a common trend (Mikolov
et al., 2013; Peters et al., 2018; Devlin et al., 2019;
Grave et al., 2018).
As Figure 1 illustrates, a word (w
i
) can be repre-
sented as a numerical vector equivalent to the point
of a multi-dimensional space where the distance be-
tween the points (words) corresponds to their seman-
tic similarity. A closer distance indicates a more sim-
ilar meaning. Our proposed metric uses the idea that
!
"
!
#
!
$
!
%
Semantic distance
Figure 1: Representation of a word as a numerical vector,
i.e. a point of a multi-dimensional space.
the more spread the points are in the space, the more
semantic diversity is achieved.
To convert the word vector representation idea
into a score, we use the volume of their convex hull.
In geometry, the convex hull of a set of vectors is the
smallest convex set that contains it. And other re-
searchers have already made use of it to create poly-
gons representing the semantic area that students ex-
plored with responses in a test studying word meaning
relationships (Nam et al., 2017).
!
"
!
#
Semantic diversity plane
!
$
!
%
Figure 2: Word vector dimensionality reduction.
Word vector representations are usually high-
dimensional. For our purpose, this is problematic
because the minimum number of vectors (words)
needed to calculate the convex hull will be the di-
mension of the vectors plus one. The larger the di-
mension, the more words are needed to calculate the
metric score, and it is desirable to reduce this number
so that short tests can be used to gather the necessary
data. Consequently, after calculating the numerical
vector representations for each word sampled from
the learner, we need to reduce the dimensionality of
these vectors to a reasonable size. To do this, multiple
techniques are available (Zubova et al., 2018). Fig-
ure 2 shows an example where the vector dimension
has been reduced to size two, so we would have all
sampled words represented in a 2-dimensional plane
where similar words are placed closer.
As mentioned in our metric definition, we also
want Vocabulary Volume to consider word difficulty,
and that is why we propose to include it as an extra di-
mension of the word vector representations. This nu-
merical value could correspond, for example, to word
frequencies or word levels.
To capture word difficulty in addition to the se-
mantic diversity dimensions, we keep the (n − 1)-
dimension word vectors (w
i
) in the semantic diversity
CSEDU 2022 - 14th International Conference on Computer Supported Education
58
!
"
!
#
!
#
!
$
!
%
Semantic diversity plane
Word difficulty dimension
!
"
!
$
!
%
Figure 3: Adding the word difficulty dimension to the word
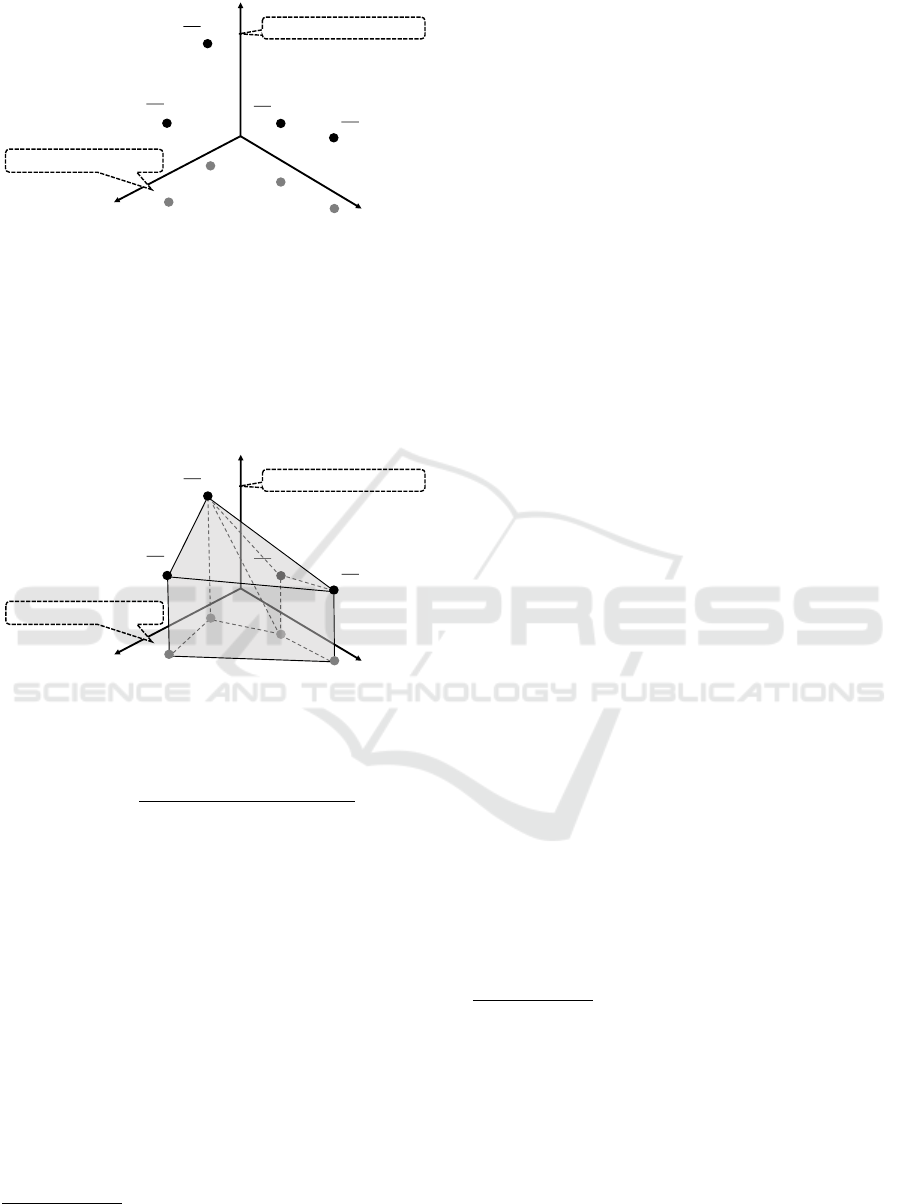
vector representations.
plane and add the difficulty dimension to a duplicate
in order to make an n-dimension vector ( ¯w
1
). Figure 3
illustrates this idea
3
. Mathematically, w
i
are the pro-
jections of the n dimension vector ¯w
i
to the semantic
diversity plane represented by the first n − 1 dimen-
sions.
Word difficulty dimension
!
"
!
"
!
#
!
#
!
$
!
%
Semantic diversity plane
!
$
!
%
Figure 4: Graphical representation of Vocabulary Volume
in a space of dimension 3. ¯w are the projections of w on the
semantic diversity plane.
VVS =
CHV(w
1
, ..., w
n
, ¯w
1
, ..., ¯w
n
)
n
(1)
Then, the convex hull of the resulting vectors is
generated. Its volume is calculated as illustrated in
Figure 4. Normalising the volume by the number of
words being considered, results in a Vocabulary Vol-
ume score (VVS) as given in Equation (1), where
CHV() returns the internal volume of the convex hull
given a set of points (w
1
, ..., w
n
, ¯w
1
, ..., ¯w
n
) as its argu-
ment. VVS will be a positive numerical value.
All in all, we hypothesise that the larger the vol-
ume of the convex hull generated from word vector
representations of a set of sampled words from a per-
son, the larger their vocabulary knowledge concern-
ing semantic diversity will be.
3
w
i
in Figure 3 is an n-dimensional vector with the n-th
dimension being zero.
4 VALIDATING VOCABULARY
VOLUME
We evaluate the proposed Vocabulary Volume metric
through experiments. The research questions we an-
swer through the experiments are as follows.
RQ1: Is the Vocabulary Volume metric valid to assess
vocabulary knowledge?
RQ2: What is the impact of introducing semantic
diversity when assessing vocabulary knowl-
edge?, i.e. a comparison between a metric
based only on word difficulty and our Vocab-
ulary Volume metric.
RQ3: How do the combinations of different tech-
niques for calculating the Vocabulary Volume
metric affect the evaluation results?
4.1 Experimental Setting
4.1.1 Data and Preprocessing
The data used in the experiment was gathered through
a test aiming to assess free productive vocabulary
knowledge, and the target language was Japanese.
Test takers are sixteen university students, including
two native Japanese speakers and fourteen learners
with various mother tongues. They were classified
into superlative (SUP), advanced (ADV), intermediate
(INT) and basic (BAS) levels according to a Japanese
language class-placement test used at their univer-
sity
4
. We evaluate the validity of metrics by investi-
gating to what degree they distinguish responses from
test takers at adjacent levels.
Pic2PLex, the test we used, aims to elicit test tak-
ers’ responses to assess their free productive vocabu-
lary using sets of pictures as stimuli. A test item con-
sists of six pictures with a common theme and two
answer sections: a ten-word section and a description
section. Given a picture set, test takers are instructed
to write ten words that come to their minds and a brief
description of their sight in at least ten words
5
in the
corresponding sections. Figure 5 shows a fabricated
Pic2PLex item with a possible response
6
. Participants
4
According to the university, the basic level would be
equivalent to CEFR A1-A2 or JLPT N5-N4, intermediate
level to CEFR A2+-B2 or JLPT N4-N2, and advanced level
to CEFR B2-B2+ or JLPT N2. Superlative level equiva-
lence is not specified, but learners at that level are supposed
to have a proficiency close to that of native speakers (all our
superlative level participants passed JLPT N1).
5
The description length may be subject to the target lan-
guage. In this data, test-takers are instructed to write at least
20 Japanese characters.
6
The pictures are from the MS-COCO dataset (Lin
et al., 2014).
Vocabulary Volume: A New Metric for Assessing Vocabulary Knowledge
59

Answer (words coming to mind):
eee7.166
eee48
eee690
eee.2
eede65
e(ee9
e)ee98
eee31
eee.65
ee89e81
Answer (description):
IabIc
d
e4e48482e80e49e1961e1e65482e
48e31e4e43e7.166e80e.2
Picture set (stimulus):
Figure 5: Fabricated Pic2PLex item with Japanese re-
sponses and their English translation.
answered to the test items remotely using a web ap-
plication that they could access with their computers.
To tokenise the responses at the word level, we
used a Japanese morphological analyser, MeCab,
with the UniDic dictionary
7
and removed non-content
words. As MeCab tends to divide compound words
into its components, we recover the compounds if
consecutive words make a compound which is found
in the Balanced Corpus of Contemporary Written
Japanese (BCCWJ) (Maekawa et al., 2014)’s long
unit or short unit vocabulary tables
8
.
4.1.2 Calculating Vocabulary Volume Score
We tested multiple configurations of techniques to
calculate the Vocabulary Volume score (VVS). The
components for the configuration are described in the
following subsections.
Word Embeddings. To obtain word vector repre-
sentations, also known as word embeddings, we used
two pre-trained models based on static word embed-
dings (FastText and chiVe) and one based on contex-
tualised word embeddings (BERT). The latter consid-
ers the context of the target word when generating the
7
https://unidic.ninjal.ac.jp
8
https://pj.ninjal.ac.jp/corpus center/bccwj/freq-list.
html
vector representation. Therefore, the vector represen-
tation of a word can be different depending on its sur-
rounding context in the text.
• FastText: The pre-trained Japanese FastText
word embeddings (Grave et al., 2018) trained us-
ing Continuous Bag Of Words (CBOW) and data
from Common Crawl and Wikipedia
9
. These vec-
tors have dimension 300.
• chiVe: The pre-trained Japanese word embed-
dings trained using the skip-gram algorithm,
word2vec (Mikolov et al., 2013), and a large-scale
corpus (Manabe et al., 2019)
10
. These vectors
have dimension 300.
• BERT: The BERT model (Devlin et al., 2019)
pre-trained on Japanese Wikipedia
11
. BERT’s to-
keniser divides each input into subtokens, which
are smaller units than words. To obtain the em-
bedding of each input word, we average the em-
beddings of the subtokens forming the word. The
dimension of the vectors is 768.
In all cases, we transformed words into vector repre-
sentations individually after performing the tokenisa-
tion explained above.
Dimension Reduction. To reduce the dimension-
ality of the obtained embeddings, we used scikit-
learn (Pedregosa et al., 2011)
12
implementation of
Principal Component Analysis (PCA), Independent
Component Analysis (ICA) and Isomap Embedding
(ISO). PCA and ICA are linear methods, while ISO is
non-linear. We also considered reducing the dimen-
sion of the obtained word vectors to sizes two, three
and four. These are the dimension of the semantic
diversity hyperplane.
Word Difficulty. We add a dimension for word dif-
ficulty to the dimension-reduced word embeddings
(semantic diversity plane). Word difficulty is repre-
sented by an integer number.
The first option for word difficulty is the frequency
rank generated using Balanced Corpus of Contem-
porary Written Japanese (BCCWJ) (Maekawa et al.,
2014)’s long unit or short unit vocabulary tables
13
.
9
https://fasttext.cc/docs/en/crawl-vectors.html
10
https://github.com/WorksApplications/chiVe
11
https://huggingface.co/cl-tohoku/bert-base-japanese-
whole-word-masking
12
https://scikit-learn.org
13
https://pj.ninjal.ac.jp/corpus center/bccwj/freq-list.
html. For each word, we considered all writ-
ing variants (Hiragana, Katakana, and Kanji, if
available) by utilising Python Pykakasi library
CSEDU 2022 - 14th International Conference on Computer Supported Education
60

There are 5,061 different ranks, from 1 being the eas-
iest to 5,061 being the most difficult. We discard
words not found in the BCCWJ frequency lists. The
percentage of such unknown words is 2.13% of the to-
tal. Some of these words are misspellings, and others
are new expressions. There are also correctly written
words using a combination of characters not consid-
ered in the BCCWJ lists.
The second option was to use word levels based
on the Japanese Language Proficiency Test (JLPT)
14
.
The JLPT has five levels (N1 being the most difficult
and N5 the easiest). Consequently, we used six inte-
gers to indicate each word’s level (1 for N5 words, 5
for N1 words and 6 for words outside of the JLPT lists
but present in the BCCWJ frequency lists). 18.34% of
the words in test takers’ responses are in the BCCWJ
lists but not in the JLPT lists. Most of them are above
the rank 4,000 in the frequency ranked lists.
Convex Hull Volume. To generate the convex hull
of the resulting vectors and to calculate its volume,
we used scipy’s implementation
15
.
4.2 Assessing the Validity of Vocabulary
Volume on Various Configurations
(RQ1, RQ3)
To investigate the validity of the proposed Vocabu-
lary Volume metric, we analysed if it can discern re-
sponses from the test takers at different levels. We
calculated VVS using the different combination of
component techniques discussed in Section 4.1.2 and
compared the p-values of the Wilcoxon statistical sig-
nificance test in discerning responses between ad-
jacent levels. Table 1 recaps the components and
their options for calculating VVS. As for the reduced
dimension size of the semantic diversity plane, we
adopted two, three and four dimensions in this ex-
periment. Dimensionality reduction algorithms were
fitted with word embeddings from all responses.
Table 1: Components and their options for calculating VVS.
Component Options
Embedding FastText chiVe BERT
Dim. reduction PCA ICA ISO
Reduced dim. 2 3 4
Word difficulty freq. rank JLPT level
(https://github.com/miurahr/pykakasi) to get the Hira-
gana form when not in the frequency lists.
14
The levelled vocabulary lists is available at http://
www.tanos.co.uk/jlpt/
15
https://docs.scipy.org/doc/scipy/reference/generated/
scipy.spatial.ConvexHull.html
Table 2: Significance results in discerning responses be-
tween adjacent levels (Word difficulty = frequency rank).
Dim. reduction PCA ICA ISO
Reduced dim. 2 3 4 2 3 4 2 3 4
Levels Embedding = FastText
BAS-INT ∗∗ ∗∗ ∗∗ ∗∗ ∗∗ ∗∗ ∗∗ ∗∗ ∗
INT-ADV ∗∗ ∗∗ ∗∗ ∗∗ ∗ ∗∗
ADV-SUP ∗∗ ∗∗
SUP-NAT ∗ ∗ ∗∗ ∗ ∗
Levels Embedding = chiVe
BAS-INT ∗ ∗
INT-ADV ∗∗ ∗∗ ∗∗ ∗∗ ∗∗
ADV-SUP ∗ ∗∗ ∗ ∗∗
SUP-NAT
Levels Embedding = BERT
BAS-INT ∗∗ ∗ ∗ ∗∗ ∗ ∗
INT-ADV ∗∗ ∗∗ ∗∗ ∗∗ ∗ ∗∗ ∗∗
ADV-SUP ∗ ∗ ∗ ∗
SUP-NAT ∗∗ ∗∗ ∗∗ ∗∗ ∗∗ ∗∗
∗∗: p-value<0.01 ∗ : p-value<0.05
Table 3: Significance results in discerning responses be-
tween adjacent levels (Word difficulty = JLPT level).
Dim. reduction PCA ICA ISO
Reduced dim. 2 3 4 2 3 4 2 3 4
Levels Embedding = FastText
BAS-INT ∗∗ ∗∗ ∗∗ ∗∗ ∗∗ ∗∗ ∗∗ ∗ ∗
INT-ADV ∗ ∗ ∗∗ ∗ ∗ ∗∗ ∗∗
ADV-SUP ∗∗ ∗∗
SUP-NAT ∗ ∗ ∗∗ ∗ ∗∗
Levels Embedding = chiVe
BAS-INT
INT-ADV ∗∗ ∗∗ ∗∗ ∗∗
ADV-SUP ∗ ∗ ∗ ∗
SUP-NAT
Levels Embedding = BERT
BAS-INT ∗∗ ∗∗ ∗ ∗ ∗
INT-ADV ∗∗ ∗∗ ∗∗ ∗∗ ∗∗ ∗∗
ADV-SUP ∗ ∗ ∗ ∗
SUP-NAT ∗∗ ∗∗ ∗∗ ∗∗ ∗∗ ∗∗
∗∗: p-value<0.01 ∗ : p-value<0.05
Table 2 and 3 illustrate the significance results
in discerning responses between the adjacent lev-
els using the frequency rank and the JLPT levels as
word difficulty, respectively. The asterisks mean that
the metric calculated with the configuration shows a
statistically significant difference between responses
from adjacent levels: ∗∗ at p-value < 0.01 and ∗ at
p-value < 0.05. For readers’ convenience to compare
Table 2 and 3, we underscore the asterisks when their
significance level is superior to the corresponding
Vocabulary Volume: A New Metric for Assessing Vocabulary Knowledge
61

counterpart in the other table. By counting the under-
scored asterisks, we found that frequency rank works
better than the JLPT level for representing word diffi-
culty.
Increasing the reduced dimension size of the se-
mantic diversity plane generally improves the perfor-
mance. It is difficult to see a clear difference between
the dimension size three and four from the table,
but most of the p-values of the dimension size four
are smaller than those of the dimension size three.
Therefore, we conclude that we should adopt four-
dimension for the semantic diversity plane. Investi-
gating the effect of further increasing dimension size
is future work.
PCA and ICA show a similar result, but ISO tends
to be inferior to the others. We would adopt PCA
or ICA for the dimension reduction algorithm for the
semantic diversity plane.
BERT is the only word embedding model that
can distinguish responses between all adjacent levels.
Therefore we suggest adopting BERT for the word
embedding model.
To obtain the BERT embedding of a word, we
input to the BERT model the tokenised words one
by one without their surrounding context. However,
BERT was initially designed for obtaining a contex-
tualised word embedding by inputting a word with
its surrounding context. In this respect, our usage
of BERT might not fully utilise the BERT advantage.
We took such a word-by-word input strategy for the
BERT embedding because we have no textual con-
text for the individual response word in the ten-word
section of the Pic2PLex question items. As we have
a short description by the test takers in the descrip-
tion section of the Pic2PLex items, we conducted the
follow-up experiments comparing the following three
BERT embedding variations.
(i) word-by-word embedding of words in the ten-
word section and individual content words in the
description section (This is the same as the BERT
embedding used in the above experiment.)
(ii) word-by-word embedding of words in the ten-
word section and contextualised embedding of in-
dividual content words in the description section
(iii) only contextualised embedding of individual con-
tent words in the description section
Table 4 and 5 illustrate the significance results of
the BERT embedding variations using the frequency
rank and the JLPT levels as word difficulty, respec-
tively. Comparing (i) and (ii), we find that introduc-
ing contextualised embeddings is not effective for our
current purpose. The contextualised embedding maps
a word to the different points in the semantic space
Table 4: Significance results in discerning responses be-
tween adjacent levels with various BERT usage (Word dif-
ficulty = frequency rank).
Dim. Reduct. PCA ICA ISO
Reduced dim. 2 3 4 2 3 4 2 3 4
Embedding (i) 10-word (w-by-w) and
description (w-by-w)
BAS-INT ∗∗ ∗ ∗ ∗∗ ∗ ∗
INT-ADV ∗∗ ∗∗ ∗∗ ∗∗ ∗ ∗∗ ∗∗
ADV-SUP ∗ ∗ ∗ ∗
SUP-NAT ∗∗ ∗∗ ∗∗ ∗∗ ∗∗ ∗∗
Embedding (ii) 10-word (w-by-w) and
description (contexualised)
BAS-INT ∗∗ ∗ ∗∗ ∗∗ ∗ ∗∗ ∗∗ ∗∗ ∗∗
INT-ADV ∗∗ ∗∗ ∗∗ ∗∗ ∗∗ ∗∗
ADV-SUP
SUP-NAT
Embedding (iii) description (contextualised)
BAS-INT ∗∗ ∗ ∗∗ ∗ ∗∗ ∗∗ ∗∗
INT-ADV ∗∗ ∗∗ ∗∗ ∗∗ ∗∗ ∗∗
ADV-SUP
SUP-NAT
∗∗: p-value<0.01 ∗ : p-value<0.05
Table 5: Significance results in discerning responses be-
tween adjacent levels with various BERT usage (Word dif-
ficulty = JLPT level).
Dim. Reduct. PCA ICA ISO
Reduced dim. 2 3 4 2 3 4 2 3 4
Embedding (i) 10-word (w-by-w) and
description (w-by-w)
BAS-INT ∗∗ ∗∗ ∗ ∗ ∗
INT-ADV ∗∗ ∗∗ ∗∗ ∗∗ ∗∗ ∗∗
ADV-SUP ∗ ∗ ∗ ∗
SUP-NAT ∗∗ ∗∗ ∗∗ ∗∗ ∗∗ ∗∗
Embedding (ii) 10-word (w-by-w) and
description (contexualised)
BAS-INT ∗∗ ∗∗ ∗∗ ∗∗ ∗∗ ∗∗ ∗
INT-ADV ∗ ∗∗ ∗∗ ∗ ∗∗ ∗∗ ∗ ∗∗
ADV-SUP
SUP-NAT
Embedding (iii) description (contextualised)
BAS-INT ∗∗ ∗∗ ∗∗ ∗
INT-ADV ∗∗ ∗∗ ∗∗ ∗∗ ∗∗ ∗∗
ADV-SUP
SUP-NAT
∗∗: p-value<0.01 ∗ : p-value<0.05
depending on its context. Therefore, the same word
can correspond to different points across the test tak-
ers’ responses. This also applies to the words in a sin-
gle test taker response because a word in the ten-word
section (where there is no surrounding context) and
CSEDU 2022 - 14th International Conference on Computer Supported Education
62

Table 6: Response-wise average Vocabulary Volume scores (VVS) and Lex30.
Level #responses VVS (SD) Lex30 (SD)
BAS 73 73,639 (71,438)
]
*
4.34 (2.08)
]
*
INT 88 94,563 (82,627)
]
**
4.97 (1.78)
]
**
ADV 55 199,192 (126,747)
]
*
9.02 (3.07)
]
**
SUP 38 256,382 (131,492)
]
**
10.71 (1.84)
NAT 40 331,757 (132,331) 9.93 (3.70)
∗∗: p-value<0.01 ∗ : p-value<0.05
configuration: BERT word-by-word embedding, PCA dim. 4, freq. rank
the same word used in the description section (where
there is surrounding context) of a test taker response
might be mapped to the different points in the seman-
tic space. Therefore, the mapping criteria is different
between words in the ten-word section and those in
the description section. We suspect this difference of
embeddings makes the mapping from words to points
in the semantic space inconsistent. In this respect,
embedding (iii) is consistent because it is always con-
textualised. However, embedding (iii) degrades the
discrimination ability, which is understandable be-
cause we use fewer responses, i.e. responses from the
ten-word section are not contemplated. Overall, the
best results are obtained using BERT with a word-by-
word embedding, reducing the embeddings to dimen-
sion size 4 by PCA or ICA, and using the frequency
rank as word difficulty.
The VVS column of Table 6 shows the scores
obtained by the best performing configuration (using
PCA for dimensionality reduction). These results in-
dicate that our proposed Vocabulary Volume metric is
valid to distinguish responses from different-level test
takers.
Table 7: Test taker-wise Average Vocabulary Volume scores
(VVS).
Level #test takers VVS (SD)
BAS 4 132,554 (20,578)
INT 5 171,626 (45,636)
ADV 3 143,629 (11,180)
SUP 2 152,010 (39,250)
NAT 2 129,823 (34,504)
To see if VVS could also differentiate test takers at
different levels, we averaged the Vocabulary Volume
scores across the test takers at the same level, i.e. the
test taker-basis macro average. Table 7 shows that the
averaged VVS tend to increase except for intermedi-
ate learners and native speakers. We did not perform a
statistical significance test due to an insufficient num-
ber of test takers. A larger sample of participants is
necessary to verify if VVS can classify test takers ac-
cording to their level.
4.3 Impact of Introducing Semantic
Diversity (RQ2)
To study the effect of introducing the semantic di-
versity aspect, we compare VVS with the frequency-
based metric that is used in the Lex30 test (Meara and
Fitzpatrick, 2000). Lex30 is designed to assess free
productive vocabulary knowledge like Pic2PLex. The
score used in Lex30 estimates free productive vocab-
ulary knowledge by counting response words that are
not included in the most 1,000 frequent words of a ref-
erence frequency list. Consequently, the score ranges
from 0 to the maximum number of response words.
We adapted the scoring method to the Japanese lan-
guage by using the BCCWJ frequency list. This met-
ric considers frequency-based word difficulty but not
semantic diversity. In the following, we will refer to
the metric as Lex30. We use the best-performinc con-
figuration for VVS, i.e. BERT with a word by word
embeddings, PCA with dimension size four and the
frequency rank as word difficulty. Table 6 shows the
average scores of VVS and Lex30 for the responses
at each test taker’s level. The numbers in parentheses
denote the standard deviation. The table shows that
Vocabulary Volume can discern responses better than
Lex30. While Vocabulary Volume shows statistically
significant differences between all four adjacent lev-
els, Lex30 fails to distinguish between the superlative
and native levels.
Table 8: Comparison of p-values in differentiating adjacent
level responses using VVS with and without word difficulty
(WD).
Level VVS w/o WD VVS w/ WD
BAS-INT 0.1375 0.0467
INT-ADV 0.0000 0.0000
ADV-SUP 0.0953 0.0123
SUP-NAT 0.0012 0.0041
Additionally, to verify how the word difficulty
dimension enhances semantic diversity information,
we compared the p-values obtained when calculating
VVS with and without word difficulty. Table 8 shows
Vocabulary Volume: A New Metric for Assessing Vocabulary Knowledge
63

that the p-value generally decreases or stays the same
when word difficulty is explicitly added to the word
vectors. A smaller p-value indicates that the differ-
ences between scores at the adjacent levels are more
significant. The only cases where there is an increase
in the p-value was in the Superlative-Native score dif-
ferences. We may get this result because the number
of participants is not enough to appreciate a differ-
ence. Overall, we showed that introducing semantic
diversity when assessing vocabulary knowledge pos-
itively impacts the results and that word difficulty is
also indispensable.
5 CONCLUSION
This paper presented Vocabulary Volume, a new met-
ric to assess vocabulary knowledge. While the ex-
isting metrics consider only word difficulty, Vocabu-
lary Volume considers the semantic diversity as well
as word difficulty. We formalised the semantic diver-
sity by the volume of a convex hull that covers all
words represented by vectors in the semantic space.
Using data from a test assessing Japanese free produc-
tive vocabulary, we verified that the proposed metric
is valid to assess vocabulary knowledge by showing
it can distinguish learners’ responses with different
proficiency levels. We also confirmed that introduc-
ing semantic diversity into the word vector represen-
tations is effective. After exploring various configu-
rations for calculating the proposed metric, we con-
clude that as far as the data we used, the configuration
that adopts the BERT embeddings, PCA reducing to
dimension size four and frequency ranks as word dif-
ficulty achieves the best results.
In future work, we will evaluate the metric using
data from language learners of other languages than
Japanese and data from more diverse vocabulary as-
sessment tests.
ACKNOWLEDGEMENTS
This work was partially supported by JSPS KAK-
ENHI Grant Number JP19H04167 and JP21K18358.
REFERENCES
Alcoy, J. C. O. (2013). The schnabel method: An ecologi-
cal approach to productive vocabulary size estimation.
International Proceedings of Economics Development
and Research, 68:19–24.
Beglar, D. and Nation, P. (2007). A vocabulary size test.
The Language Teacher, 31(7):9–13.
Devlin, J., Chang, M.-W., Lee, K., and Toutanova, K.
(2019). BERT: Pre-training of deep bidirectional
transformers for language understanding. In Proceed-
ings of the 2019 Conference of the North American
Chapter of the Association for Computational Lin-
guistics: Human Language Technologies, Volume 1
(Long and Short Papers), pages 4171–4186.
Dong, T., Shi, W.-X., and Huang, Y.-H. (2010). A research
on evaluation of written productive vocabulary based
on sugeno measure. In Proceedings of 2010 Interna-
tional Conference on Machine Learning and Cyber-
netics, volume 1, pages 533–536. IEEE.
Fitzpatrick, T. and Clenton, J. (2017). Making sense of
learner performance on tests of productive vocabulary
knowledge. Tesol Quarterly, 51(4):844–867.
Gonz
´
alez, R. A. and P
´
ıriz, A. M. P. (2016). Measuring
the productive vocabulary of secondary school clil stu-
dents: Is Lex30 a valid test for low-level school learn-
ers? Vial-vigo International Journal of Applied Lin-
guistics, pages 31–54.
Graesser, A. C., McNamara, D. S., Louwerse, M. M., and
Cai, Z. (2004). Coh-metrix: Analysis of text on cohe-
sion and language. Behavior Research Methods, In-
struments, & Computers, 36(2):193–202.
Grave, E., Bojanowski, P., Gupta, P., Joulin, A., and
Mikolov, T. (2018). Learning word vectors for
157 languages. In Proceedings of the International
Conference on Language Resources and Evaluation
(LREC 2018), pages 3483–3487.
Henriksen, B. (1999). Three dimensions of vocabulary de-
velopment. Studies in Second Language Acquisition,
21(2):303–317.
Koizumi, R. (2003). A productive vocabulary knowledge
test for novice Japanese learners of English: Validity
and its scoring methods. JABAET Journal, 7:23–52.
Laufer, B. and Nation, P. (1995). Vocabulary size and use:
Lexical richness in L2 written production. Applied
Linguistics, 16(3):307–322.
Laufer, B. and Nation, P. (1999). A vocabulary-size test
of controlled productive ability. Language Testing,
16(1):33–51.
Laufer, B. and Paribakht, T. S. (1998). The relation-
ship between passive and active vocabularies: Ef-
fects of languagelearning context. Language Learn-
ing, 48(3):365–391.
Lin, T.-Y., Maire, M., Belongie, S., Hays, J., Perona, P., Ra-
manan, D., Doll
´
ar, P., and Zitnick, C. L. (2014). Mi-
crosoft COCO: Common objects in context. In Euro-
pean conference on computer vision, pages 740–755.
Springer.
Maekawa, K., Yamazaki, M., Ogiso, T., Maruyama, T.,
Ogura, H., Kashino, W., Koiso, H., Yamaguchi, M.,
Tanaka, M., and Den, Y. (2014). Balanced corpus of
contemporary written Japanese. Language Resources
and Evaluation, 48(2):345–371.
Manabe, H., Oka, T., Umikawa, Y., Takaoka, K., Uchida,
Y., and Asahara, M. (2019). Japanese word distributed
CSEDU 2022 - 14th International Conference on Computer Supported Education
64

expression based on the result of division of multi-
ple particles (translation from japanese). In 25th An-
ual Meeting of The Association for Natural Language
Processing (NLP2019), pages NLP2019–P8–5. The
Association for Natural Language Processing (Japan).
Meara, P. and Bell, H. (2001). P-lex: A simple and effective
way of describing the lexical characteristics of short l2
tests. Prospects, 16:5–19.
Meara, P. and Fitzpatrick, T. (2000). Lex30: An improved
method of assessing productive vocabulary in an l2.
System, 28(1):19–30.
Meara, P. and Jones, G. (1988). Vocabulary Size as a Place-
ment Indicator. In Proceedings of the Annual Meet-
ing of the British Association for Applied Linguistics,
pages 80–87. ERIC.
Meara, P. M. and Alcoy, J. C. O. (2010). Words as
species: An alternative approach to estimating pro-
ductive vocabulary size. Reading in a Foreign Lan-
guage, 22(1):222–236.
Meurers, D. and Dickinson, M. (2017). Evidence and inter-
pretation in language learning research: Opportunities
for collaboration with computational linguistics. Lan-
guage Learning, 67(S1):66–95.
Mikolov, T., Chen, K., Corrado, G., and Dean, J. (2013).
Efficient estimation of word representations in vector
space. In Bengio, Y. and LeCun, Y., editors, Proceed-
ings of the 1st International Conference on Learning
Representations (ICLR).
Nam, S., Frishkoff, G., and Collins-Thompson, K. (2017).
Predicting short-and long-term vocabulary learning
via semantic features of partial word knowledge. In
Proceedings of the 10th International Conference on
Educational Data Mining, pages 80–87.
Nation, I. (2001). Learning Vocabulary in Another Lan-
guage. Cambridge University Press.
Nation, P. (1983). Testing and teaching vocabulary. Guide-
lines, 5:12–25.
Pedregosa, F., Varoquaux, G., Gramfort, A., Michel, V.,
Thirion, B., Grisel, O., Blondel, M., Prettenhofer,
P., Weiss, R., Dubourg, V., Vanderplas, J., Passos,
A., Cournapeau, D., Brucher, M., Perrot, M., and
Duchesnay, E. (2011). Scikit-learn: Machine learning
in Python. Journal of Machine Learning Research,
12:2825–2830.
Peters, M. E., Neumann, M., Iyyer, M., Gardner, M., Clark,
C., Lee, K., and Zettlemoyer, L. (2018). Deep con-
textualized word representations. In Proceedings of
the 2018 Conference of the North American Chapter
of the Association for Computational Linguistics: Hu-
man Language Technologies, Volume 1 (Long Papers),
pages 2227–2237.
Read, J. (2000). Assessing Vocabulary. Cambridge Univer-
sity Press.
Schmitt, N. (2014). Size and depth of vocabulary knowl-
edge: What the research shows. Language Learning,
64(4):913–951.
Schmitt, N., Schmitt, D., and Clapham, C. (2001). Devel-
oping and exploring the behaviour of two new ver-
sions of the vocabulary levels test. Language Testing,
18(1):55–88.
Sugeno, M. (1975). Theory of fuzzy integrals and its appli-
cations. PhD thesis, Tokyo Institute of Technology.
Webb, S. (2008). Receptive and productive vocabulary sizes
of l2 learners. Studies in Second Language Acquisi-
tion, 30(1):79–95.
Zubova, J., Kurasova, O., and Liutvinavi
ˇ
cius, M. (2018).
Dimensionality reduction methods: The comparison
of speed and accuracy. Information Technology And
Control, 47(1):151–160.
Vocabulary Volume: A New Metric for Assessing Vocabulary Knowledge
65
