
Combining Machine Learning and Bayesian Networks for ECG
Interpretation and Explanation
Tezira Wanyana
1,3 a
, Mbithe Nzomo
1,3 b
, C. Sue Price
2,3 c
and Deshendran Moodley
1,3 d
1
University of Cape Town (UCT), Cape Town, South Africa
2
University of KwaZulu-Natal (UKZN), Durban, South Africa
3
Centre for Artificial Intelligence Research (CAIR), South Africa
Keywords:
Agent Architecture, Machine Learning, Bayesian Networks, ECG, Atrial Fibrillation, Wearable Devices.
Abstract:
We explore how machine learning (ML) and Bayesian networks (BNs) can be combined in a personal health
agent (PHA) for the detection and interpretation of electrocardiogram (ECG) characteristics. We propose a
PHA that uses ECG data from wearables to monitor heart activity, and interprets and explains the observed
readings. We focus on atrial fibrillation (AF), the commonest type of arrhythmia. The absence of a P-wave in
an ECG is the hallmark indication of AF. Four ML models are trained to classify an ECG signal based on the
presence or absence of the P-wave: multilayer perceptron (MLP), logistic regression, support vector machine,
and random forest. The MLP is the best performing model with an accuracy of 89.61% and an F1 score
of 88.68%. A BN representing AF risk factors is developed based on expert knowledge from the literature
and evaluated using Pitchforth and Mengersen’s validation framework. The P-wave presence or absence as
determined by the ML model is input into the BN. The PHA is evaluated using sample use cases to illustrate
how the BN can explain the occurrence of AF using diagnostic reasoning. This gives the most likely AF risk
factors for the individual.
1 INTRODUCTION
Wearable devices have become increasingly
ubiquitous. They are equipped with a range of
sensors, allowing people to monitor their health
continuously outside clinical settings without
interfering with their regular activities (Dias and
Cunha, 2018). These devices generate significant
amounts of data which can be interpreted, analysed
and explained using Artificial Intelligence (AI).
Machine learning (ML) algorithms can rapidly
identify properties and patterns in the data, while
knowledge representation and reasoning (KRR)
techniques can draw novel inferences from the
data. A combination of ML and KRR techniques
can enhance prediction, interpretation, explanation,
diagnosis, discovery and therapy selection (Johnson
et al., 2018).
As an application of this concept, we propose
a
https://orcid.org/0000-0002-5139-8421
b
https://orcid.org/0000-0002-2923-8333
c
https://orcid.org/0000-0002-8749-7253
d
https://orcid.org/0000-0002-4340-9178
a personal health agent (PHA) that incorporates
ML techniques and a Bayesian Network (BN)
for monitoring heart activity using commercially
available wearable devices. We focus on detecting
and explaining the most likely causes of arrhythmia,
a cardiac condition characterized by irregularities in
the rhythm of the heart. The prevalence of arrhythmia
is rising globally (Kornej et al., 2020) and yet in
many individuals, it remains undetected. Moreover,
if left untreated, it can lead to heart failure and stroke
(Weimann and Conrad, 2021). In about 20% of
individuals who experience stroke due to arrhythmia,
specifically Atrial Fibrillation (AF), the occurrence of
AF was not detected until the time of stroke or shortly
afterwards (Steinhubl et al., 2018). Monitoring a
patient with a home-based wearable ECG sensor
patch increases the rate of AF diagnosis after four
months (Steinhubl et al., 2018).
AF is the most common sustained and clinically
significant cardiac arrhythmia (Chugh et al., 2014;
Nguyen et al., 2013; Wasmer et al., 2017), and is
a growing public health problem in many countries,
including developing ones (Nguyen et al., 2013). The
gold standard in the diagnosis of AF is by use of an
Wanyana, T., Nzomo, M., Price, C. and Moodley, D.
Combining Machine Learning and Bayesian Networks for ECG Interpretation and Explanation.
DOI: 10.5220/0011046100003188
In Proceedings of the 8th International Conference on Information and Communication Technologies for Ageing Well and e-Health (ICT4AWE 2022), pages 81-92
ISBN: 978-989-758-566-1; ISSN: 2184-4984
Copyright
c
2022 by SCITEPRESS – Science and Technology Publications, Lda. All rights reserved
81

electrocardiogram (ECG) (Hagiwara et al., 2018), a
medical test that provides a record of the electrical
activity of the heart. The efficient and accurate
interpretation of large amounts of ECG data using
technology can reduce the burden on the healthcare
system and result in early detection of AF.
The proposed PHA will use ECG data from
wearable devices to monitor heart activity, and
interpret and explain the observed readings. We draw
from the agent architecture for knowledge discovery
and evolution (KDE) (Wanyana and Moodley, 2021)
to determine the components of the PHA. We focus
on two components from the KDE architecture: the
AI service which is the ML component; and the
BN for capturing causal knowledge and providing
plausible explanations. We constrain the PHA to
detect a specific type of arrhythmia, i.e. AF. However,
the agent can be extended to determine, interpret
and explain other types of arrhythmia. The novel
contributions of this paper are:
1. A ML model that classifies an ECG signal
based on its characteristics, specifically whether
a P-wave is present or not.
2. A prototype BN model of AF risk factors.
3. An approach for combining ML and BNs into a
PHA for ECG interpretation and explanation.
The rest of the paper is organised as follows:
Section 2 presents the background and related
work, covering the reference architecture used, ECG
analysis and BNs. Section 3 describes the ECG
dataset and the development of the ML models
to classify ECG signals based on the presence
or absence of the P-wave. Section 4 explains
the perception module in relation to the PHA.
Section 5 presents the use of the AF BN in the
deliberation modules of the PHA and also discusses
the development of the prototype BN and its
parameters. In Section 6, we evaluate and discuss the
ML models, the BN and the PHA. We conclude and
present future work in Section 7.
2 BACKGROUND AND RELATED
WORK
2.1 The KDE Agent Architecture
The KDE architecture (Wanyana and Moodley, 2021)
is a recent agent architecture for designing agents that
perform pattern analysis and knowledge discovery
from sensor observations emanating from dynamic
physical systems. It provides a mechanism for
integrating ML and KRR techniques to detect,
interpret and explain patterns in data. The architecture
specifies the components of a KDE agent and how
they interact. It can accommodate both top-down
knowledge representation and reasoning techniques
and bottom-up ML and data mining techniques
(Wanyana and Moodley, 2021; Wanyana et al., 2020).
The KDE architecture has two exogenous
modules: the AI service and the domain expert.
The AI service incorporates data driven techniques
which are used to build models from data. It also
consists of a pattern detection service which detects
patterns in new incoming data. The architecture also
originally has three endogenous modules: perception,
deliberation and theory construction. Some of the
architectural modules and components in the original
architecture, specifically the theory construction
module and the rules and the ontology which are part
of the deliberation module, were left out in order to
show only the components applied in this work.
2.2 The PHA Architecture
The KDE architecture is used to guide the design of
the PHA. Figure 1 shows a simplified version of this
architecture in relation to AF detection, interpretation
and explanation. Experts (e.g. clinicians) have
to oversee and participate in the model building
activities (arrow 2), such as data labelling. The
experts also guide the acquisition and representation
of domain knowledge captured in the BN (arrow 4).
The development of the BN can also be supported
by learning BN parameters, i.e. the conditional
probability tables (CPTs) from the data (arrow 3).
A ML model is trained to classify an ECG signal.
As the agent continuously monitors an individual’s
ECG, the model is used to detect the pattern present
in the incoming ECG data: whether the P-wave is
present or not. The detected pattern, i.e. the presence
or absence of a P-wave based on the nature of the
ECG, serves as input to perception module (arrow 5).
It then interprets the observed sinus rhythm pattern
to determine the situation (condition) of which it is
indicative, i.e. the presence or absence of AF and
whether it is as expected or not. With the help of
its existing knowledge stored in the BN, the agent
deliberates to determine potential explanations. These
are risk factors of AF to look out for in the individual.
2.3 ECG Analysis
The ECG records a series of heartbeats, with a normal
heartbeat consisting of a P-wave, the QRS complex,
and the T-wave (Wasilewski and Polonski, 2012). The
ICT4AWE 2022 - 8th International Conference on Information and Communication Technologies for Ageing Well and e-Health
82
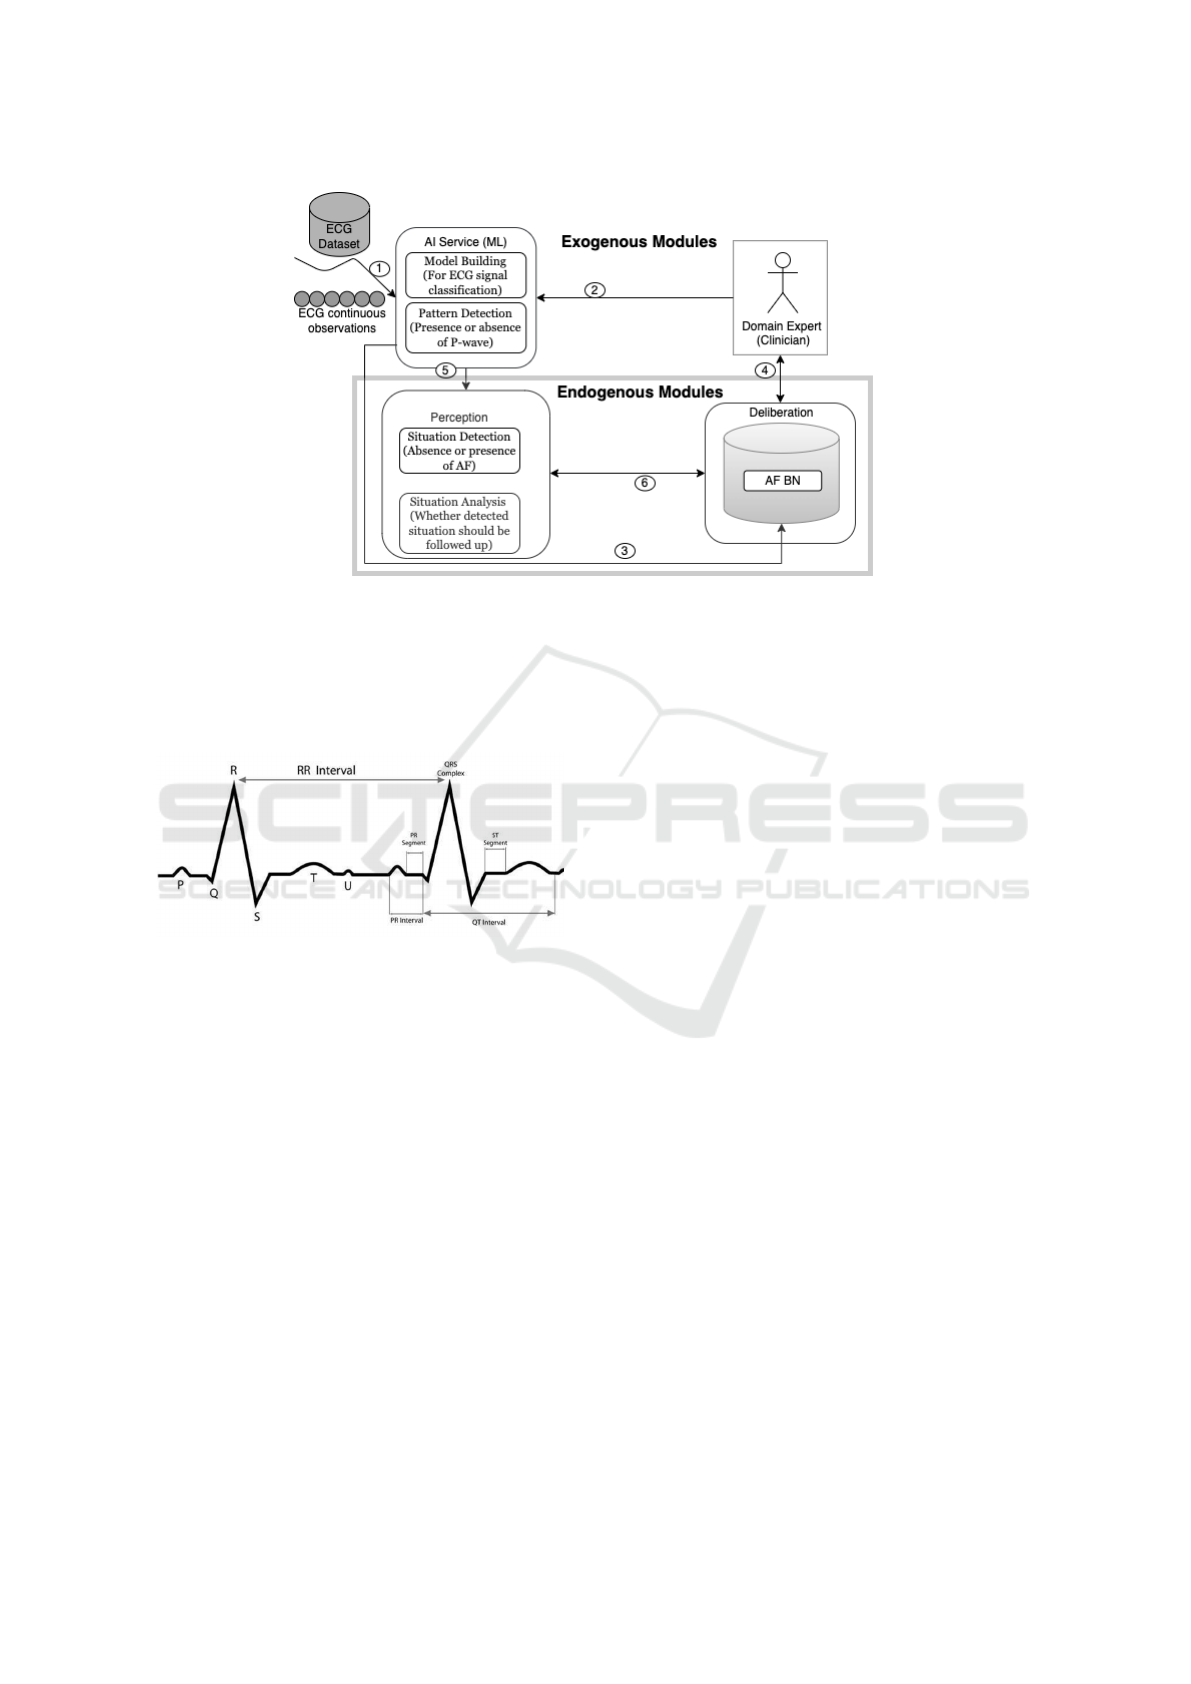
Figure 1: A simplified version of the KDE Architecture, based on Wanyana and Moodley (2021).
R-peak, which is part of the QRS complex, represents
the maximum amplitude in the heartbeat. The R-R
interval is the difference between the R-peaks in two
consecutive beats. Figure 2 shows the different parts
of an ECG.
Figure 2: Parts of an ECG (Wasilewski and Polonski, 2012).
2.3.1 Machine Learning in ECG Analysis
ML has been widely used for classification and
prediction of cardiac conditions using ECG data,
with many recent efforts focused on AF (Olier
et al., 2021). Deep learning in particular has
proven promising in recent years, primarily because
feature extraction can be performed automatically
without the need for human experts (Hong et al.,
2020). However, deep learning models have two main
disadvantages. Firstly, they have been criticised as
being black box models with limited interpretability
(Hong et al., 2020). Secondly, they typically require
large amounts of data and tend to be computationally
expensive. Traditional ML algorithms such as
tree-based methods and linear models have been
widely used and shown to produce good results in
ECG analysis, without the disadvantages of deep
neural networks (Olier et al., 2021).
2.3.2 P-wave Detection and Classification
The P-wave is particularly important in the detection
of AF from an ECG. The hallmark characteristic of
AF is the absence of a P-wave, which is replaced
by either fibrillatory waves or oscillations (Hagiwara
et al., 2018; Couceiro et al., 2008). Previous work
in P-wave analysis has focused on P-wave detection.
Mar
ˇ
s
´
anov
´
a et al. (2019) developed a method for
P-wave detection using the phasor transform, while
Hossain et al. (2019) developed an algorithm to
identify P-waves automatically in an ECG signal and
classify and differentiate between different P-wave
types.
Beyond P-wave detection, previous work has
also explored P-wave characteristics for arrhythmia
classification. Liu et al. (2018) proposed a support
vector machine (SVM) to distinguish different rhythm
types in an ECG signal based on statistical features of
the ECG, including the P-wave. The rhythm types
which the proposed algorithm identified are normal
rhythm, AF rhythm, and other rhythm.
The approach proposed in this paper creates a new
dataset consisting of ECG signals labelled as either
having a P-wave or not. A ML model is trained on
this dataset to classify new ECG observations based
on presence or absence of the P-wave. The model can
then be used to indicate whether an individual is likely
to have AF or not.
2.4 Bayesian Networks
Bayesian networks (BNs) are graphical models in the
form of directed acyclic graphs (DAGs) for reasoning
under uncertainty in a given domain. The nodes in a
Combining Machine Learning and Bayesian Networks for ECG Interpretation and Explanation
83

BN represent a set of random variables X= X
1
...X
i
...X
n
with each variable having a finite set of mutually
exclusive states (Korb and Nicholson, 2010). The
directed arcs between pairs of nodes represent causal
dependencies between the variables. If a variable
is certain to be in a particular state, this is entered
into the network’s node as evidence. The beliefs
of all the nodes of the network are then updated,
based on Bayes’ rule (belief propagation) presented
in Equation 1. BNs can be used to represent causal
relationships between variables under uncertainty in
a compact way (Darwiche, 2010). BNs offer an
appropriate technology for modelling medical and
health problems, which also includes personalised
healthcare (Velikova et al., 2014).
P(h|e) =
P(e|h)P(h)
P(e)
(1)
The design of the BN consists of two major
steps i.e. i) determining the structure or topology of
the network and ii) obtaining the parameters of the
network which involves determining the conditional
probabilities (CPTs), given the topology of the
network. These components of a BN can be learned
from data or obtained from expert knowledge.
Kyrimi et al. (2020) describe medical reasoning
patterns for aiding in the development of medical
BNs. Nodes are classified, among others, as
conditions (e.g. AF) and risk factors for that
condition. Fuster-Parra et al. (2016) used ML to
develop the structure of their BN of cardiovascular
risk, and populate the CPTs. Their BN structure
considers risk factors which influence other
risk factors, which in turn affect the patient’s
cardiovascular risk score and metabolic syndrome.
Velikova et al. (2014) propose a methodology for
building a functional model for syndrome progression
from medical principles and use it to construct a
preeclampsia BN. They model the relationship
between syndrome/disease (having two states:
present and absent) and the associated evidence
i.e. signs and symptoms via the functioning of a
particular organ. Risk factors such as pre-existing
diseases, age, gender and genetics may affect the
functioning of the organ. The probability of the risk
factors is usually obtained from population statistics
(Velikova et al., 2014).
Reasoning in BNs happens when we observe
the value of some variable and we would like
to incorporate the new information in the network
using Bayes’ rule (equation 2). This allows us to
answer questions that are predictive, diagnostic or
inter-causal (Korb and Nicholson, 2010). In this
work, we are specifically interested in diagnostic
reasoning from effect to cause, which happens in the
opposite direction to the arcs in the BN.
3 THE ML SERVICE
To detect possible AF, we propose a ML model that
classifies an ECG signal based on whether the P-wave
is present or absent. Signals classified as having an
absent P-wave suggest the presence of AF.
3.1 The ECG Dataset
To create a dataset for P-wave classification, we
use two-channel ECG records from two databases
that are publicly available on PhysioNet (Goldberger
et al., 2000). The details for each database are
summarised in Table 1. For the negative class
(P-wave absent), we use the widely used MIT-BIH
Atrial Fibrillation Database (AFDB) (Moody and
Mark, 1983). This database contains 25 records;
however only 23 of these contain the necessary
ECG signals. The two incomplete records are
therefore not included in this study. For the
positive class (P-wave present), we use an expert
annotated database (PWDB) (Mar
ˇ
s
´
anov
´
a et al., 2019)
containing reference P-wave annotations for 12
complete records from the MIT-BIH Arrhythmia
Database. PWDB contains arrhythmia pathologies
that make the detection of P-waves more difficult.
This mitigates the fact that absence of the P-wave may
be indicative of types of arrhythmia other than AF.
AFDB contains a larger number of records and a
longer record duration than PWDB. To address this,
we randomly sampled 12 records from AFDB so that
the number of records from each database was the
same. Additionally, at a later stage, we selected the
same number of heartbeats from each database to
ensure a balanced dataset. We combined the records
from the two databases to create one dataset. For
each record in the new dataset, we separated the two
channels for easier processing. For each channel in
each record, the following steps were performed:
1. The R peaks in each signal were identified
2. The signals were segmented into heartbeats using
the R peaks
3. The first and last beats were excluded to ensure
the strongest beats were captured
4. Signals from the P-wave database were resampled
from 360 Hz to 250 Hz to ensure a uniform
frequency in the dataset
5. 1,115 beats of equal length were randomly
sampled from each signal
ICT4AWE 2022 - 8th International Conference on Information and Communication Technologies for Ageing Well and e-Health
84

Table 1: Databases used in the creation of the dataset.
Database Records Duration Frequency Channels Channel Configuration
AFDB 23 10 hrs 250 Hz 2 Not reported
PWDB 12 30 mins 360 Hz 2
Upper signal: MLII (12 records)
Lower signal: V1 (9), V2 (2), V5 (1)
The subsequent ECG dataset is evenly balanced
between the two classes and contains a total of 53,520
beats from 24 records, ordered sequentially.
3.2 Model Building and Pattern
Detection
Four ML classification algorithms were implemented
using Scikit-learn (Pedregosa et al., 2011): multilayer
perceptron (MLP), logistic regression, SVM, and
random forest.
To train and test the models, we opted
for a stratified 10-fold cross-validation approach.
Cross-validation is a widely used data resampling
method that is effective in accurately assessing the
generalisation performance of ML models (Hastie
et al., 2009). Rather than a single random train-test
split, the dataset was divided into training and testing
sets using different partitions for each of the 10
rounds. The stratified approach maintained the
distribution of each class. After the 10 rounds of
cross-validation, we obtained the average accuracy,
average F1 score, and summed confusion matrix for
each model. The evaluation and results are discussed
in Section 6.1.
The best performing technique (in this case the
MLP, see Section 6.1) from the ML experiments is
used for ECG pattern detection, i.e. to determine
whether a P-wave is present or absent.
4 PERCEPTION
The perception module in Figure 1 consists of two
sub-modules, i.e. situation detection and situation
analysis. As opposed to using rules, as suggested in
the KDE architecture (Wanyana and Moodley, 2021),
situation detection in this work is carried out by
the BN. This is because the applicable domain rules
are few and the absence of a P-wave, for instance,
does not indicate with 100% certainty that AF is
present. The BN allows us to cater for the degree of
uncertainty that the rules cannot incorporate.
This work concentrates on an absent or present
P-wave, which most probably implies the presence
or absence of AF. However it can be extended in
order to accommodate other types of arrhythmia. As
soon as a pattern (i.e. present or absent P-wave)
is detected, it is captured in the BN as evidence.
The situation (condition) that this pattern represents
is then determined by propagating the probabilities
in the network. For example, if the detected pattern
indicates that a P-wave is absent and this evidence is
entered into the BN, then the BN beliefs are updated,
depicting that AF is probably present. The detected
situation is then analysed to check whether it is an
unexpected situation and should be followed up. For
example, for an individual who is not known to have
AF, if no P-wave is detected, indicating that AF
is probably present, the BN is used to explain this
situation.
5 DELIBERATION
Deliberation in the architecture (Figure 1) occurs
using a BN. In this section, we describe the
development of a prototype AF-BN. The BN is
used to determine the factors that contribute to an
individual having AF. The explanation we seek and
intend to follow up is in answer to the question: what
factors affect an individual’s chances of having AF
and to what extent?
The BN was developed using the iterative
knowledge engineering approach (Korb and
Nicholson, 2010) with the help of the Netica
1
tool. A condition C can be distinguished as a disease,
a disorder or a syndrome (Kyrimi et al., 2020). We
identified the condition (AF) and its risk factors by
using the risk factor idiom (Kyrimi et al., 2020).
This idiom models the risk factors which increase
someone’s likelihood of having a certain condition
(in this case, AF). The risk factors form the basis of
explanation of the presence of the condition in an
individual. The structure of the BN was influenced
by articles showing the modelling of risk factors, e.g.
Velikova et al. (2014), and the relationships found
among the variables found in Fuster-Parra et al.
(2016). Important to note is the fact that this is just
one possible structure that can be used to model AF.
The prototype BN is shown in Figure 3. The labels
of the risk factor nodes are prefixed with “RF: ”,
and the condition, AF, with “C: ”. The prototype
1
https://www.norsys.com/netica.html
Combining Machine Learning and Bayesian Networks for ECG Interpretation and Explanation
85

AF-BN shows some traditional and representative
AF health risk factors, viz. hypertension which
carries the largest population attributable risk for
AF development in the world (Kornej et al., 2020;
Wasmer et al., 2017), valvular heart disease and
ischemic heart disease. The three factors are
identified in Nguyen et al. (2013) as the most common
conditions in a developing context. Diabetes mellitus
was added as it presents a 40% increased risk of
AF development (Kornej et al., 2020). Lifestyle risk
factors captured in the prototype network include
alcohol abuse, obesity and smoking. The identified
non-modifiable risk factors captured in the prototype
AF BN are age and sex: males and older people
have a higher risk of suffering from AF than females
and younger people (Kornej et al., 2020). As far
as age is concerned, increase in AF is a reflection
of comorbidities and cardiovascular risk factors
in addition to other factors like lifestyle changes
(Wasmer et al., 2017).
The CPT values were determined from the
literature (Feinberg et al., 1995; Nguyen et al., 2013;
Pritchett, 1992; Kornej et al., 2020; Wasmer et al.,
2017). The CPT values of the P-wave node in the BN
were selected to be P(P-wave=Absent | AF=Present)
= 98% and P(P-wave=Present | AF=Absent) = 95%.
The likelihood values used for the P-wave node are
the probabilities obtained from the ML model using
predict proba(), a method from Scikit-learn which
returns the probability estimates for each class. The
authors reviewed the structure, CPTs and working of
the BN during its development.
Other lifestyle factors that affect AF development
identified in Kornej et al. (2020), but not modelled
here, are extreme physical activity, psychological
stress and psycho-social factors. Health risk factors
identified in the literature, but not represented in
the BN are rheumatic heart disease, heart failure,
hyperthyroidism, pulmonary disease and coronary
heart disease. The risk factors are what may have
led to an onset of AF and these are used to explain
the presence of AF in an individual. Checking
for the presence of some of these risk factors that
would make one susceptible to AF may help medical
practitioners to manage their patient’s AF better. At
this point, the agent aims to inform the practitioner
that since AF is present, some other underlying
risk factors should be checked for and managed.
However, the ways of managing and treating the
specific conditions is out of scope of the network.
Using the BN to reason diagnostically presents the
risk factors which should be looked for when AF is
confirmed in the ECG.
We consider specific evidence (Korb and
Nicholson, 2010), where the evidence is in the form
of P-wave = Absent. The context nodes in the BN
are age and sex, and lifestyle factors, i.e. alcohol
abuse, smoking and obesity. These factors are all
observed, and will be entered into the BN as evidence
by the individual or the medical practitioner. When
the state of the P-wave is entered into the BN along
with the state of some context nodes e.g. age and
sex, the condition that it is indicative of is obtained
e.g. P-wave = Absent indicates that AF is most likely
present. The traditional risk factors that have the
highest conditional probabilities are then obtained
from the network. These give tentative reasons for
the existence of AF in an individual and should be
followed up.
6 EVALUATION AND
DISCUSSION
In this section, we discuss the evaluation and
validation of both the ML and BN components of the
PHA and then show how we evaluate the combined
components of the PHA using a use case.
6.1 Evaluation of the ML Models
The ML models were evaluated using three metrics:
confusion matrix, accuracy, and F1 score. The
confusion matrix
T P FP
FN T N
shows the number of true
positives (TP), false negatives (FN), false positives
(FP), and true negatives (TN) in the predictions.
Accuracy refers to the percentage of correct
predictions for the test data, as seen in Equation 2.
T P + T N
T P + T N + FP + FN
(2)
The F1 score is a computation of the harmonic
mean of the precision (Equation 3) and recall
(Equation 4). Its formula is shown in Equation 5.
T P
T P + FP
(3)
T P
T P + FN
(4)
2 ∗
Precision ∗ Recall
Precision + Recall
(5)
Because the models were trained using 10-fold
cross-validation, the reported accuracy and F1 scores
are averaged across the 10 folds, while the confusion
matrix is summed. The results on the testing set
are shown in Table 2. The best performing model
is the MLP, with an average accuracy of 89.61%
ICT4AWE 2022 - 8th International Conference on Information and Communication Technologies for Ageing Well and e-Health
86
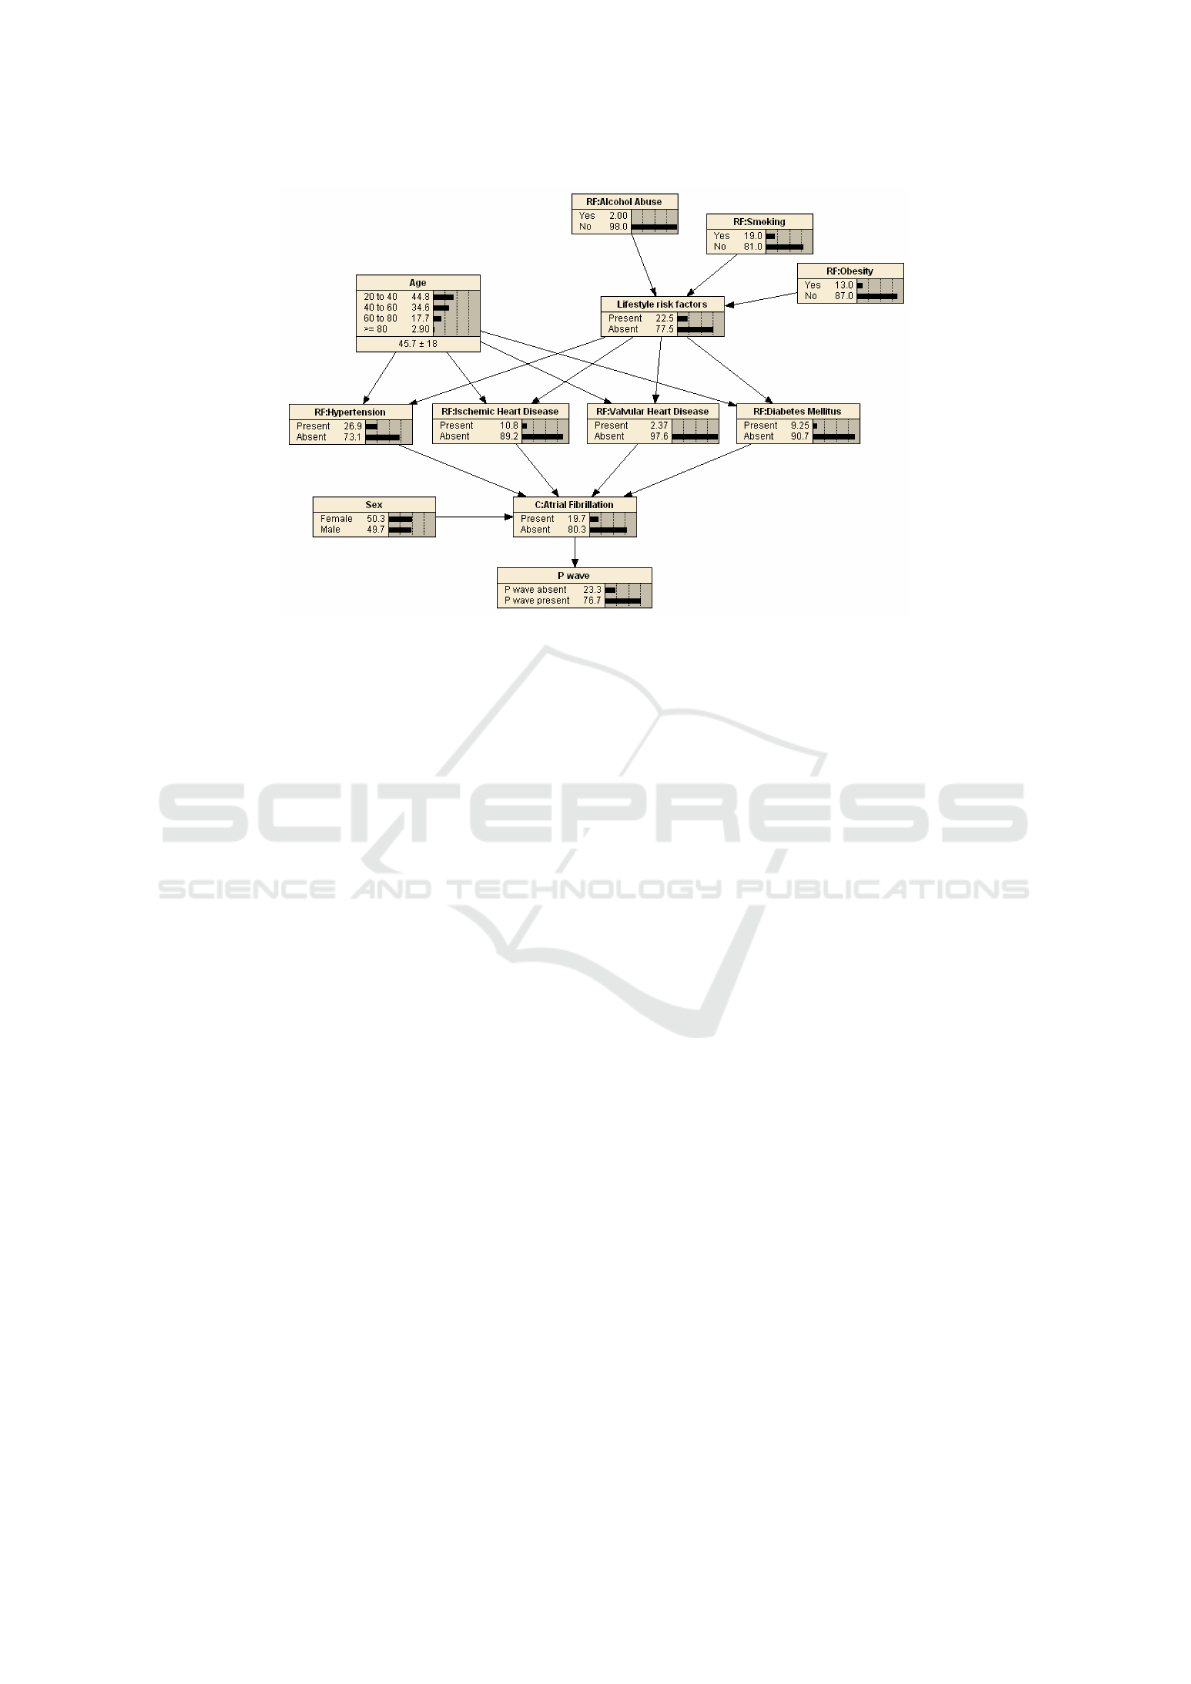
Figure 3: A prototype BN for explaining causes of AF.
and an average F1 score of 88.68%. The confusion
matrix results for the MLP show a higher number
of FN than FP. This is in contrast to the logistic
regression model, where the numbers of FP and FN
are similar. This means that the MLP is more likely
to incorrectly determine an absent P-wave than to
incorrectly determine a present P-wave. Therefore,
the model may incorrectly suggest AF in a small
number of cases.
In Table 3, we compare the MLP’s performance
to that of the SVM presented by Liu et al. (2018),
which classifies an ECG signal as either a normal
rhythm, AF rhythm, or other rhythm based on the
features of the ECG, including the characteristics of
the P-wave. Liu et al. (2018) used the F1 score metric
to evaluate their proposed algorithm. They report
the F1 scores for each of the rhythm types as well
as the average F1 score for all rhythms, on both the
training set and testing set. In particular, we compare
the MLP’s performance to the performance of the
SVM in classifying the AF rhythm and the average
performance for all rhythms. The results show that
the MLP that we present in this paper outperforms
the SVM proposed by Liu et al. (2018) for detecting
AF. For this reason, the MLP is applied as part of the
PHA’s ML service.
6.2 Evaluation of the Prototype BN
The prototype BN was evaluated by the authors
using Pitchforth and Mengersen’s framework for
expert-elicited BNs (Pitchforth and Mengersen,
2013). The network fits within the medical and
in particular, cardiology domain, thus confirming
nomological validity. The BN has the structure, node
discretisation and parameters that would be expected,
confirming face validity.
The prototype BN contains the main risk factors
for AF mentioned in the literature. However,
additional nodes can be added to cover a wider range
of risk factors. In the literature, some papers state that
certain AF risk factors are more important than others.
However, this depends on the population upon which
the paper is based. The states in the nodes contain all
the values that the node can take. The input nodes’
CPT values are based on the literature. These factors
confirm the BN’s content validity. It should be noted
that the CPT values in the prototype BN can change
according to the context which is being modelled. For
example, for some populations, diabetes plays a larger
role than in others; in an Ethiopian study, the levels of
obesity in patients with AF were lower than in other
contexts (Pitman et al., 2021).
To evaluate convergent validity, the structure of
the BN was inspected. At the bottom of the BN,
the measurement idiom (Neil et al., 2000; Kyrimi
et al., 2020) can be seen in the nodes C:Atrial
Fibrillation → P-wave. The Lifestyle risk
factors node summarises the RF:Alcohol abuse,
RF:Smoking and RF:Obesity nodes using the
definitional/synthesis idiom (Neil et al., 2000; Kyrimi
et al., 2020). The cause–consequence idiom (Neil
et al., 2000; Kyrimi et al., 2020) can be seen where
the nodes Age and Lifestyle risk factors cause
the four traditional risk factors (RF:Hypertension
to RF:Diabetes Mellitus) in the middle of the
BN, and where Sex causes the condition of Atrial
Fibrillation. The BN structure follows the risk
Combining Machine Learning and Bayesian Networks for ECG Interpretation and Explanation
87

Table 2: Results of classification on the testing set.
Algorithm Confusion Matrix (Summed) Average Accuracy Average F1 Score
MLP
24983 1777
3784 22976
89.61% 88.68%
Logistic Regression
23192 3568
3671 23089
86.47% 86.13%
SVM
22556 4204
7141 19619
78.80% 77.40%
Random Forest
22975 3785
10326 16434
73.63% 68.33%
Table 3: Comparison of MLP performance with SVM
performance from Liu et al. (2018) on the testing and
training sets.
Algorithm
F1 Score
(Testing Set)
F1 Score
(Training Set)
MLP 88.68% 99.64%
SVM
(AF rhythm)
78.56% 86.37%
SVM
(average)
80.00% 84.00%
factor idiom outlined by Kyrimi et al. (2020), e.g.
the four traditional risk factors (RF:Hypertension
to RF:Diabetes Mellitus) in the middle of the
BN to the condition C:Atrial Fibrillation. The
structure of risk factor nodes were modelled based
this risk factor idiom, and on the work of Velikova
et al. (2014) (preeclempsia) and Fuster-Parra et al.
(2016) (cardiovascular risk score and metabolic
syndrome). This confirms convergent validity.
To evaluate predictive validity, three aspects of
the BN’s execution need to be assessed: the BN’s
behaviour when it is executed; its sensitivity to
findings or parameters; and its modelling of extreme
conditions. Without evidence added, the prototype
AF-BN shows prevalence for the four traditional
risk factors, as they are experienced worldwide (see
Figure 3). If a person has AF (i.e. evidence in
the C:Atrial Fibrillation node is set to Present
as in Figure 4), the values of the four traditional
risk factors can be compared with literature: the
systematic review in Nguyen et al. (2013) provides
these values for developing contexts (see Table 4).
The values in the BN give acceptable results; it should
be noted that the BN’s CPT values would need to
change if the BN is to represent a different population.
For example, valvular heart disease is more prevalent
in developing countries than in developed countries
(Nguyen et al., 2013).
The sensitivity to findings for the C:Atrial
Fibrillation node can be found in Table 5. This
shows a ranking of the nodes to which evidence
should be added in order to be more certain about
the value of the C:Atrial Fibrillation node.
RF:Hypertension is the risk factor which gives the
most certainty to C:Atrial Fibrillation. This
concurs with Nguyen et al. (2013); Wasmer et al.
(2017); Kornej et al. (2020), who rank hypertension
as the most common risk factor for AF. Other AF risk
factors may have a larger or smaller effect on AF in
different contexts.
To assess extreme conditions, different values
were entered into the BN as evidence. For example,
high and low values of the Sex, Age and lifestyle risk
factor nodes were entered to verify the prediction of
the C:Atrial Fibrillation node. These extreme
conditions showed expected behaviour of the BN.
The validation showed that the BN represents the
factors causing AF suitably well. However, it is
recognised that further testing and evaluation of this
prototype BN is necessary before deployment into
industry.
6.3 Evaluation of the PHA
The PHA agent acquires its percepts by leveraging an
exogenous ML service in which an MLP algorithm
is used to classify whether the P-wave was absent or
present in the ECG signal. When new ECG signals
come in, the presence or absence of the P-wave is
detected and the situation that it is indicative of is
interpreted and explained using a BN. The BN allows
the causal relationships and uncertainties present in
expert knowledge to be captured. This knowledge is
used in ECG interpretation and explanation. To link
the results of the ML to the BN, the probabilities for
classifying the sensed input as having a P-wave or not
were used as the likelihood for the evidence entered
in the P-wave node in the BN.
To evaluate the PHA, we apply use cases which
also show its predictive validity. The intention is to
check whether the provided explanation matches the
trends mentioned in the literature, given the state of
the P-wave detected by the ML component.
Consider a man who is above 80 years of age, and
the P-wave is detected as absent with a likelihood of
ICT4AWE 2022 - 8th International Conference on Information and Communication Technologies for Ageing Well and e-Health
88
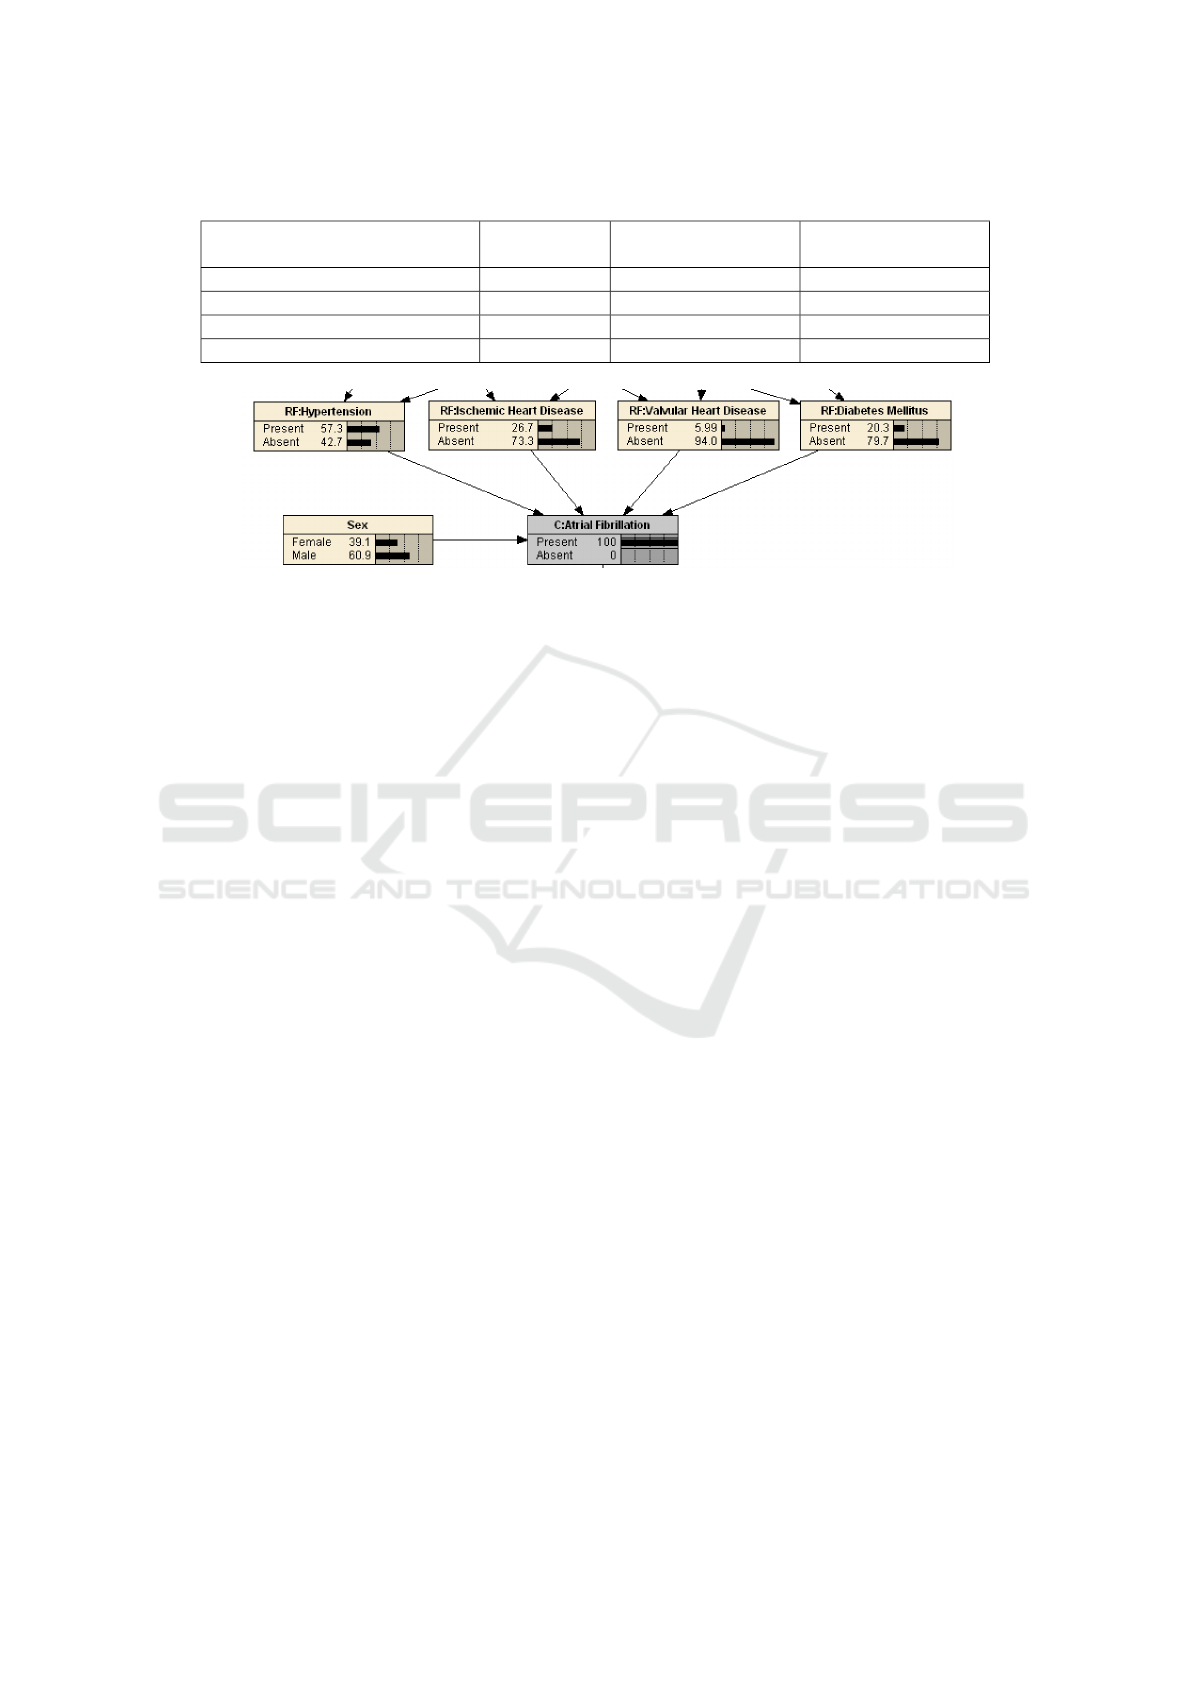
Table 4: Values of the four traditional risk factor nodes, given AF, compared to Nguyen et al. (2013).
Node
AF BN value
(Figure 4)
Min value in
Nguyen et al. (2013)
Max value in
Nguyen et al. (2013)
RF:Hypertension 57.3% 10.3% 71.9%
RF:Ischemic Heart Disease 26.7% 6.4% 47%
RF:Valvular Heart Disease 5.99% 5.6% 66%
RF:Diabetes Mellitus 20.3% 3.3% 33%
Figure 4: Extract of the prototype BN showing causes of AF risk factors, given that AF is present.
96.1% i.e. P(observation | P-wave = P-wave Absent)
= 96.1%) (see Figure 5). There is 84.9% chance that
the individual has AF. Using diagnostic reasoning,
this may be attributed to the fact that the individual
suffers hypertension (54.2%). Ischemic heart disease
and diabetes may also be a cause although they
depict a low probability of only 28.6% and 30.2%
respectively.
If more context is available for the person in terms
of the lifestyle risk factors, this can be added to the
BN. For example, if this person is obese, smokes and
abuses alcohol, the probability of having AF rises to
90.3% (see Figure 6). Reasoning diagnostically, the
traditional risk factors also rise: hypertension rises to
59.6% and ischemic heart disease to 60.3%. While
the chances of the individual having valvular heart
disease and diabetes mellitus have also consequently
risen, these have not risen above 50%. The
person’s medical practitioner may want to check these
conditions as a preventative management step.
A similar scenario was run with information for
the same person (male, above 80 years old), with no
known lifestyle factors. The ML algorithm detected
a P-wave (with the same likelihood value of 96.1%)
indicating that AF is absent. Results show that AF’s
presence is 3.01%. Reasoning diagnostically, the
man has a 28.3% chance of having hypertension,
12.1% ischemic heart disease, 4.18% valvular heart
disease and 15.7% diabetes mellitus. If this man is
obese, smokes and abuses alcohol, the probability of
having AF rises to 4.89%, while the traditional risk
factors rise to 36.3% (hypertension), 36.8% (ischemic
heart disease), 5.11% (valvular heart disease) and
18.7% (diabetes mellitus). This rise is what would
be expected in an older person with these lifestyle
factors.
These use cases demonstrate that the agent
behaves as expected and aligns with the trends
obtained from the literature.
7 CONCLUSION AND FUTURE
WORK
This paper demonstrates how a combination of data
driven techniques and expert elicited knowledge
can be applied in a hybrid AI approach in an
agent that provides explanations. We have shown
how data driven techniques, specifically ML, and
reasoning using BNs can be integrated into a PHA.
Wearables in the personal health domain generate
large volumes of data in a continuous manner, and
therefore data driven techniques are required to
analyse and extract useful knowledge from the data.
Scientific or expert knowledge, with the help of tools
like BNs, can be applied in the interpretation and
understanding of interesting situations obtained from
the data. The application of the KDE architecture
has enabled ML and reasoning to be combined in the
PHA for ECG interpretation and explanation. ML
and reasoning over existing knowledge have been
combined in various domains for example in the
biodiversity domain (Sen et al., 2021). However, to
our knowledge, this is the first study that has sought
to explore the combination of ML and reasoning in
the interpretation, understanding and explanation of
ECGs using a PHA.
A P-wave annotated arrhythmia database and
an AF database were combined to create a dataset
containing ECG signals with present and absent
P-waves. Four ML algorithms were trained on
Combining Machine Learning and Bayesian Networks for ECG Interpretation and Explanation
89
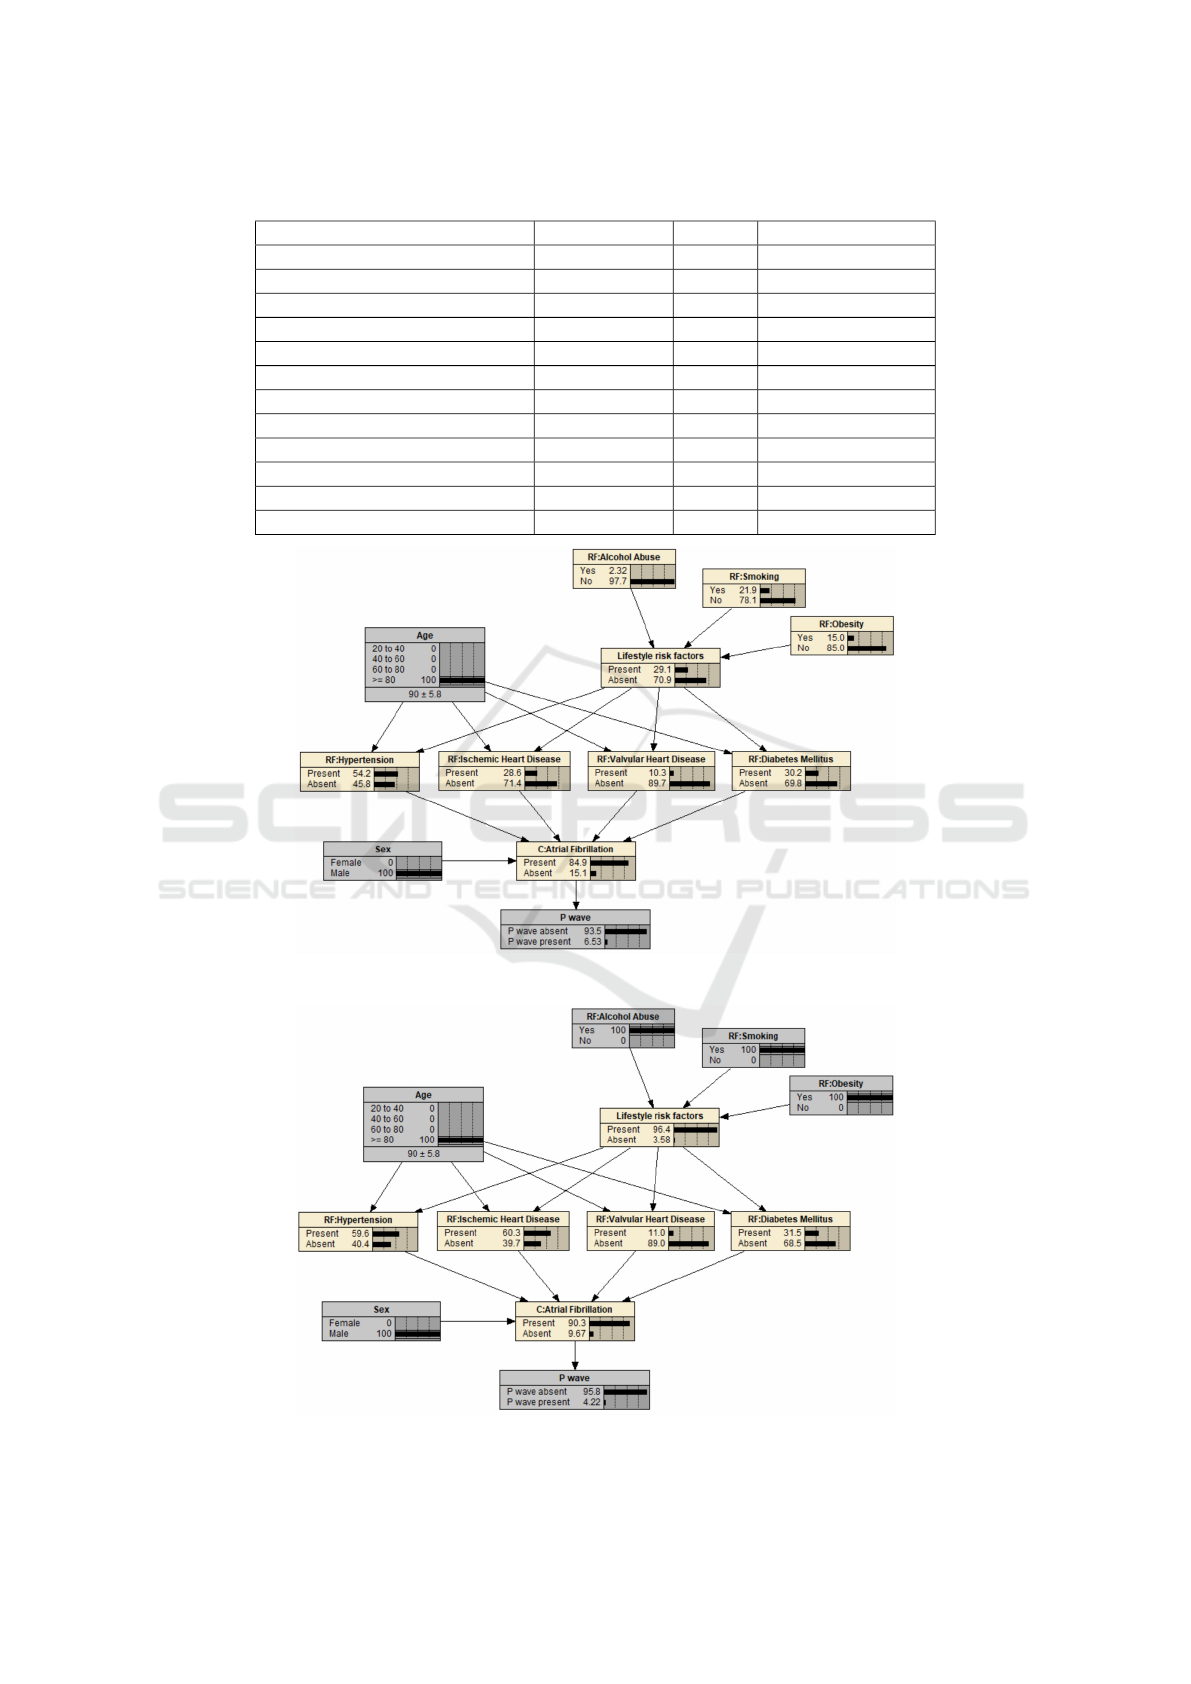
Table 5: Sensitivity to findings for the C:Atrial Fibrillation node.
Node
Entropy Value
Percent Variance of Beliefs
C:Atrial Fibrillation
0.71643 100 0.1583535
P-wave
0.52619 73.4 0.1211922
RF:Hypertension
0.07575 10.6 0.0183385
RF:Ischemic Heart Disease
0.03808 5.32 0.0101794
RF:Diabetes Mellitus
0.02155 3.01 0.0056523
Lifestyle risk factors
0.01835 2.56 0.0043785
Sex
0.00890 1.24 0.0019414
RF:Valvular Heart Disease
0.00797 1.11 0.0022011
Age
0.00445 0.621 0.0010077
RF:Smoking
0.00403 0.562 0.0009329
RF:Obesity
0.00266 0.372 0.0006217
RF:Alcohol Abuse
0.00039 0.0546 0.0000924
Figure 5: The AF BN representing an 80+ year old man who has an absent P-wave.
Figure 6: The AF BN representing an 80+ year old man with lifestyle risk factors and an absent P-wave.
ICT4AWE 2022 - 8th International Conference on Information and Communication Technologies for Ageing Well and e-Health
90

the dataset to classify an ECG signal based on the
presence or absence of the P-wave. The classification
results are promising, with the best performing
model outperforming the classifier proposed by Liu
et al. (2018). The prototype BN used (Figure 3)
demonstrates how risk factors for AF can be used to
explain the occurrence of AF in an individual. The
parameters of the BN presented here can be adjusted
to represent the prevalence of different risk factors
in different populations. The BN can be extended to
accommodate other types of arrhythmia.
Despite these promising results, this study
has some limitations. The number of patients
in the dataset used to train the ML models is
quite small. This is because there is a limited
number of ECG datasets with accurate, expertly
annotated P-waves. For future work, we intend to
create a larger dataset which includes ECG signals
collected from commercially available wearable
devices. We will also explore ways to boost the
performance of the ML models, for example through
additional hyperparameter tuning. Additionally, the
generalisability of the ML models could be further
improved using leave-one-out cross-validation, in
which the number of folds corresponds to the number
of patients in the dataset. To further validate the BN,
expert clinicians need to be involved in improving
and testing the prototype BN. We also plan to
explore how new unknown situations or ECG patterns
that can lead to construction of new theories, as
suggested in Wanyana and Moodley (2021), can be
incorporated into the agent-based system towards
knowledge discovery and evolution.
ACKNOWLEDGEMENTS
This work was financially supported by the Hasso
Plattner Institute for Digital Engineering through the
HPI Research School at UCT. The authors thank the
reviewers for suggestions made, which have helped to
improve this paper.
REFERENCES
Chugh, S. S., Roth, G. A., Gillum, R. F., and Mensah,
G. A. (2014). Global burden of atrial fibrillation
in developed and developing nations. Global Heart,
9(1):113–119.
Couceiro, R., Carvalho, P., Henriques, J., Antunes, M.,
Harris, M., and Habetha, J. (2008). Detection of
atrial fibrillation using model-based ECG analysis.
In 2008 19th International Conference on Pattern
Recognition, pages 1–5. IEEE.
Darwiche, A. (2010). Bayesian networks. Communications
of the ACM, 53(12):80–90.
Dias, D. and Cunha, J. P. S. C. (2018). Wearable
health devices—vital sign monitoring, systems and
technologies. Sensors, 18(8):2414.
Feinberg, W. M., Blackshear, J. L., Laupacis, A.,
Kronmal, R., and Hart, R. G. (1995). Prevalence,
age distribution, and gender of patients with atrial
fibrillation: Analysis and implications. Archives of
Internal Medicine, 155(5):469–473.
Fuster-Parra, P., Tauler, P., Bennasar-Veny, M., Ligeza, A.,
Lopez-Gonzalez, A., and Aguil
´
o, A. (2016). Bayesian
network modeling: A case study of an epidemiologic
system analysis of cardiovascular risk. Computer
methods and programs in biomedicine, 126:128–142.
Goldberger, A. L., Amaral, L. A., Glass, L., Hausdorff,
J. M., Ivanov, P. C., Mark, R. G., Mietus, J. E.,
Moody, G. B., Peng, C.-K., and Stanley, H. E.
(2000). PhysioBank, PhysioToolkit, and PhysioNet:
Components of a new research resource for complex
physiologic signals. Circulation, 101(23):e215–e220.
Hagiwara, Y., Fujita, H., Oh, S. L., Tan, J. H., San Tan,
R., Ciaccio, E. J., and Acharya, U. R. (2018).
Computer-aided diagnosis of atrial fibrillation based
on ECG signals: A review. Information Sciences,
467:99–114.
Hastie, T., Tibshirani, R., and Friedman, J. (2009). Model
Assessment and Selection. In The Elements of
Statistical Learning: Data Mining, Inference, and
Prediction, chapter 7, pages 219–259. Springer, 2nd
edition.
Hong, S., Zhou, Y., Shang, J., Xiao, C., and Sun, J.
(2020). Opportunities and challenges of deep learning
methods for electrocardiogram data: A systematic
review. Computers in Biology and Medicine,
122:103801.
Hossain, M. B., Bashar, S. K., Walkey, A. J., McManus,
D. D., and Chon, K. H. (2019). An accurate QRS
complex and P wave detection in ECG signals using
complete ensemble empirical mode decomposition
with adaptive noise approach. IEEE Access,
7:128869–128880.
Johnson, K. W., Torres Soto, J., Glicksberg, B. S., Shameer,
K., Miotto, R., Ali, M., Ashley, E., and Dudley,
J. T. (2018). Artificial intelligence in cardiology.
Journal of the American College of Cardiology,
71(23):2668–2679.
Korb, K. B. and Nicholson, A. E. (2010). Bayesian artificial
intelligence. CRC Press.
Kornej, J., B
¨
orschel, C. S., Benjamin, E. J., and Schnabel,
R. B. (2020). Epidemiology of atrial fibrillation in
the 21st century: Novel methods and new insights.
Circulation Research, 127(1):4–20.
Kyrimi, E., Neves, M. R., McLachlan, S., Neil, M., Marsh,
W., and Fenton, N. (2020). Medical idioms for
clinical Bayesian network development. Journal of
Biomedical Informatics, 108:103495.
Liu, N., Sun, M., Wang, L., Zhou, W., Dang, H., and Zhou,
X. (2018). A support vector machine approach for af
Combining Machine Learning and Bayesian Networks for ECG Interpretation and Explanation
91

classification from a short single-lead ECG recording.
Physiological Measurement, 39(6):064004.
Mar
ˇ
s
´
anov
´
a, L., N
ˇ
emcov
´
a, A., Sm
´
ı
ˇ
sek, R., Goldmann, T.,
V
´
ıtek, M., and Smital, L. (2019). Automatic detection
of P wave in ECG during ventricular extrasystoles. In
World Congress on Medical Physics and Biomedical
Engineering 2018, pages 381–385. Springer.
Moody, G. and Mark, R. G. (1983). A new method
for detecting atrial fibrillation using RR intervals.
Computers in Cardiology, 10:227–230.
Neil, M., Fenton, N., and Nielson, L. (2000). Building
large-scale Bayesian networks. The Knowledge
Engineering Review, 15(3):257–284.
Nguyen, T. N., Hilmer, S. N., and Cumming, R. G. (2013).
Review of epidemiology and management of atrial
fibrillation in developing countries. International
Journal of Cardiology, 167(6):2412–2420.
Olier, I., Ortega-Martorell, S., Pieroni, M., and Lip, G. Y.
(2021). How machine learning is impacting research
in atrial fibrillation: Implications for risk prediction
and future management. Cardiovascular Research,
117(7):1700–1717.
Pedregosa, F., Varoquaux, G., Gramfort, A., Michel, V.,
Thirion, B., Grisel, O., Blondel, M., Prettenhofer,
P., Weiss, R., Dubourg, V., Vanderplas, J., Passos,
A., Cournapeau, D., Brucher, M., Perrot, M., and
Duchesnay, E. (2011). Scikit-learn: Machine learning
in Python. Journal of Machine Learning Research,
12:2825–2830.
Pitchforth, J. and Mengersen, K. (2013). A proposed
validation framework for expert elicited Bayesian
networks. Expert Systems with Applications,
40(1):162–167.
Pitman, B. M., Chew, S.-H., Wong, C. X., Jaghoori, A.,
Iwai, S., Lyrtzis, E., Lim, M., Chew, R., Chew,
A., Sanders, P., et al. (2021). B-PO01-001 Atrial
fibrillation prevalence and risk factors in a semi-rural
African population: The TEFF-AF study. Heart
Rhythm, 18(8):S51.
Pritchett, E. L. (1992). Management of atrial
fibrillation. New England Journal of Medicine,
326(19):1264–1271.
Sen, A., Sterner, B., Franz, N., Powel, C., and Upham, N.
(2021). Combining machine learning & reasoning for
biodiversity data intelligence. In Proceedings of the
Thirty-fifth AAAI Conference on Artificial Intelligence
(AAAI-21), pages 14911–14919.
Steinhubl, S. R., Waalen, J., Edwards, A. M., Ariniello,
L. M., Mehta, R. R., Ebner, G. S., Carter, C.,
Baca-Motes, K., Felicione, E., Sarich, T., et al. (2018).
Effect of a home-based wearable continuous ECG
monitoring patch on detection of undiagnosed atrial
fibrillation: The mSToPS randomized clinical trial.
JAMA, 320(2):146–155.
Velikova, M., van Scheltinga, J. T., Lucas, P. J., and
Spaanderman, M. (2014). Exploiting causal
functional relationships in Bayesian network
modelling for personalised healthcare. International
Journal of Approximate Reasoning, 55(1):59–73.
Wanyana, T. and Moodley, D. (2021). An agent architecture
for knowledge discovery and evolution. In Edelkamp,
S., M
¨
oller, R., and Rueckert, E., editors, KI 2021:
Advances in Artificial Intelligence, pages 241–256,
Cham. Springer.
Wanyana, T., Moodley, D., and Meyer, T. (2020). An
ontology for supporting knowledge discovery and
evolution. In Gerber, A., editor, Southern African
Conference for Artificial Intelligence Research
(SACAIR), pages 206–221.
Wasilewski, J. and Polonski, L. (2012). An introduction
to ECG interpretation. In Gacek, A. and Pedrycz,
W., editors, ECG Signal Processing, Classification
and Interpretation: A Comprehensive Framework of
Computational Intelligence, pages 1–20. Springer.
Wasmer, K., Eckardt, L., and Breithardt, G. (2017).
Predisposing factors for atrial fibrillation in the
elderly. Journal of Geriatric Cardiology, 14(3):179.
Weimann, K. and Conrad, T. O. F. (2021). Transfer learning
for ECG classification. Scientific Reports, 11(1):1–12.
ICT4AWE 2022 - 8th International Conference on Information and Communication Technologies for Ageing Well and e-Health
92
