
A Bayesian Network for the Analysis of Traffic Accidents in Peru
Willy Ugarte
a
, Manuel Alcantara-Zapata, Leibnihtz Ayamamani-Choque, Renzo Bances-Morales
and Cristian Cabrera-Sanchez
Universidad Peruana de Ciencias Aplicadas (UPC), Lima, Peru
Keywords:
Probabilistic Graphical Model, Bayesian Network, Graph Learning, Traffic, Accidents.
Abstract:
Traffic accidents are a problem that affects the State and society, because they cause material damage, injuries
and even the death of a person. This has led countries such as China, Switzerland and Australia to carry out
studies using Bayesian networks to determine the main causes and, based on them, propose measures to reduce
the number of traffic accidents. Following this trend, we, without having any expert knowledge on the subject,
decided to analyze the data of traffic accidents on the Pan-American Highway in Lima, Peru. This analysis
was done by means of directed graph learning with the Hill Climbing Search, Chow-Liu, K2, BIC and BDEU.
In addition, we used a Bayesian estimator to calculate the conditional probability distribution for our dataset.
This dataset contains observations from the years 2017 to 2019 and approximately 16 km of this highway.
Our results show that it is possible to identify the possible causes of excess accidents in specific areas of the
Pan-American Highway in certain shifts i.e., 32% of fatal accidents occur between 12 am and 7 pm in the
Rimac district and of these 20% are due to pedestrians on the highway.
1 INTRODUCTION
Traffic accidents are a problem that affects people and
societies. This is because it does not allow the Peru-
vian State to guarantee the life and physical integrity
of its people as indicated in the Peruvian constitution.
Furthermore, it causes material damages, injuries and
can even prematurely end a person’s life. The Na-
tional Institute of Statistics and Informatics (INEI)
indicates that the number of fatal vehicle accidents
throughout Peru reported from 2012 to 2019, is on
average 3,000. Additionally, according to the Min-
istry of Health (MINSA), the World Health Organiza-
tion (WHO), places Peru as the third country with the
highest mortality from vehicular accidents
1
.
Due to all the above, a method is required to an-
alyze this problem based on the dependence of prob-
abilities between variables that these accidents occur
in detail, considering variables and their specific val-
ues, in order to allow us make inferences and based on
the results of these, the citizens and the corresponding
authorities adopt the corresponding measures to pre-
vent these unfortunate events. Currently there are ma-
chine learning algorithms that allow predicting events
a
https://orcid.org/0000-0002-7510-618X
1
“8’929 accidentes de tr
´
ansito registra nuestro pa
´
ıs a
causa de la ebriedad del conductor” - MINSA - 2012
based on a set of data, which could contribute to this
problem, however these only provide a numerical or
nominal value as a result, other methods are required
to understand how the algorithm arrived to that con-
clusion and do not provide sufficient information to
adopt the corresponding measures to prevent these ac-
cidents (for example, knowing at what time the most
accidents are likely to occur in order to deploy more
traffic police officers).
A Bayesian Network (BN) is a probabilistic
graphical model (PGM) that is represented by a di-
rected acyclic graph (DAG) that depicts a set of vari-
ables and their conditional relationships. Bayesian
networks are perfect for forecasting the likelihood
that any one of numerous possible known causes con-
tributed to an event that occurred. A BN, for example,
could be used to illustrate the probability correlations
between weather and climate conditions. The net-
work may be used to calculate the chances of certain
weather being present based on cLimate conditions.
In Bayesian networks, efficient algorithms can do in-
ference and learning. The repercussions of highway
accidents can be characterized and assessed in terms
of accident severity, which can range from catas-
trophic events with fatalities to minor fender bender
damage. In most nations, official accident data exist
that categorize accidents according to severity using
the following simple scale: fatal accident, accident
308
Ugarte, W., Alcantara-Zapata, M., Ayamamani-Choque, L., Bances-Morales, R. and Cabrera-Sanchez, C.
A Bayesian Network for the Analysis of Traffic Accidents in Peru.
DOI: 10.5220/0011045900003191
In Proceedings of the 8th International Conference on Vehicle Technology and Intelligent Transport Systems (VEHITS 2022), pages 308-315
ISBN: 978-989-758-573-9; ISSN: 2184-495X
Copyright
c
2022 by SCITEPRESS – Science and Technology Publications, Lda. All rights reserved

resulting in serious injury, accident resulting in mi-
nor injury, and accident resulting in merely property
damage. The severity level is first defined when the
incidents are documented, and these basic classifica-
tions are not consistent between countries.
Our contributions are as follows:
• We develop a Bayesian Network obtain with the
Hill Climbing Search with Bdeu score and Chow-
Liu Algorithm with K2 score.
• We carry out experiments to demonstrate that it is
possible to identify that very serious accidents are
generated with greater probability in the sections
of the Pan-American Highway at a belonging to
different districts, in specific shifts, due to differ-
ent reasons and in different types.
Our work is structured as: in Section 2 presents
the related works. Then, Section 3 presents the
background of our approach and the structure of our
model. Afterwards, Section 4 presents the experimen-
tation and finally in Section 5, our conclusions.
2 RELATED WORKS
In (Deublein et al., 2015), the authors seek to predict
the rates of minor, serious and fatal accidents that will
occur on the road segments in Switzerland. They per-
form a multivariate regression analysis on the origi-
nal data to obtain a base model. To this model they
applied an algorithm called ”expectation - maximiza-
tion” to train the base model. And with this later
model they calculate the conditional probabilities of
the number of accidents per road segment. The pur-
pose of this Bayesian model is to identify the road
segments with the highest probability of accident oc-
currence for risk reduction.
In (Hongguo et al., 2010), the authors explain that
the vehicular traffic system is complex, since it has as
actors: people, vehicles, roads and the environment.
And a traffic accident is caused by alteration of one
of these components. The purpose of this paper is to
find, through a Bayesian network, the causality in ve-
hicular traffic accidents. The authors indicate that in
previous studies only a unitary analysis is made and
this can only reveal the inherent laws of traffic ac-
cident in a certain aspect, but does not contemplate
that the causality of traffic accidents is multidimen-
sional and there are correlations and logical relation-
ships between causality factors. To learn the Bayesian
graph, they used the K2 algorithm and the tool tool
that Matalab offers for working with BN.
In (Zou and Yue, 2017), the authors give a gen-
eral consideration of the factors affecting road safety
assessments, Bayesian network theory based on prob-
ability risk analysis is applied in the causality analy-
sis of road accidents. Taking as a case the Adelaide
Central Business District (CBD) in South Australia,
the structure of the Bayesian network was established
by integrating the K2 algorithm with the knowledge
of experts, and the Expectation-Maximization algo-
rithm was adopted that could process the missing
data to perform parameter learning, thus establishing
the Bayesian network model for the analysis of the
causality of traffic accidents. The results showed that
the Bayesian network model could effectively explore
the complex logical relationship in traffic accidents
and express the uncertain relationship between the re-
lated variables. Not only was the model able to quan-
titatively predict the probability of an accident under
certain traffic conditions, it can also find the key rea-
sons and worst-case combination that leads to the oc-
currence of an accident. Their results can provide the-
oretical support for urban road management author-
ities to thoroughly analyze the drivers of road acci-
dents and then lay the basis for improving the safety
performance of the urban road traffic system.
In (Makaba et al., 2021), the authors investigate
the cost-implications of road traffic collision factors
for the economy, and transport policies. They de-
velop a Bayesian network framework using real-life
road traffic collision data and expert knowledge to as-
sess the cost of road traffic collisions.
In the first work, an analysis focused on a specific
zone and evaluate where the most traffic accidents oc-
cur and provide improvement actions. The second
work motivate us to map the different actors we had in
the dataset to find causal relationships. In addition, it
motivate us to explore and test with more Bayesian
Network generation algorithms, not only K2. The
third work help us to emphasize finding the proba-
bilistic dependency relationships from the variables
to improve urban road safety management.
3 MATERIAL
In this section we present and explain the main con-
cepts that are used as the foundation of our work.
3.1 Preliminary Concepts
A Bayesian network is a probabilistic graphical model
that consists of a set of random variables and their
conditional dependencies represented by a directed
acyclic graph (cause-effect relationships). If a vari-
able has a parent node then it will have a table of con-
ditional probability. These graphs have as main appli-
A Bayesian Network for the Analysis of Traffic Accidents in Peru
309
cations: classification, diagnosis, among others. An-
other advantage is that we can generate the Bayesian
graphs without the complete dependence on field ex-
perts. This thanks to algorithms such as exhaustive
search, the K2 algorithm and Hill-climbing. The ba-
sis of the Bayesian network is Bayes’ formula (see
Equation (1)) for conditional probability:
P(H | D) =
P(H) × P(D | H)
P(D)
(1)
3.2 Methods
Now, we present some methods used to generate
Bayesian Networks from the data.
3.2.1 Hill Climbing Search
It is a mathematical optimization algorithm, whose
purpose is to find the best solution to a problem that
has a large number of possible solutions in a short
time, which is probably not the global optimal. Fig 1
depicts an elevation related to the goal function in a
one-dimensional state-space landscape. The objective
is to locate the global maximum. As indicated by the
arrow, hill-climbing search adjusts the existing condi-
tion in an attempt to enhance it. For our case, we are
seeking to maximize the score obtained for the graphs
generated during graph learning.
3.2.2 Chow-Liu Algorithm
It is a method that learns a Bayesian network with
a tree structure that maximizes the probability of the
training data. This algorithm uses the mutual infor-
mation, compute weight, between the events of the
variables by the Equation (2).
I(X, Y ) =
∑
x∈values(X)
∑
y∈values(Y )
P(x, y)log
2
P(x, y)
P(x)P(y)
(2)
Then it finds the maximum weight spanning tree,
which connects all vertices of a graph. And finally,
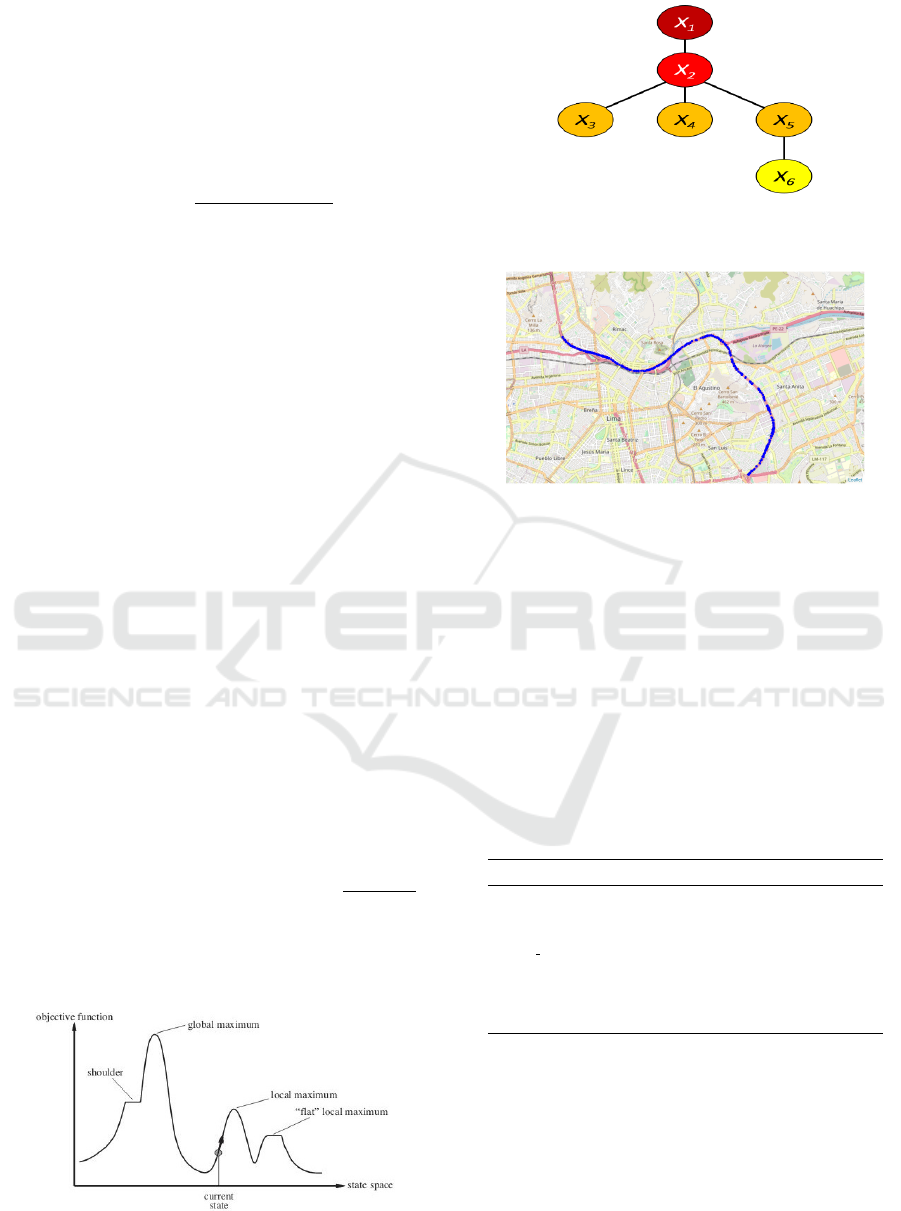
Figure 1: An overview of a one dimension function (Russell
and Norvig, 2020).
Figure 2: A first-order dependency tree representing the
product on the left (Chow and Liu, 1968).
Figure 3: Accidents that occur on the Pan-American High-
way at Lima.
it assigns the directions. Fig 2 depicts a first-order
dependency tree representing the product on the left.
3.3 Model
The data was obtained from the governmental open
data portals (see Section 4) which consists of traffic
accidents records that occurred at the Pan-American
Highway in Lima (i.e., material damage, injured vic-
tims and fatalities). Fig. 3 depicts these accidents with
blue dots. Table 1 shows the traffic accident variables.
Table 1: Variables related to car accidents in Peru.
Variable Description
Day Day of accident occurrence
Shift Shift corresponding to the time
Sense Direction in which a vehicle is traveling
Vehicles Involved Vehicles involved in the accident
Reason Cause of the accident generation
District District of the Lima region where it occurred
Type Type of accident that occurred
Severity Importance of an accident according to its effects
• Material Accidents: Fig. 4a depicts the count of
material accidents by their types. For instance,
the most common type of material accidents are
rear collision. Fig. 4b depicts the count of material
accidents by district.
• Accidents with Injuries: Fig. 5a depicts the
count of accidents with injuries by their types. For
instance, the most common type of material acci-
VEHITS 2022 - 8th International Conference on Vehicle Technology and Intelligent Transport Systems
310
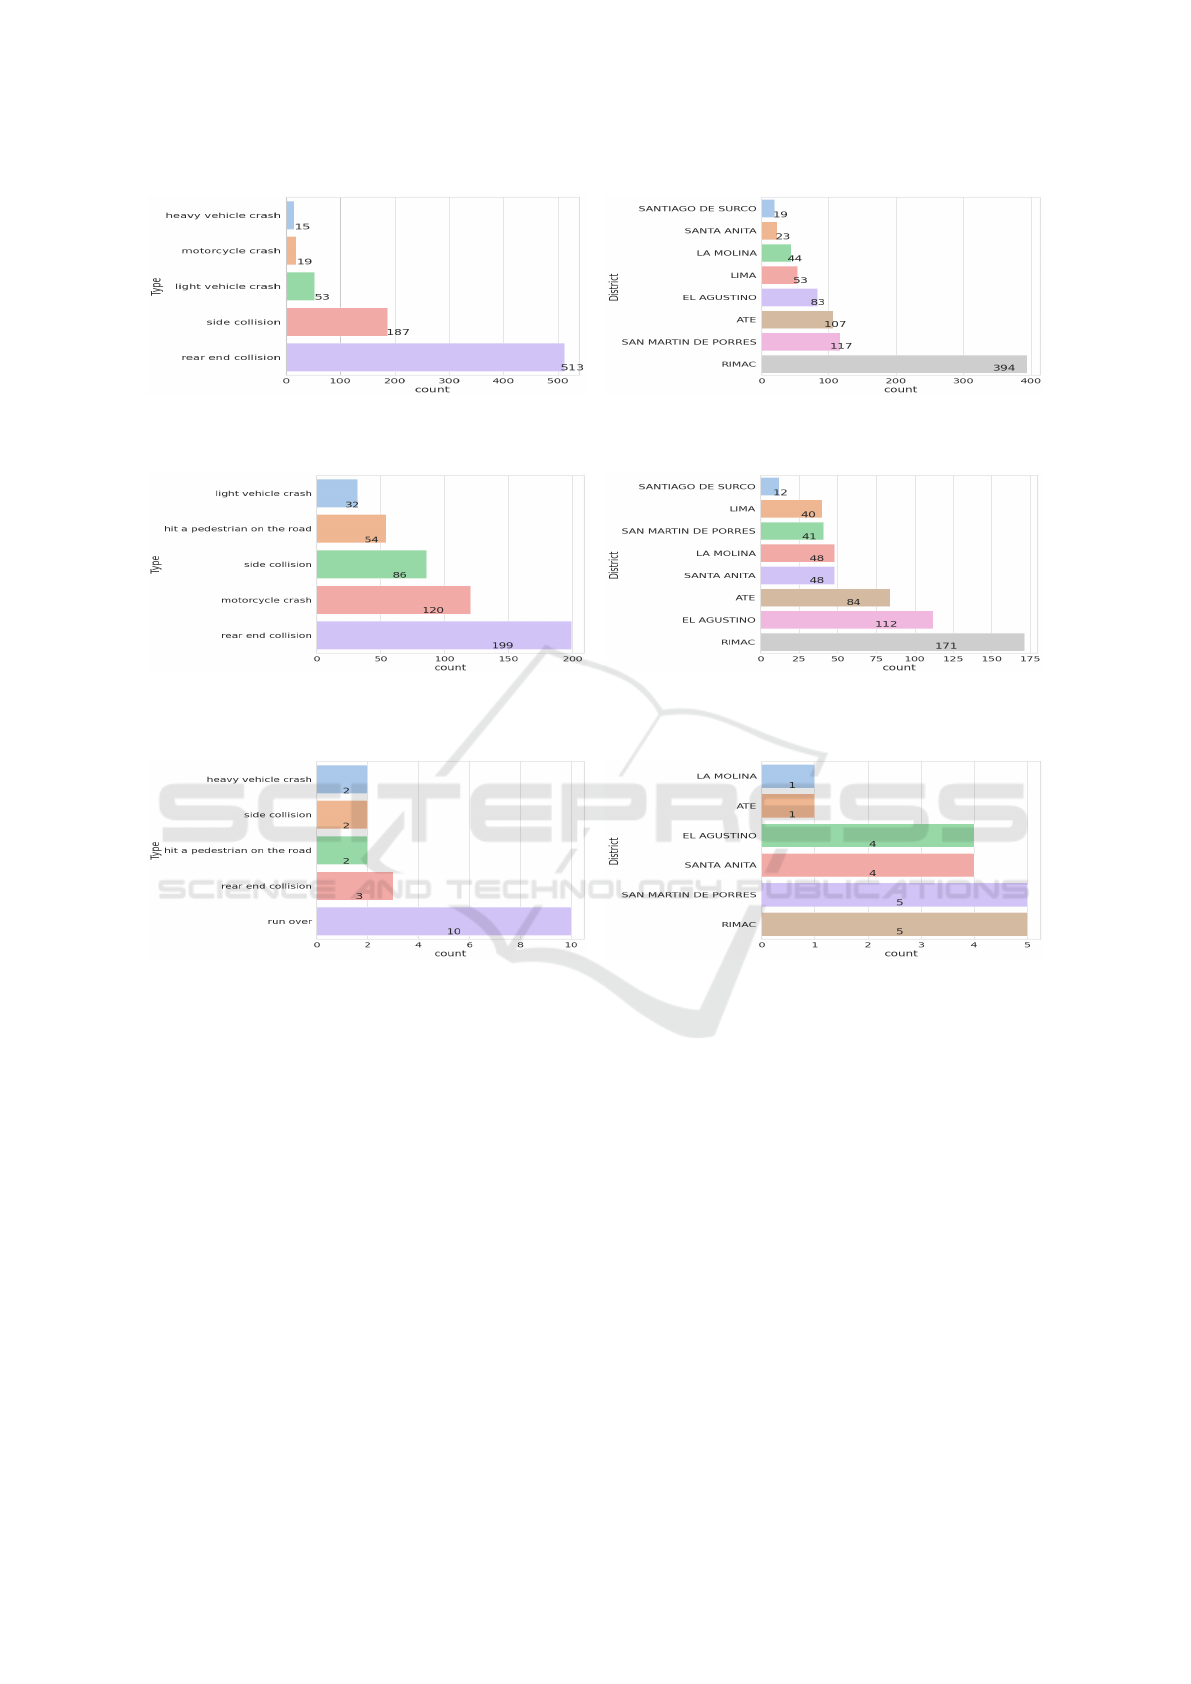
(a) Accident types. (b) Count of Accidents for Districts.
Figure 4: Material Accident Data related to car accidents in Peru.
(a) Accident types. (b) Count of Accidents for Districts.
Figure 5: Accidents with Injuries Data related to car accidents in Peru.
(a) Accident types. (b) Count of Accidents for Districts.
Figure 6: Deathly Accident Data related to car accidents in Peru.
dents are rear collisions or motorcycle collisions.
Fig. 5b depicts the count of accidents with injuries
by district.
• Deathly Accidents: Fig. 6a depicts the count of
deathly accidents by their types. For instance, the
most common type of deathly accidents are runs
over or rear collisions. Fig. 6b depicts the count
of deathly accidents by district.
3.3.1 Scores
Bayesian Information Criterion (BIC) (Schwarz,
1978) is a criterion for model selection among a finite
set of models; models with lower BIC are generally
preferred. It is based, in part, on the likelihood func-
tion. When fitting models, it is possible to increase
the likelihood by adding parameters, but it may result
in overfitting. BIC is formally defined as:
BIC = k ln(n) − 2 ln(
b
L). (3)
where :
b
L = the maximized value of the
likelihood function of the model M
x = the observed data
n = the sample size
k = the number of parameters
estimated by the model
K2 (Cooper and Herskovits, 1992) finds the struc-
ture that maximizes each factor of a BN. It is derived
by assuming uniform prior distributions on the values
of an attribute foreach possible instantiation of its par-
ent attributes. This assumption introduces a tendency
A Bayesian Network for the Analysis of Traffic Accidents in Peru
311

to select simpler network structures. The K2 metric is
formally defined as:
K2(B, T ) = log(P(B))+
∑
n
i=1
∑
q
i
j=1
log
(r
i
−1)!
(N
i j
+r
i
−1)!
+
∑
r
i
k=1
log(N
i jk
!)
where
B : a network
P(B) : represents the prior probability of the network B
T : data
r
i
: number of states of the finite random variable X
i
N
i jk
: number of instances in the data T where
the variable X
i
takes its k-th value x
ik
and
the variables in Π
X
i
take their j-th configuration w
i j
BDeu (Heckerman et al., 1995) is a special case of
BDe, where BDe means Bayesian Dirichlet scoring,
and, thanks to likelihood equivalence, yields the same
score for any two Markov equivalent structures given
D and a prior network from which the priors are de-
rived. For BDeu, they use uniform priors.
BDeu(B, T ) = log(P(B))+
∑
n
i=1
∑
q
i
j=1
log
Γ
N
0
q
i
Γ
N
i j
+
N
0
q
i
!
+
∑
r
i
k=1
log
Γ(N
i jk
+
N
0
r
i
q
i
)
Γ(
N
0
r
i
q
i
)
!!
where
B : a network
P(B) : represents the prior probability of the network B
Γ : theGamma f unction
T : data
r
i
: number of states of the finite random variable X
i
N
i jk
: number of instances in the data T where
the variable X
i
takes its k-th value x
ik
and
the variables in Π
X
i
take their j-th configuration w
i j
According to (Liu et al., 2012), BIC score can still
work well for large sample sizes, however it can per-
form arbitrarily worse than other functions for small
data sets. Additionally, according to (Riggelsen,
2008) the methodology for calculating the K2 score
is analogous to that of BDEu, however it differs in
that K2 makes use of a priori parameters equal to one.
4 EXPERIMENTATION
In this section we present our experimental study to
show the results of our study.
4.1 Experimental Protocol
For the development of our approach, we used the fol-
lowing resources:
1. Software: We develop our proposal with Python
3.7 with Google Colab Pro
2. Hardware: We use Google Colab Pro service
with SSD 125GB for storage, 24GB of RAM, a
GPU Nvidia
®
Tesla V100-SXM2 16 GB and a
CPU Intel
®
Xeon
®
CPU @ 2.20GHz
3. Dataset: We used the public dataset
from Municipality of Lima: https:
//aplicativos.munlima.gob.pe/extranet/
datos-abiertos/.
Our code is publicly available at: https:
//colab.research.google.com/drive/
1rpSPGnCQsWmUlYGZCnonOI20_7mPAiny?usp=
sharing
4.2 Results
The algorithms (see Section 3.2) and the scores (see
Section 3.3.1) are evaluated in order to determine the
best possible model for a BN.
4.2.1 BN Model
Hill Climbing Search: When applying the Hill
Climbing Search method (see Section 3.2.1), the fol-
lowing Bayesian networks were obtained with their
respective scores. Fig. 7a depicts the best BN ob-
tained with hill climbing algorithm for BIC score, as
we can see, it only considers three variables letting
aside the other ones. Hence it is not useful in prac-
tice, since the queries cannot be made over the vari-
ables that are not taken into account.
Fig. 7b (resp. Fig. 7c) depicts the best BN ob-
tained with hill climbing algorithm for K2 score (resp.
BDeu score), as we can see, it considers all five vari-
ables. Furthermore, Fig. 7b and Fig. 7c show that with
K2 score and BDeu scores obtain the same BN.
Chow-Liu Algorithm. When applying the Chow-
Liu algorithm (see Section 3.2.2), the following
Bayesian networks were obtained with their respec-
tive scores. Fig. 8a, Fig. 8b and Fig. 8c show that
all three scores (i.e., BIC score, K2 score and BDeu
score) obtain the same BN as a tree centered on “Ve-
hicles
Involved” variable.
4.2.2 Queries
Thanks to the Variable Elimination method (Zhang
and Poole, 1994), we can use the obtained BN models
to make inference queries.
Hill Climbing Search: We use the BN obtained by
hill climbing method with BDeu score (see Fig. 7c).
For instance, Table 2 shows the distribution for dis-
tricts knowing that the reason of an accident is an
animal on the road (i.e., Q
0
: P(District | Reason =
animal on the road)).
Now, we are going to make some queries with the
BN model according to the data:
VEHITS 2022 - 8th International Conference on Vehicle Technology and Intelligent Transport Systems
312

(a) BIC (-6007.599403466215). (b) K2 (-13910.791490413974) (c) BDEU (-11844.857478769678)
Figure 7: BN obtained with Hill Climbing for various scores.
(a) BIC (-28690.35418960265). (b) K2 (-14663.279955755112) (c) BDEU (-14703.524814010063)
Figure 8: BN obtained with Chow Liu Algorithm for various scores.
Table 2: Percentage values for query Q
0
.
District Percentage (%)
Rimac 32.2897
Ate 20.4259
El Agustino 14.9067
San Martin de Porres 12.7724
Santa Anita 7.0057
Lima 6.0446
La Molina 4.4526
Santiago de Surco 2.1024
Q
1
: P(District | Severity = deathly) , this query
helps to obtain the distribution of Districts knowing
that a deathly accident has happened. Table 3 shows
the distribution for this query, where we can pick the
first four districts according to their percentage (i.e.,
Rimac, El Agustino, ate and San Martin de Porres).
Table 3: Percentage values for query Q
1
.
District Percentage (%)
Rimac 31.2005
El Agustino 25.3065
ate 13.0754
San Martin de Porres 10.4243
Santa Anita 8.2161
Lima 5.6259
La Molina 4.8440
Santiago de Surco 1.3074
Q
2
: P
Reason, Type
Severity = deathly,
District = Rimac
, this
query helps to obtain the distribution of Reasons and
Types of accidents knowing that a deathly accident at
Rimac District has happened. Table 4 shows the dis-
tribution for this query, the main reasons and types
are pedestrian on the road, reckless driver with rear
collision and side collision.
Table 4: Percentage values for query Q
2
.
Reason Type Percentage (%)
pedestrian on the
road
hit a pedestrian on
the road
19.8853
reckless driver rear collision 18.5141
reckless driver side collision 8.3092
reckless driver hit a pedestrian on
the road
7.7709
pedestrian on the
road
run over 5.6028
Q
3
: P
Reason, Type
Severity = deathly,
District = El Agustino
,
this query helps to obtain the distribution of Reasons
and Types of accidents knowing that a deathly acci-
dent at El Agustino District has happened. Table 5
shows the distribution for this query, the main reasons
and types are pedestrian on the road, homeless on the
road that are runned over and reckless drivers.
A Bayesian Network for the Analysis of Traffic Accidents in Peru
313

Table 5: Percentage values for query Q
3
.
Reason Type Percentage (%)
pedestrian on the
road
hit a pedestrian on
the road
24.8418
homeless on the road run over 15.2892
reckless driver hit a pedestrian on
the road
10.1552
reckless driver rear collision 6.1704
reckless driver side collision 5.1654
Q
4
: P
Reason, Type
Severity = deathly,
District = ate
, this
query helps to obtain the distribution of Reasons and
Types of accidents knowing that a deathly accident at
ate District has happened. Table 6 shows the distri-
bution for this query, the main reasons and types are
pedestrian on the road, homeless on the road that are
runned over and reckless drivers.
Table 6: Percentage values for query Q
4
.
Reason Type Percentage (%)
pedestrian on the
road
hit a pedestrian on
the road
24.8418
homeless on the road run over 15.2892
reckless driver hit a pedestrian on
the road
10.1552
reckless driver rear collision 6.1704
reckless driver side collision 5.1654
Q
5
: P
Reason, Type
Severity = deathly,
District = San Martin de Porres
,
this query helps to obtain the distribution of Reasons
and Types of accidents knowing that a deathly
accident at ate District has happened. Table 7 shows
the distribution for this query, the main reasons and
types are pedestrian on the road, reckless drivers and
collisions.
Table 7: Percentage values for query Q
5
.
Reason Type Percentage (%)
pedestrian on the
road
hit a pedestrian on
the road
28.6446
reckless driver hit a pedestrian on
the road
10.4051
reckless driver rear collision 7.5471
pedestrian on the
road
run over 4.9270
reckless driver side collision 4.1947
Chow-Liu Algorithm: We use the BN obtained by
Chow-Liu Algorithm with K2 score (see Fig. 8b). For
instance, Table 8 shows the distribution for districts
and severity knowing that the reason of an accident is
a drunk driver.
Now, we are going to make some queries with the
Table 8: Percentage values for query P(District | Reason =
animal on the road).
Severity District Percentage (%)
mild Rimac 20.4145
serious Rimac 15.2064
mild Ate 9.1750
serious Ate 7.6141
mild San Martin de Porres 7.4299
mild El Agustino 7.0407
serious El Agustino 6.6580
serious San Martin de Porres 4.5564
serious La Molina 3.7086
mild Lima 3.5557
BN model according to the data:
Q
6
: P
Shi f t
Severity = deathly,
District = Rimac
, this
query helps to obtain the distribution of Shift know-
ing that a deathly accident at Rimac District has
happened. Table 9 shows the distribution for this
query, the main shift for accident is the afternoon.
Table 9: Percentage values for query Q
6
.
Shift Percentage (%)
afternoon 38.0837
morning 31.2627
night 21.8436
early morning 8.8099
Q
7
: P
Reason
Severity = deathly,
District = Rimac,
Shi f t = a f ternoon
,
this query helps to obtain the distribution of Reason
knowing that a deathly accident at Rimac District
at afternoon has happened. Table 10 shows the
distribution for this query, the main reasons are
reckless driver, pedestrian on the road and speeding.
Table 10: Percentage values for query Q
7
.
Reason Percentage (%)
reckless driver 44.7673
pedestrian on the road 21.2712
speeding 6.2850
mechanical / electrical problems 5.6429
previous accident 5.4414
Q
8
: P
Reason, Type
Severity = deathly,
District = Rimac,
Shi f t = a f ternoon
,
this query helps to obtain the distribution of Reason
and Type knowing that a deathly accident at Rimac
District at afternoon has happened. Table 11 shows
the distribution for this query, the main reasons are
reckless driver, pedestrian on the road and speeding.
VEHITS 2022 - 8th International Conference on Vehicle Technology and Intelligent Transport Systems
314

Table 11: Percentage values for query Q
8
.
Reason Type Percentage (%)
reckless driver rear collision 22.0395
pedestrian on the
road
hit a pedestrian on
the road
14.0416
reckless driver side collision 8.4765
reckless driver hit a pedestrian on
the road
5.9364
pedestrian on the
road
run over 4.3538
4.3 Discussion
The Q
1
query allowed us to identify the four districts
in which road sections have a higher probability of fa-
tal vehicle accidents. Based on these results, we carry
out queries Q
2
, Q
3
, Q
4
and Q
5
to infer the probabil-
ities for the reasons and types of accidents that these
fatal accidents occur in these four districts.
The results of the Q
1
query also helped us to de-
velop the last 3 queries, since it allowed us to detect
the section of the Pan-American highway belonging
to the Rimac district as the one with the greatest prob-
ability for fatal vehicle accidents, based on this, we
carry out query Q
6
, to infer the probabilities of the
shifts when these fatal accidents occur in the Rimac
district, resulting in the afternoon.
Based on the result of query Q
6
, we carry out
queries Q
7
and Q
8
that consider vehicular accidents
whose severities are fatal in the Rimac district that
occur in the afternoon, these queries let us identify
the reasons and types of accidents respectively. We
believe that these results will be of great relevance to
carry out preventive actions and thus reduce the num-
ber of these unfortunate accidents.
5 CONCLUSIONS
A Bayesian network was obtained with one of the
highest scores, using the Hill Climbing Search and
Chow Liu algorithm with K2 score- After carrying
out the experiments, it was possible to identify that
very serious accidents occur with a high probability
in the part of the Pan-American Highway belonging
to the Rimac district at the afternoon shift and due to
pedestrian on the road, a reckless driver or speeding.
It is recommended to place a greater police guard
in the part of the Pan-American Highway, belonging
to the Rimac district between 12 and 18 hours and to
carry out awareness campaigns in this area, in order to
reduce the speed of cars and thus reduce the number
of accidents with fatalities. Due to the fact that one of
the factors is speeding, a photo ballot systems with the
respective notice to drivers should be implemented.
Further works can be done with similar analysis of
other critical points in the country, for instance, find
other traffic problems by applying Markov chains,
for example variations in driving patterns, pose esti-
mation for road pedestrians (Fernandez-Ramos et al.,
2021) and looking if car sharing may help to decrease
the traffic accident rate (V
´
asquez-Garaya et al., 2021).
REFERENCES
Chow, C. and Liu, C. (1968). Approximating discrete
probability distributions with dependence trees. IEEE
Transactions on Information Theory, 14(3).
Cooper, G. F. and Herskovits, E. (1992). A bayesian method
for the induction of probabilistic networks from data.
Mach. Learn., 9:309–347.
Deublein, M., Schubert, M., Adey, B. T., and Garc
´
ıa de
Soto, B. (2015). A bayesian network model to pre-
dict accidents on swiss highways. Infrastructure Asset
Management, 2(4).
Fernandez-Ramos, O., Johnson-Ya
˜
nez, D., and Ugarte, W.
(2021). Reproducing arm movements based on pose
estimation with robot programming by demonstration.
In IEEE ICTAI.
Heckerman, D., Geiger, D., and Chickering, D. M.
(1995). Learning bayesian networks: The combina-
tion of knowledge and statistical data. Mach. Learn.,
20(3):197–243.
Hongguo, X., Huiyong, Z., and Fang, Z. (2010). Bayesian
network-based road traffic accident causality analysis.
In WASE ICIE.
Liu, Z., Malone, B. M., and Yuan, C. (2012). Empirical
evaluation of scoring functions for bayesian network
model selection. BMC Bioinform., 13(S-15):S14.
Makaba, T., Doorsamy, W., and Paul, B. S. (2021).
Bayesian network-based framework for cost-
implication assessment of road traffic collisions. Int.
J. Intell. Transp. Syst. Res., 19(1):240–253.
Riggelsen, C. (2008). Approximation Methods for Efficient
Learning of Bayesian Networks, volume 168 of Fron-
tiers in Artificial Intelligence and Applications. IOS
Press.
Russell, S. J. and Norvig, P. (2020). Artificial Intelligence:
A Modern Approach (4th Edition). Pearson.
Schwarz, G. (1978). Estimating the Dimension of a Model.
The Annals of Statistics, 6(2):461 – 464.
V
´
asquez-Garaya, J. P., Munayco-Apolaya, E., and Ugarte,
W. (2021). Carsharing system for urban transport in
lima using internet of things. In WEBIST.
Zhang, N. L. and Poole, D. L. (1994). A simple approach
to bayesian network computations. In Canadian AI.
Zou, X. and Yue, W. (2017). A bayesian network approach
to causation analysis of road accidents using netica.
Journal of Advanced Transportation, 2017.
A Bayesian Network for the Analysis of Traffic Accidents in Peru
315
