
Predicting Mortality Risk among Elderly Inpatients with Pneumonia: A
Machine Learning Approach
Victor Monteiro Silva, Damires Yluska De Souza Fernandes and Alex Sandro Da Cunha R
ˆ
ego
Federal Institute of Para
´
ıba, Jo
˜
ao Pessoa, Brazil
Keywords:
Data Analysis and Prediction, CAP, Probability of Death, ROC Curve, AUC.
Abstract:
Community-acquired Pneumonia (CAP) is a serious respiratory infection that can cause life-threatening risk
in people of different ages, especially in elderly inpatients. Regarding this age group, mortality rates by CAP
still can reach 30% of all respiratory causes of death. In this work, we propose a machine learning approach to
predict mortality risk among elderly inpatients with CAP. The approach uses real world data of elderly people
with CAP from a hospital in Brazil, collected from 2018 to 2021. Based on patients data as learning features,
our approach is able not only to classify patients at risk of mortality during hospitalization, but also to estimate
the probability concerning the prediction. Some classification models have been examined and, among them,
the best performance in terms of Area under ROC Curve (AUC) value has been achieved by the Logistic
Regression (LR) classifier (AUC=0.81). Accomplished results show that the presented approach outperforms
CURB-65 score as baseline in terms of both AUC values and probability of patient death. Besides, our
approach is able to output probabilities ranging from 50 to 99% w.r.t. positive classification, i.e., patients that
may come to death. A statistical test confirms that the presented approach outperforms the baseline provided
by the CURB-65.
1 INTRODUCTION
Community-acquired Pneumonia (CAP) is a serious
respiratory infection that can cause life-threatening
risk in people of different ages (World Health Organi-
zation, 2015). As one of the most common infections
that result in the need of hospitalization, it may in-
flame the air sacs in one or both lungs, affect other
vital organs and cause difficult breathing. Cases of
patients diagnosed with CAP are considered hard to
deal with and it is more likely to have complications
in this kind of disease if a patient is an older adult,
a very young child, or if s/he has a weakened im-
mune system, or a serious medical problem like di-
abetes or cirrhosis (Wu et al., 2019). Despite ever
growing better health-care access, with not only med-
ical science progress but also specialized units and so-
phisticated life-support systems, CAP mortality rates
still can reach 30% of all respiratory causes of death
mainly with regards to elderly inpatients (Hespanhol
and B
´
arbara, 2020). Indeed it may be particularly
severe in people ages 65 years or older, implying in
a higher mortality risk when compared to other age
groups.
Continuously analyzing patient data is a common
task for health professionals to make decisions re-
garding treatments. However, identifying relevant in-
formation from the data is sometimes a challenging
task (Bezemer et al., 2019). This process can also
be time consuming, since it usually requires consid-
ering medical imaging exams, laboratory results, vi-
tal signs, patient history and also medical annotations.
These data are often scattered throughout the hospital
systems and databases (Wiemken et al., 2017).
To help matters in the decision making of health
professionals, some medical scores have been de-
fined and used. Regarding pneumonia treatments,
two scores are commonly used, namely (Long et al.,
2017): Pneumonia Severity Index (PSI) and CURB-
65. Both scores provide a preliminary method for in-
patient mortality prognoses, giving the medical team
an alert based on Electronic Medical Record (EMR)
data (Ryan et al., 2020). Nevertheless, these medical
scores lack efficiency for individual patient-level de-
cision making, since they only provide an estimate up
to 27% of chance of patient mortality. This may be
due to the fact that the score results only consider the
current state of EMR data of a given patient, exclud-
ing his/her treatment evolution itself. Also it does not
344
Silva, V., Fernandes, D. and Rêgo, A.
Predicting Mortality Risk among Elderly Inpatients with Pneumonia: A Machine Learning Approach.
DOI: 10.5220/0011043300003179
In Proceedings of the 24th International Conference on Enterprise Information Systems (ICEIS 2022) - Volume 1, pages 344-354
ISBN: 978-989-758-569-2; ISSN: 2184-4992
Copyright
c
2022 by SCITEPRESS – Science and Technology Publications, Lda. All rights reserved

take into account other patient examples with similar
conditions in terms of general symptoms, signs, prog-
noses and progressions (Wiemken et al., 2013).
In this work, we aim to consider in what ways
could a predictive analytical model help to address
inpatient mortality risk problem in CAP cases. To
this end, two aspects should be taken into account
(Pourhomayoun and Shakibi, 2021): (i) the large and
increasing volume of historical patient data, and (ii)
the generation and usage of a model that generalises
beyond the dataset in such a way that it may assist
health professionals to make more assertive decisions
on inpatients treatments. In this scenario, we de-
fine two main research problems that have guided our
work: (i) How to identify elderly inpatients diagnosed
with CAP at risk of death? And, in addition, (ii) how
to provide the probability that such prediction may in-
deed occur?
In this sense, we propose a supervised learning ap-
proach to predict mortality risk with respect to elderly
inpatients with CAP. Based on patients EMR data as
learning features, our approach is able to classify pa-
tients at risk of mortality during hospitalization. In
addition, it can estimate a probability of inpatients
come to death, by means of a range from 50% to 99%
w.r.t. positive classification (patients that do not sur-
vive). The approach uses real world data of elderly
people with CAP from a hospital in Brazil, which
were collected from 2018 to 2021 and prepared for
usage in this work. We evaluate our approach under
two aspects: (i) particularly analysing Receiver Op-
erating Characteristic (ROC) curves, which are used
in medicine to determine diagnostics effectiveness of
classification models, and (ii) by computing ROC’s
Area Under the Curve (AUC), which provides the
overall performance of the most critical classification
in this work (patients classified as at risk of death).
Accomplished results show that the presented ap-
proach outperforms CURB-65 score as baseline both
in terms of AUC and of the obtained probability for
risk of death. Results also bring to attention a time
limit of hospitalization that hugely increased the prob-
ability of death, considering some chronological mea-
surements of inpatients.
Our contributions are summarized as follows: (i) a
relevant dataset built based on different factors corre-
lated to pneumonia, including some features extracted
from medical annotations; (ii) an approach using ma-
chine learning algorithms for analyzing and predict-
ing risk of death in elderly inpatients with CAP; (iii)
a baseline built based on a real medical score (CURB-
65); (iv) a comparative evaluation between the com-
putational version of a baseline and the best achieved
classification model using ROC curves; (v) a statisti-
cal significance test, which confirms that our predic-
tive model outperforms the baseline; and (vi) a data
analysis w.r.t. a patient chronology regarding results
achieved by the best classifier.
This paper is organized as follows: Section 2
provides some theoretical background; Section 3 de-
scribes some related works; Section 4 introduces as-
pects of the research methodology applied in this
work; Section 5 presents the proposed approach with
the experimental evaluation accomplished and results.
Section 6 concludes the paper and points out some fu-
ture work.
2 THEORETICAL BACKGROUND
CAP is a form of intense respiratory infection that af-
fects the lungs. This can lead to symptoms such as
cough and shortness of breath. In severe cases, hospi-
talization is rather recommended (World Health Orga-
nization, 2015)(Long et al., 2017). Particularly, there
are some reasons why CAP can be more severe in
older adults (World Health Organization, 2015): im-
mune system naturally weakens as people age and
older adults are more likely to have chronic health
conditions, such as heart diseases, what can increase
their risk for pneumonia. In order to improve patient
care and management regarding CAP, medical profes-
sionals make use of inpatient risk scores.
A number of pneumonia severity scores have been
described in the literature (Chen et al., 2010)(Long
et al., 2017). Severity scores are important to ascer-
tain, for instance, safety criteria to discharge/admit
patients and time to remain in an Intensive Care Unit
(ICU) (Webb and Gattinoni, 2016). These scores sup-
port clinical decision-making in a variety of scenarios
and can be found in the literature to calculate the prob-
ability of morbidity and mortality among inpatients
with pneumonia. The scores most commonly used are
the CURB-65 and PSI (Long et al., 2017)(Chen et al.,
2010). Both PSI and CURB-65 use data from patient
medical records, such as laboratory results, vital signs
and demographic data, in order to estimate mortality
or even help determining inpatient versus outpatient
treatment. To this end, they provide some categories
of risk, based on the score calculation discussed in the
following (Long et al., 2017)(Chen et al., 2010).
The CURB-65 scores range from 0 to 5 and in-
cludes points for each one of the following criteria,
namely (Webb and Gattinoni, 2016): patient has con-
fusion (defined by a mental test score); blood urea >
20 mg/dL; respiratory rate ≥ 30 breaths/min; blood
pressure (systolic < 90 mm/Hg, or diastolic ≤ 60
mm/Hg) and age ≥ 65 years. Clinical management
Predicting Mortality Risk among Elderly Inpatients with Pneumonia: A Machine Learning Approach
345

decisions can be made based on the resulting score,
which is achieved according to the following punctu-
ation marks (Webb and Gattinoni, 2016):
1 point: probably suitable for home treatment;
low risk group: 2.7% mortality risk.
2 points: consider hospital supervised treatment;
Moderate risk group: 6.8% mortality risk.
3 points: Consider ICU admission; Severe risk
group: 14.0% mortality risk.
4 - 5 points: Consider ICU admission; Highest
risk group: 27.8% mortality risk.
The PSI medical score uses similar score points as
CURB but it also includes additional features such as
gasometry exam results. Management based on PSI is
quite similar to CURB 65, although it provides some
specific rules to ages above 50.
Although widely used and indeed useful, these
scores only consider current EMR data of a given in-
patient. It does not take into account other points such
as the treatment evolution itself as well as examples
of other similar cases and their prognoses (Wiemken
et al., 2013). It may be rather important to consider
not only the whole patient health history and his/her
clinical stability, but also his/her individual risk fac-
tors for severe diseases, such as the case of pneumo-
nia (Chen et al., 2010)(Long et al., 2017)(Wiemken
et al., 2013).
Machine Learning (ML) provides computational
and statistical methods to automatically acquire
knowledge from data (Alpaydin, 2016). Solutions
based on ML are developed from a carefully prepared
dataset and commonly are performed by supervised
or unsupervised learning methods. The value of ML
in healthcare comes from its ability to process large
amount of health care data to extract clinical insights
that may be helpful to medical decision-making. Re-
cent works exploring ML methods point out that pre-
dictive models have the potential for identifying high
risk patients under some conditions (Pourhomayoun
and Shakibi, 2021)(Ryan et al., 2020)(Tuti et al.,
2017)(Wiemken et al., 2017)(Wu et al., 2014). (Al-
paydin, 2016)(Michalski et al., 2013).
Measuring the results of ML algorithms is an es-
sential part of any work in this area. There are sev-
eral metrics for evaluating performance of a predic-
tive model according to different points of views or
needs. Diverse analyses may be accomplished de-
pending on the problem, domain and application at
hand. Thus, sometimes considering only one mea-
sure to evaluate is not adequate for a given purpose
(Hossin and Sulaiman, 2015). For instance, for imbal-
ance class problems, accuracy becomes a poor evalu-
ation measure since it may lead to erroneous conclu-
sions because the model learning tends to classify the
majority class.
Receiver Operator Characteristics (ROC) is a
bi-dimensional graph commonly used in ML sce-
narios to analyze and compare classifiers perfor-
mance. It displays the trade-off between True Posi-
tive Rate (TPR)(sensitivity) versus False Positive Rate
(FPR)(100 - specificity) at various threshold settings.
The higher the ROC passes through the upper left
corner, the better the model is able to output correct
predictions. On the other hand, the closer the curve
comes to the 45-degree diagonal (in the lower right
triangle) of the ROC space, the less accurate the test.
In medicine, ROC curve plays an important role for
clinical decisions towards confirming or not a diag-
nostic test.
ROC curve provides a way to summarize all of
the prediction model information with a focus on the
positive class, i.e., the one which is usually object of
interest. From a ROC curve it is also possible to ex-
tract the Area Under the Curve (AUC), which quan-
titatively summarizes the ML model performance in
the ROC space to a single scalar value, thus enabling
to make comparisons among resulting models. AUC
takes values from 0 to 1, where value 1 means a per-
fect classifier which is able to distinguish between
all positive and negative class points whereas a value
near 0 means a classifier with no ability to discrim-
inate the classes. Decision making in the medical
community has an extensive literature on the use of
ROC curves for diagnostic testing (Fawcett, 2006). In
recent years, there has been an increasing usage of
ROC curves by the ML community, due in part to the
observation that only simple classification accuracy is
often a poor metric for measuring performance of pre-
dictive models (Fawcett, 2001)(Fawcett, 2006).
3 RELATED WORKS
Machine Learning techniques have been used in liter-
ature to predict mortality risk on patients diagnosed
with pneumonia and similar respiratory infections.
Some of them are described in the following.
The work of (Wiemken et al., 2017) presents a
prediction model of 30-day post discharge mortality
on patients diagnosed with pneumonia. The dataset
contains a variety of inpatient EMR data, including
hourly measurements of vital signs and patient health
history. The dataset includes adult patients with no
specific age restriction. Experiments show that Na
¨
ıve
Bayes classifier has the best predictive performance
for the scenario at hand. Results have been evalu-
ated based on a comparison of performance in terms
ICEIS 2022 - 24th International Conference on Enterprise Information Systems
346

of AUC between this work with other related ones.
Results indicate an AUC of 0.832 which is better than
the compared previous works. This work does not
establish a different or actual baseline for compari-
son. It also suggests as limitation that it is important
to evaluate other kinds of features related to pneumo-
nia treatments and also other modeling approaches to
improve clinical outcomes.
The XGBoost classifier is evaluated in the work
of (Ryan et al., 2020). This work predicts in-hospital
mortality up to 72 hours from admission, with focus
on data of inpatients on ICU diagnosed with pneu-
monia, COVID-19 or mechanically ventilated. The
prediction models use datasets of patient records col-
lected every 3 hours. The results are compared with
mortality risks scores as baselines in classifying pa-
tients (qSOFA, MEWS(Long et al., 2017) and CURB-
65). Despite presenting AUC values for each risk
score at 12-, 24-, 48-, and 72- hour time windows,
the work does not provide details regarding the cal-
culation of AUC using the dataset features. Results
show the XGBoost classifier surpassing the defined
baselines with AUC values of 0.82. 0.81, 0.77 and
0.75 for mortality prediction at 12, 24, 48, and 72
hour time windows. This work focus on a predic-
tive model, which is limited for anticipating patient
mortality at specific time points of treatment up to 72
hours. Learning features are restricted to laboratory
results and vital signs.
In (Pourhomayoun and Shakibi, 2021), the au-
thors also employ supervised classifier algorithms to
predict mortality risk, with focus at triage phase of
incoming patients with COVID-19. The dataset in-
cludes a total of 112 features of patient EMR data.
The main contribution presented by the authors is a
feature selection process based on a filter method,
highlighting hypertension and age as the most rele-
vant features. The best performance model, obtained
by the Random Forest classifier, provided an AUC of
0.94 and a probability for positive classification of up
88%. This work is limited to triage patients and does
not present a specific baseline, such as state of the art
mortality risk scores. Models results are analysed and
compared to each other.
The work of (Tuti et al., 2017) has undertaken a
retrospective cohort using clinical characteristics and
common comorbidities, w.r.t. increasing risks of in-
patient mortality. This work focus on children aged
2–59 months which were admitted with a clinical di-
agnosis of pneumonia. The evaluated models demon-
strate moderate good performance, with the classifica-
tion algorithm Partial Least Squares classifier achiev-
ing an AUC of 0.75. Results show that elevated res-
piratory rates, age ranging from 2 to 11 months and
weight-for-age are important features indicating mor-
tality of inpatients. The work findings support the
need for re-evaluation of the guidelines for non-severe
pneumonia, specifically among infants and in popula-
tions where comorbidities are common.
Important points may be discussed from these
works. All of them highlight the need to evaluate ad-
ditional features beyond the ones used in their works
in order to try improving predictive models. They fo-
cus on mortality prediction w.r.t. different steps of
CAP treatment (e.g., 30 days post discharge, triage
process or 72 hours of diagnosis). Related works
present studies which cover different inpatient groups,
such as the ones categorized by age or by the need
of hospitalization in ICUs. A common limitation
shared in all the works is the absence of a consoli-
dated or actual baseline to analyse prediction model
results. While some works propose a baseline eval-
uation method (Ryan et al., 2020)(Wiemken et al.,
2017), no similar description is provided by others.
Thus, comparing these works with ours, we may point
out some different aspects as follows:
Our approach focuses on a specific scenario re-
garding elderly inpatients diagnosed with pneu-
monia;
The collected and prepared dataset also includes
entry features unique to this study extracted from
medical and nursing annotations of patients and
their family health history;
Results include analysis of positive classification
probability;
Comparative analysis performance and statistical
test are conducted regarding a learned classifier in
comparison with a baseline that is a computational
implementation of the CURB-65 score.
4 RESEARCH METHODOLOGY
Diverse data science methodologies have been pro-
posed and used to approach business or research
problems (Luo et al., 2021). In this work, we use
the CRISP-DM (Cross Industry Standard Process for
Data Mining) (Wirth and Hipp, 2000) as a base
methodology, since it is one of the most used so far
(Schr
¨
oer et al., 2021). Regarding the health data do-
main at hand, we have tried to consider some particu-
lar issues discussed in the following. Thus, in this sec-
tion, we describe the applied methodology, which in-
cludes steps provided by the CRISP-DM process and
also specific steps taken into consideration given this
data domain. To this end, we keep in mind the classi-
fication problem of this work. Then we present some
Predicting Mortality Risk among Elderly Inpatients with Pneumonia: A Machine Learning Approach
347

particular points and a rationale for the features and
baseline used. We also discuss some aspects related
to how evaluate results given the context of this work.
4.1 Classification for Death Risk
The risk of mortality from CAP is still a challenge
faced by medical teams. This is an even more rele-
vant issue w.r.t. elderly patients, since they are a criti-
cal group with increased chances of health complica-
tions. Given this context, this work proposes the use
of ML based on the CRISP-DM methodology to ana-
lyze and predict risk of death w.r.t. elderly inpatients
with CAP. We deal with the problem of predicting
mortality risk of inpatients with CAP as a binary clas-
sification problem. According to some related works
research and also to domain specialists, some features
that may be related to the death rate due to pneumo-
nia of elderly inpatients have been selected. We define
our classification problem as follows.
Suppose that D
train
:= {(~x
i
,y
i
),...,(~x
n
,y
n
)} with
i = 1, . . . , n is a training set, where ~x
i
are the feature
vectors representing the instances in the feature space
X ∈ R
m
, and y
i
denotes the class label to which~x
i
be-
longs to in the set of label for positive (+) and nega-
tive (−) classes. The positive class represents the risk
of an elder inpatient dying during hospitalization and
the negative class indicates the absence of risk. Thus,
the purpose of this work is to learn a classification
function
f : (~x
i
,y
i
) → {+,−}
that classifies any given instance on an independent
test set D
test
(not used during training phase) as posi-
tive if there is risk of mortality; or negative, otherwise.
The prediction function f must minimize the error on
D
test
. It also estimates a probability P of instances in
D
test
belonging to the predicted class, in a continuous
interval [0...1] .
4.2 Mortality Risk Score
Some assessment tools for evaluating the severity of
pneumonia are indeed used in clinical practice. This
is helpful since they assist medical decisions on man-
aging outpatient versus inpatient settings in order to
optimize hospital referral and lower hospital admis-
sion (Pourhomayoun and Shakibi, 2021)(Ryan et al.,
2020). Thus, bringing the way in which those as-
sessments are performed in clinical practices to the
light of an experimental computational evaluation
may produce a more assertive solution.
The reality of the hospital in Brazil that gave rise
to this research includes the use of panels with indica-
tions based on the CURB-65 score. Therefore, medi-
cal professionals take these indications into account in
their decisions regarding inpatients with pneumonia.
Another score also used is the PSI. However, since
data from patients’ gasometry exams are not available
from the mentioned hospital, it has not been possible
to evaluate the PSI score in this work. Therefore, we
focus on understanding and applying the CURB-65
score as a baseline to this study.
The CURB-65 score usage is twofold: (i) it has
been used to define the features that should be in-
cluded in the built dataset; and (ii) it has been chosen
to build a computational representation of the score
as a baseline, according to calculation rules depicted
in Section 2. Regarding the former, in addition to
data used in the CURB-65 measurement, other fea-
tures have been acquired or even extracted according
to suggestions from domain specialists and also pro-
vided by some data understanding. For instance, data
w.r.t. patients family health history have also been
included. These aspects are presented in the next sec-
tion.
5 PROPOSED APPROACH
In this section, we present our approach for predict-
ing the risk of death among elder inpatients with CAP.
At first, we describe the dataset built and used in our
experiments and the tasks which have been accom-
plished for its preparation. Then, we make some re-
marks w.r.t. the experimentation scenario, developed
baseline and evaluation. In the end, we provide some
obtained results and some analyses regarding them.
5.1 Dataset Preparation
The dataset collected from a hospital in Brazil is com-
posed by electronic medical records of patients with
CAP. Data were gathered from 2018 to 2021, result-
ing in 64.160 measurement records of 461 elderly pa-
tients diagnosed with CAP. Each record contains fea-
tures that represent measurements of vital signs and
laboratory results, taken usually every 3 hours. Per-
sonal data of patients were made anonymous during
data extraction in order to preserve their privacy.
Based on the CRISP-DM steps (Wirth and Hipp,
2000), data preparation tasks on the originally col-
lected dataset have been performed. To this end,
the temporal condition of taking measurements of pa-
tients was considered, as well as aspects related to the
completeness and correctness of the overall data. The
data preparation tasks are described as follows.
a) Data Selection: Due to the pandemic of COVID-
19 and, since data collected at the hospital included
ICEIS 2022 - 24th International Conference on Enterprise Information Systems
348

the period between 2019 and 2021, data initially also
contained examples of pneumonia associated with
COVID-19. Based on discussions with medical pro-
fessionals, which are our domain specialists, it has
been decided to not consider data specific to pa-
tients with COVID-19. This is due to the fact that
there are still a lot of misunderstandings and learn-
ing around the COVID-19 infection and its associa-
tion with pneumonia and, particularly, CAP. In order
to not disturb the current research, these particular ex-
amples have not been considered at data selection.
Features have been mainly defined according to
the data needed for calculation of the CURB-65
Score. In addition, domain specialists recommended
the inclusion of data provided by patients comorbidi-
ties and family health histories. This is rather impor-
tant since some hereditary diseases could be related
to patient conditions and thus might require closer at-
tention during CAP treatment. Other features have
also been considered based on limitations provided
by some examples discussed in related works, such
as the patient family history. Some of them pointed
out not so good results due to lack of some attributes,
as discussed, for instance, by (Wiemken et al., 2017)
in Section 3.
Thus, a set of 30 features has been selected as rel-
evant for the prediction problem at hand, as shown
in Table 1. They are categorized as follows: de-
mografic, vital signs, laboratory results, comorbidi-
ties, or family health history. Numerical features ob-
tained from patients EMR include: age, hospitaliza-
tion time (measured in hours), pulse, respiratory fre-
quency, systolic blood pressure, dyastolic blood pres-
sure, temperature, urea nitrogen, sodium, glucose and
hematocrit. The categorical features obtained repre-
sent the presence or absence of a certain condition
w.r.t. a that patient in a given time. Categorical fea-
tures are as follows: Nursing home resident, smok-
ing history, altered mental state, mechanical venti-
lation, neoplastic disease, congestive heart failure,
cerebrovascular disease, kidney disease, liver disease,
cronicle pulmonary disease, cardiovascular disease,
psychiatric disease, neurologic disease. In the same
way, a feature such as family health history brings
cases of diseases which may also be relevant to com-
prehend a patient diagnosis and evolution (e.g., a neu-
rologic disease). Gender is a categorical feature, but
its classification is 0 for male and 1 for female pa-
tients as a means of standardization. The understand-
ing of some features and their implications in CAP
treatment are not trivial for non-medical people. Nev-
ertheless, as shown in Table 1, features used to build
the dataset regard health conditions related to inpa-
tients with CAP. Medical details regarding each one
Table 1: Features of the dataset and their categories.
Category Feature
Demographic
Data
Age
Gender
Nursing home resident
Smoking History
Vital Signs
Hospitalization Time(Hours)
Pulse(bpm)
Respiratory frequency(bpm)
Systolic blood pressure(mmHg)
Dyastolic blood pressure(mmHg)
Temperature(°C)
Altered mental state
Mechanical ventilation
Laboratory
Results
Urea nitrogen(mg/dl)
Sodium(mmol/l)
Glucose(mg/dl)
Hematocrit(%)
Comorbidities
Neoplastic Disease
Congestive Heart Failure
Cerebrovascular disease
Kidney disease
Liver disease
Cronicle Pulmonary disease
Cardiovascular disease
Psychiatric disease
Neurologic disease
Family
History
Neoplastic Disease
Cardiovascular Disease
Neurologic disease
Psychiatric disease
of the conditions are out of this scope.
b) Missing Values: In order to input values for miss-
ing individual patient measurements, we have defined
the usage of the average of existing values grouped by
a patient identification. Average based construction
has been chosen because it disregards outliers and has
the least impact on feature values distribution (Hastie
et al., 2017). There have been no missing values for
the categorical features.
c) Data Extraction for Categorical Features: At
hospital, on an initial evaluation of a given patient,
the medical and nursing staff fill in an electronic form
related to his/her anamnesis. To this end, they select
preexisting diseases and/or family health history con-
ditions based on a reference background provided by
the hospital (i.e., a semantic dictionary composed by
Predicting Mortality Risk among Elderly Inpatients with Pneumonia: A Machine Learning Approach
349

medical disease terms). Described terms along with
some textual descriptions are stored in a specific tex-
tual field within the hospital’s database. Considering
this rich information, some categorical binary features
have been extracted in order to provide added fea-
tures. The rationale used to this end is the following:
given a patient set of information provided by a tex-
tual field (annotation), if a term, provided by the hos-
pital dictionary, is included in the text, then that term
is made a feature of the dataset. This terms follow a
pattern of identification used by all the hospital team.
Thus, if a patient’s annotation contains a given term,
which is considered a feature of the specified dataset,
its value is set as present (1), otherwise it is defined
as absent (0). For instance, if a patient annotation
contains the term ”Chronicle Pulmonary disease”, its
namesake feature is set as 1.
Regarding mechanical ventilation and altered
mental states, their specific features have been ex-
tracted from a boolean field of the hospital database
and set on the dataset based on the same method de-
scribed before: value 1 if the term is present or value
0, otherwise.
d) Labelling: The class labels have been derived ac-
cording to the following rationale: patient examples
which have information regarding the time and cause
of their death related to CAP have been labelled with
1 (deceased). Otherwise, patients that remained alive
after hospitalization from CAP have been labeled as
0 (survived). After finishing the labelling process and
the data preparation tasks described, with respect to
the target variable, the dataset is summarized as fol-
lows: 43% of positive examples (27,306) and 57% of
negative examples (36,854) . This scenario represents
the real proportion of data for the period considered
at data extraction time.
5.2 Experimental Evaluation
We have conducted some experiments and analyses in
the light of our approach. The main experiment has
been defined aiming to compare some classification
algorithms applied to the intended prediction model
at hand. To accomplish this, we have performed a ten
times stratified group 10-fold cross-validation (Hastie
et al., 2017) using all available data in order to mea-
sure the variability of the results. As usual, the models
have been induced on the train dataset and have had
their performance measured in a test dataset. In this
setting, we ensure that instances of the same patient
ID are not present in both training and test data, i.e.,
we avoid ID instance overlapping during training and
test.
The classification methods which have been ap-
plied in initial experiments were Random Forest (RF),
Support Vector Machine (SVM), Multi-Layer Percep-
tron (MLP) and Logistic Regression (LR). They have
been selected based on results and discussions pro-
vided by a systematic review of literature (Silva et al.,
2020). (Silva et al., 2020) has pointed out that those
classifiers were used at state-of-the-art researches re-
garding pneumonia scenarios due to their applicabil-
ity and efficiency. All the models have been trained
using the default parameters defined in the SciKit-
Learn library (G
´
eron, 2019).
As baseline we have chosen to implement a func-
tion that computes the risk of death according to the
CURB-65 severity score. CURB-65 determines mor-
tality risk estimate based on a subset of four spe-
cific features represented by
~
s
i
⊂ ~x
i
, depicted in Sec-
tion 2. The baseline evaluation has been developed
as follows: for a given feature vector representing
the instance
~
s
i
∈ D
test
, and from a given probability
score function curb65(
~
s
i
), we assign a positive class
to
~
s
i
if curb65(
~
s
i
) ≥ thr, where thr is a pre-specified
threshold that represents a score value of 3 points or
higher (severe mortality risk). The output provided by
curb65(
~
s
i
) also estimates the probability of mortality
risk (up to 27.8%).
As mentioned earlier, AUC is the metric used to
evaluate the performance of the classification models.
In addition, ROC curves have been generated to pro-
vide some analysis focused on the most critical clas-
sification, i.e., patients correctly classified as at risk
of death during treatment. We have computed AUC
from prediction scores for both learned classifiers and
developed baseline using roc auc score() method of
sklearn library. In addition, we provide the probabil-
ity of the predictions.
5.3 Results
Table 2 presents the obtained results regarding the
comparative evaluation among the classifiers and the
baseline. The second column shows the obtained
AUC measure. The third to fifth columns point out the
minimum, maximum and average probability for each
method, which represents the probability of predict-
ing the positive class (patients that will not survive).
The probability ranges from 50 to 99% for the evalu-
ated models and from 14% to 27% when considering
the CURB-65 baseline. As we can observe in Table
2, all generated classifiers outperform the CURB-65
baseline. The best expected performance in terms of
the AUC value (0.81) has been achieved by the Logis-
tic Regression classifier (LR). This indicates a 81%
chance that the model correctly distinguishes positive
ICEIS 2022 - 24th International Conference on Enterprise Information Systems
350
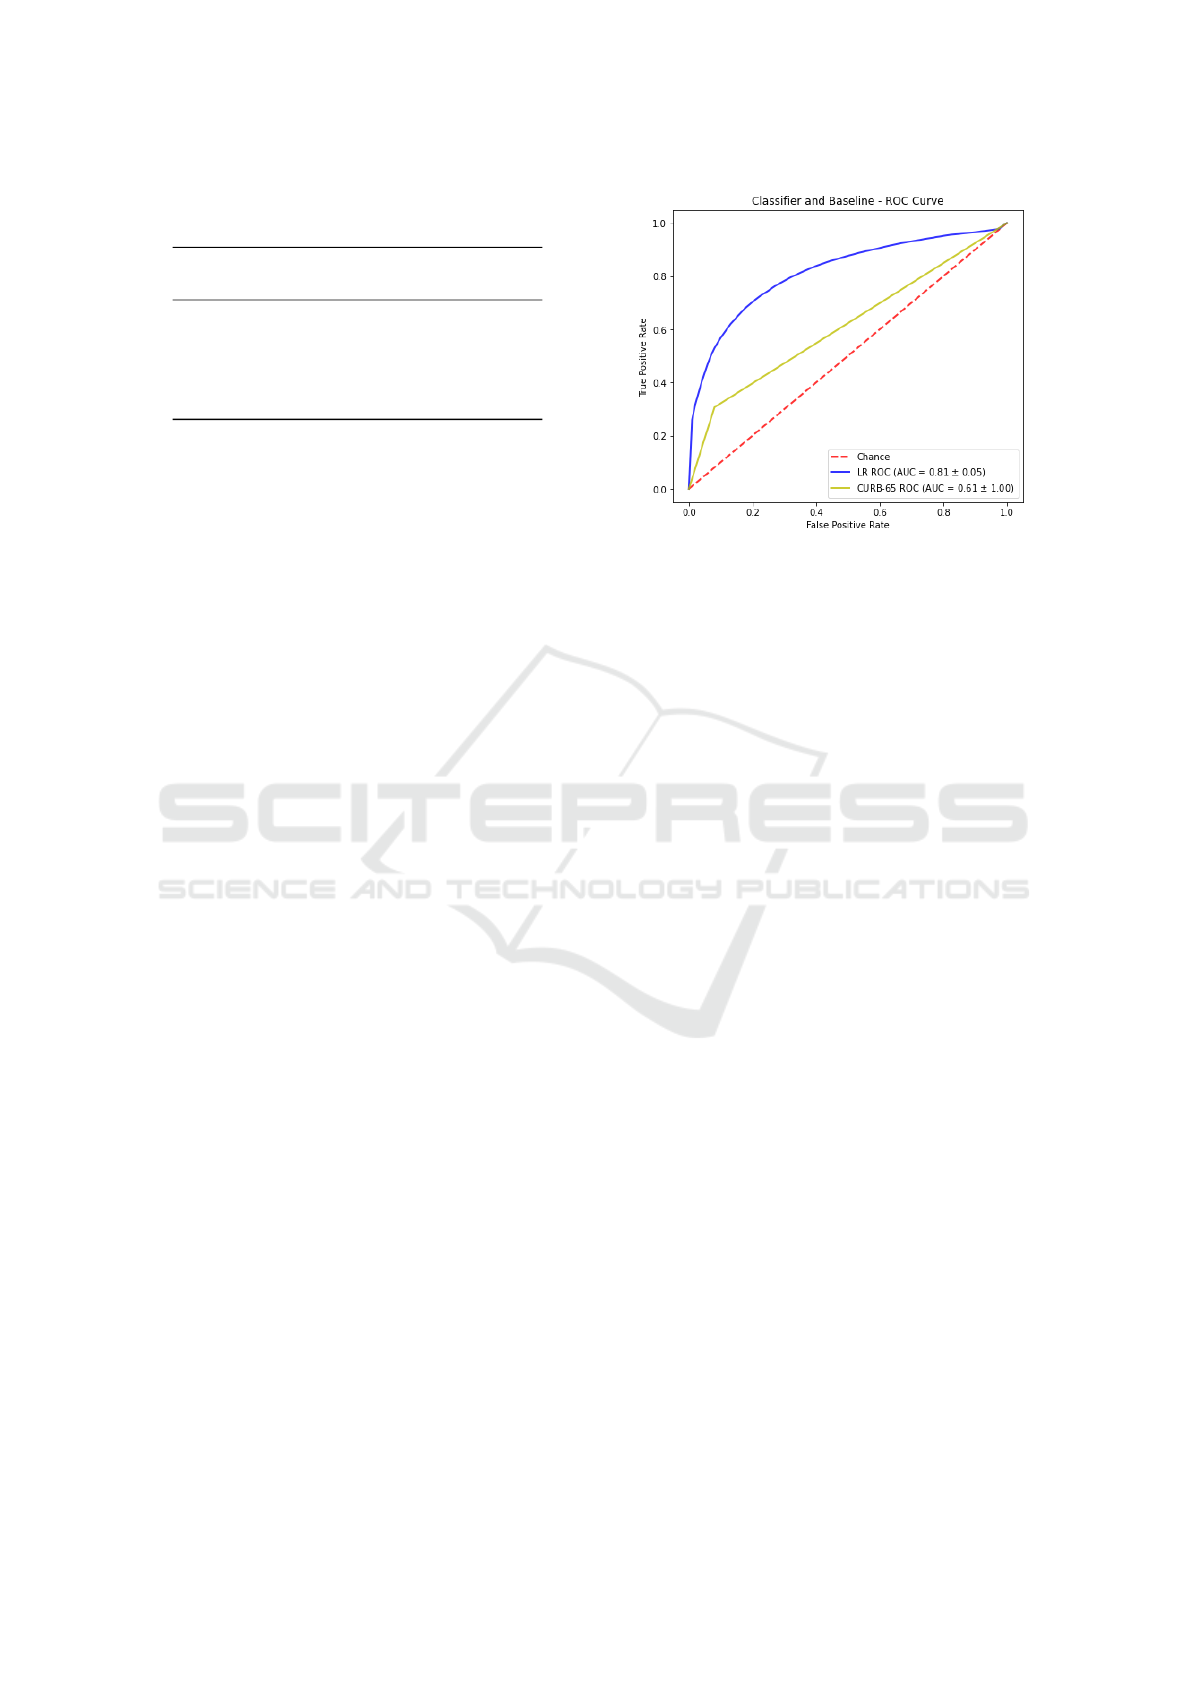
Table 2: Experimentation results considering AUC and
probability.
Model AUC
Probability(%)
MIN MAX AVG
CURB-65 0.61 14 27 20
RF 0.78 50 92 68
SVM 0.71 50 86 75
MLP 0.75 50 98 78
LR 0.81 50 99 78
class from negative class, against 61% of the base-
line. In general, this means that a higher AUC demon-
strates the ability of a classifier to identifying more
True Positives and Negatives than False Positives and
Negatives. Regarding the fifth column of Table 2,
the LR classifier is also able to correctly predicting
the positive class with 78% of confidence in average,
against 20% of CURB-65 score. Therefore, we may
point out a promising result for the LR classifier in
offering a more reliable estimation for risk of death
regarding inpatients with CAP to medical teams.
Figure 1 depicts a ROC curve comparing results
obtained by the best classifier (LR) in comparison
with the baseline based on the CURB-65 score. The
diagonal line from the lower left-hand (0,0) to the
upper right-hand (1,1) represents the strategy of a
model randomly guessing a class. We are able to
observe that there is no intersection between curves.
The LR model curve shows better performance, since
it is closer to the perfect discrimination (0,1). The
curve also demonstrates that the LR model is more
conservative than the baseline with CURB-65 since
it makes positive classifications only with strong evi-
dences, what implies in reducing the number of false
positives. It is worth mentioning that as the threshold
gradually increases, LR tends to present better TPR
than CURB-65. Even at lowest threshold, the perfor-
mance of LR is better than the baseline.
Table 3 presents a chronology of patient measure-
ments representing learning features in order to un-
derstand the applicability of our approach. In this case
study, we consider a patient identified as 354, who
is a 95 years old woman, and has no family health
history of diseases or comorbidities. This patient did
not survive the CAP treatment during her hospitaliza-
tion. The meaning of acronyms are denoted at the end
of the Table 3 (e.g., HHP-Hours hospitalized; RPR-
Respiratory Rate). Presented chronological data are
based particularly in terms of the hours of hospital-
ization (HHP) of the patient, which are depicted in
the first column of the table. With regards to the first
five measurements, it is possible to verify a low prob-
ability for risk of death, thus the prediction column
has been set with value 0 (a negative classification),
Figure 1: ROC Curve for LR vs CURB-65.
although the actual value is 1. After 650 hours of hos-
pitalization, the learned classifier is able to correctly
indicate a positive classification. 650 hours of hos-
pitalization means around 30 days. This is explained
due to the variation of numeric features of measure-
ments outside their normality values. As an exam-
ple, taking into account a vital sign pulse (PLS) fea-
ture, which usually ranges from 57 to 100 in elderly
patients, at last stages of hospitalization, it hits 140,
as shown in 3. The usage of mechanical ventilation
also indicates an ever increasing probability of death.
Further analysis on other features, their correlations
and importance to the results of obtained predictions
is needed.
Complementary assessments of other inpatients
data demonstrate that most of incorrect classifications
occurred in cases where time of hospitalization was
less than 15 days of treatment. Despite these incor-
rect classifications, the predictive models in this work
show promising results. They also draw attention to
patients with more than 700 hours of hospitalization,
blood urea higher than 50 or with mechanical venti-
lation. These patients usually suffer a high decline
of survival chances. It is worth mentioning that the
CURB-65 baseline has provided even smaller odds of
prediction since hospitalization time and most of the
numeric features are not part of its calculation.
In order to ensure that the difference of AUC per-
formance between the LR model (best performance)
and the current baseline is statistically significant, we
have conducted a hypothesis test formulated as fol-
lows:
• H0: LR model and CURB65 have the same AUC
mean performance (µ
1
= µ
2
)
• H1: LR model and CURB65 have different AUC
mean performance (µ
1
6= µ
2
). Thus, the best pe-
forming model outperforms CURB65.
Predicting Mortality Risk among Elderly Inpatients with Pneumonia: A Machine Learning Approach
351

Table 3: Patient 354 chronology sample and results for the LR model.
HHP RPR PLS SBP DBP TMP HMT BUR MCH Actual Predict %
13 21 57 127 64 36.2 28.5 64 0 1 0 23.84%
50 19 70 120 70 37.0 28.2 59 0 1 0 23.01%
164 18 70 130 80 36.4 26.5 50 0 1 0 18.13%
316 18 89 120 80 36.5 26.5 50 0 1 0 30.17%
620 19 67 110 70 36.6 27.6 53 0 1 0 38.29%
650 19 79 120 70 36.5 27.6 53 1 1 0 48.26%
1003 18 87 120 70 36.6 26.9 64 1 1 1 72.93%
2006 19 79 120 80 36.2 25.4 58 1 1 1 87.66%
3044 20 83 130 70 36.5 24.7 40 1 1 1 98.26%
4202 19 75 120 70 36.7 28.2 59 1 1 1 99.76%
4427 18 140 169 79 37.0 24.7 110 1 1 1 99.99%
4955 18 94 118 79 37.0 26.9 64 1 1 1 99.94%
Subtitle: HHP-Hours hospitalized; RPR-Respiratory Rate; PLS-Pulse; SBP-Systolic Blood Pressure; DBP-
Dyastolic Blood Pressure; TMP-Temperature; HMT-Hematocrit; BUR-Blood Urea; MCH-Mechanicly
Ventilated;
After performing 10 cross validation runs, each
one with 10 folds itself, we have had 100 measure-
ments of AUC. The obtained measurements make up
the set of samples to be used in a statistic test as pre-
sented in Table 4. Each table row refers to a fold in
the cross validation process. The means and standard
deviation by run are also depicted in Table 4.
Considering that the total sample set includes 100
elements, we have used the Kolmogorov-Smirnov
test(Dodge, 2008) in order to verify the set’s nor-
mality distribution. Accomplished results with the
Kolmogorov-Smirnov test demonstrated that data do
not differ significantly, thus we can consider them as
normally distributed.
Therefore a paired one-tailed z-test with 95% con-
fidence has been performed (α= 0.05). By applying
the statistical test Z-test, a a = 0.5 represents a crit-
ical value of 1.645 (Davis and Mukamal, 2006) that
must be surpassed to which the result enter the dis-
tribution zone in which the null hypothesis would be
rejected. The computed Z-Value = 40 also represents
a probability value of less than 0.00001 at a normal
distribution table. Thus, with the Z-Value > 1.645
and P-Value(0.0001) < α (0.5), the hypothesis H0 is
rejected and we can confirm that the LR model perfor-
mance is statistically significant better than CURB-65
with α= 0.05.
6 CONCLUSIONS AND FURTHER
WORK
Predicting mortality risk with respect to elderly in-
patients with CAP is an important issue in hospitals.
Based on that issue, we have developed a machine
learning approach to classify patients with CAP at
risk of mortality during hospitalization. The main
purpose is providing means to medical profession-
als make more assertive decisions. To this end, we
also provide higher probability of a positive or neg-
ative classification occurs, i.e, our approach is able
to indicate inpatients likely to come to death with
around 51% to 99%. As a consequence, the pre-
sented approach may help increasing elder inpatients
being able to survive from CAP. The solution pro-
vided by this work includes: (i) an extraction of spe-
cific data and features according to the application do-
main and, particularly, from medical and nurse anno-
tations; (ii) a baseline setting developed according to a
real score used in hospitals; (iii) a predictive analysis
model which outperforms the defined baseline w.r.t.
the AUC metric and (iv) a statistical significance test
to further validate the higher performance of the clas-
sifier in comparison with the evaluated baseline.
Regarding the classification models evaluation,
the obtained results have been compared and anal-
ysed. The LR classifier has been able to predict the
mortality risk with the best performance by means of
the AUC (0.81) metric. It provides an average posi-
tive class probability of 78%. The baseline based on
the CURB-65 risk score has achieved an AUC of 0.61,
with an average probability of 20%. Results have also
highlighted that inpatients with more than 30 days at
hospital have been classified with significant higher
risk of death, what indicates the importance of such
feature w.r.t. the classification model. A hypotheses
test formulation has confirmed that our approach is
statistically significant better than the compared base-
line. The results also show some limitations regarding
the process of correctly predicting patients at risk of
ICEIS 2022 - 24th International Conference on Enterprise Information Systems
352

Table 4: AUC values for repeated 10 times 10-fold cross validation.
Run 1 2 3 4 5 6 7 8 9 10
Fold
1 0.73 0.82 0.80 0.80 0.84 0.82 0.83 0.79 0.88 0.80
2 0.72 0.81 0.84 0.73 0.86 0.86 0.78 0.74 0.76 0.84
3 0.83 0.78 0.85 0.81 0.77 0.81 0.80 0.91 0.78 0.84
4 0.89 0.85 0.78 0.89 0.86 0.79 0.85 0.81 0.74 0.76
5 0.78 0.91 0.80 0.80 0.87 0.85 0.84 0.77 0.81 0.73
6 0.79 0.81 0.84 0.71 0.64 0.76 0.73 0.86 0.84 0.78
7 0.74 0.74 0.88 0.89 0.78 0.77 0.85 0.85 0.80 0.76
8 0.84 0.82 0.91 0.76 0.82 0.75 0.84 0.78 0.83 0.82
9 0.80 0.81 0.72 0.85 0.74 0.80 0.77 0.76 0.77 0.79
10 0.80 0.83 0.82 0.79 0.87 0.76 0.87 0.85 0.81 0.73
Mean 0.79 0.81 0.82 0.80 0.81 0.80 0.82 0.81 0.80 0.79
Average 0.81
Standard deviation 0.05
death in early stages of hospitalization. In this sit-
uation, the learned classifiers have had not so good
performance results.
As future work, we intend to include the gasome-
try exam results in order to enrich data and enable the
experimentation of PSI score as another baseline. In
addition, since we have observed a high importance of
some features w.r.t. positive classifications and its re-
lated probability of death, a detailed feature analysis
study will be accomplished. Furthermore, some prin-
ciples of the methodology and results achieved in this
work can be spread out to other kinds of diseases, en-
abling assistance to health professionals in death risk
alerts.
ACKNOWLEDGEMENTS
The authors would like to thank the Alberto Urquiza
Wanderley Hospital team. Without their support and
guidance, it would be impossible to complete this
work.
REFERENCES
Alpaydin, E. (2016). Machine learning: the new AI. MIT
press.
Bezemer, T., de Groot, M., Blasse, E., ten Berg, M., Kap-
pen, T. H., Bredenoord, A. L., van Solinge, W. W.,
Hoefer, I. E., and Haitjema, S. (2019). A Human(e)
Factor in Clinical Decision Support Systems. Journal
of Medical Internet Research, 21(3):e11732.
Chen, J.-H., Chang, S.-S., Liu, J. J., Chan, R.-C., Wu,
J.-Y., Wang, W.-C., Lee, S.-H., and Lee, C.-C.
(2010). Comparison of clinical characteristics and
performance of pneumonia severity score and curb-65
among younger adults, elderly and very old subjects.
Thorax, 65(11):971–977.
Davis, R. B. and Mukamal, K. J. (2006). Hypothesis testing:
means. Circulation, 114(10):1078–1082.
Dodge, Y. (2008). The concise encyclopedia of statistics.
Springer Science & Business Media.
Fawcett, T. (2001). Using rule sets to maximize roc per-
formance. In Proceedings 2001 IEEE international
conference on data mining, pages 131–138. IEEE.
Fawcett, T. (2006). An introduction to roc analysis. Pattern
recognition letters, 27(8):861–874.
G
´
eron, A. (2019). Hands-on machine learning with Scikit-
Learn, Keras, and TensorFlow: Concepts, tools, and
techniques to build intelligent systems. O’Reilly Me-
dia.
Hastie, T., Tibshirani, R., and Friedman, J. (2017). The Ele-
ments of Statistical Learning: Data Mining, Inference,
and Prediction. Springer.
Hespanhol, V. and B
´
arbara, C. (2020). Pneumonia mortal-
ity, comorbidities matter? Pulmonology, 26(3):123–
129.
Hossin, M. and Sulaiman, M. (2015). A review on evalua-
tion metrics for data classification evaluations. Inter-
national Journal of Data Mining & Knowledge Man-
agement Process, 5(2):1.
Long, B., Long, D., and Koyfman, A. (2017). Emergency
medicine evaluation of community-acquired pneumo-
nia: History, examination, imaging and laboratory as-
sessment, and risk scores. The Journal of Emergency
Medicine, 53(5):642–652.
Luo, E. M., Newman, S., Amat, M., Charpignon, M.-L.,
Duralde, E. R., Jain, S., Kaufman, A. R., Korolev,
I., Lai, Y., Lam, B. D., et al. (2021). Mit covid-19
datathon: data without boundaries. BMJ innovations,
7(1).
Michalski, R. S., Carbonell, J. G., and Mitchell, T. M.
(2013). Machine learning: An artificial intelligence
approach. Springer Science & Business Media.
Pourhomayoun, M. and Shakibi, M. (2021). Predicting
mortality risk in patients with covid-19 using machine
Predicting Mortality Risk among Elderly Inpatients with Pneumonia: A Machine Learning Approach
353

learning to help medical decision-making. Smart
Health.
Ryan, L., Lam, C., Mataraso, S., Green-Saxena, A. A. A.,
and Pellegrini, E. (2020). Mortality prediction model
for the triage of covid-19, pneumonia, and mechan-
ically ventilated icu patients: A retrospective study.
Annals of Medicine and Surgery.
Schr
¨
oer, C., Kruse, F., and G
´
omez, J. M. (2021). A sys-
tematic literature review on applying crisp-dm process
model. Procedia Computer Science, 181:526–534.
Silva, V., Novo, A. D. R., Souza, D., and R
ˆ
ego, A. (2020).
Machine learning to assist in pneumonia decision
making: A systematic review of the literature. In
Anais do VIII Symposium on Knowledge Discovery,
Mining and Learning, pages 201–208. SBC.
Tuti, T., Agweyu, A., Mwaniki, P., Peek, N., and English,
M. (2017). An exploration of mortality risk factors in
non-severe pneumonia in children using clinical data
from kenya. BMC medicine, 15(1):1–12.
Webb, A. and Gattinoni, L. (2016). Oxford Textbook of Crit-
ical Care. Oxford University Press.
Wiemken, T., Furmanek, S., Mattingly, W., Guinn, B.,
and Cavallazzi, R. (2017). Predicting 30-day mortal-
ity in hospitalized patients with community-acquired
pneumonia using statistical and machine learning ap-
proaches. Journal of Respiratory Infections.
Wiemken, T., Kelley, R., and Ramirez, J. (2013). Clini-
cal scoring tools: which is best to predict clinical re-
sponse and long-term outcomes? Infectious disease
clinics of North America.
Wirth, R. and Hipp, J. (2000). Crisp-dm: Towards a stan-
dard process model for data mining. In Proceedings of
the 4th international conference on the practical ap-
plications of knowledge discovery and data mining,
volume 1. Springer-Verlag London, UK.
World Health Organization (2015). Health Top-
ics: Pneumonia. https://www.who.int/health-
topics/pneumonia.
Wu, C., Rosenfeld, R., and Clermont, G. (2014). Using
data-driven rules to predict mortality in severe com-
munity acquired pneumonia. PLoS One, 9(4):e89053.
Wu, D., Wu, C., Zhang, S., and Zhong, Y. (2019). Risk fac-
tors of ventilator-associated pneumonia in critically iii
patients. Frontiers in pharmacology, 10:482.
ICEIS 2022 - 24th International Conference on Enterprise Information Systems
354
