
ICT Development and Food Consumption: An Impact of Online Food
Delivery Services
Gunawan
Faculty of Engineering, University of Surabaya, Surabaya, Indonesia
Keywords: Data Mining, Food Delivery, O2O, ICT Development, Indonesia.
Abstract: The online food delivery (OFD) service has grown globally. The growth of OFD depends on the ICT
development where the online business could grow in a region. This study departs from the question, "does
ICT development impact the food consumption of society?" The answer is likely to provide evidence for the
ICT impact on a new issue: food consumption. In the Indonesian context, the study objectives are: (1) to
investigate the pattern of ICT development among provinces in Indonesia; (2) to investigate the pattern of
food consumption indicators among provinces; (3) to cluster provinces based on ICT development and food
consumption; (4) to deploy a predictive model into another dataset. This study takes place in Indonesia, where
the OFD revenue was projected about $800 million by 2021. This secondary and quantitative research adopted
a data mining approach by analyzing data of ICT development and food consumption among Indonesian
provinces. The clustering analysis indicated that provinces with higher ICT development have higher food
consumption. The result is likely to explain the impact of the OFD growth. Managers of OFD platforms might
use the finding to decide which provinces to focus on for their marketing strategy. As a prominent actor for
ICT development, the government might use the result to formulate a better plan to improve ICT access. This
study suggests that the government and OFD platforms promote healthy food eating to improve public health.
The use of official statistics and data mining approach provides this research with generalized findings at the
country level. Further studies are needed to obtain a generalization of the results beyond Indonesia.
1 INTRODUCTION
The online food delivery (OFD) service has grown
globally, with a value of $126.91 billion at a
compound annual growth rate of 10.3% in 2021, as
reported by ReportLinker. OFD covers services that
deliver prepared meals and food ordered online for
direct consumption. Some OFD services in western
countries are Just Eat, Uber Eats, and Deliveroo. In
Asian countries, for example, GrabFood operates in
six ASEAN countries: Indonesia, Singapore,
Philippines, Malaysia, Vietnam, Thailand, and
Myanmar, as presented in its site food.grab.com
(accessed 19th Nov 2021). In addition, FoodPanda
has been operated in 12 Asian countries, such as
Japan, Hongkong, Pakistan, and Singapore, as shown
on its site foodpanda.com (accessed 19th Nov 2021).
Online Food Delivery could be classified into two
business models based on the ordering and delivery
process. First, the Restaurant-to-Consumer model
refers to the order made directly through a restaurant
app/website (e.g., Domino's, McDonald's) or via a
third-party platform (e.g., Just East). The delivery of
meals is conducted directly by the restaurants. OFD
offered by each restaurant or food outlet has been
practiced for quite a long time. Second, the Platform-
to-Consumer Delivery model refers to a third-party
platform that typically intermediaries between
customers and food vendors. Customers make orders
through online applications. Their orders are sent to
food vendors, where foods are prepared and then
delivered to customers by agents/employees (delivery
boys) associated with OFD service (Keeble et al.,
2020). According to a report published by Statista
(2021a), the global revenue in the Restaurant-to-
Consumer Delivery segment was about $122 billion
in 2021, with its annual growth rate of 11.16%, while
the Platform-to-Consumer Delivery segment's
revenue was $148 billion in 2021, with its annual
growth rate of 9.74%.
During the Covid-19 pandemic, online food
ordering has dropped in the early pandemic, as the
closure of many businesses and the customer's fear.
After some businesses resume their operation with
Gunawan, .
ICT Development and Food Consumption: An Impact of Online Food Delivery Services.
DOI: 10.5220/0011043100003179
In Proceedings of the 24th International Conference on Enterprise Information Systems (ICEIS 2022) - Volume 1, pages 171-178
ISBN: 978-989-758-569-2; ISSN: 2184-4992
Copyright
c
2022 by SCITEPRESS – Science and Technology Publications, Lda. All r ights reserved
171

some restrictions, the OFD platform becomes the
solution for customers to buy food. Restaurants that
offer online ordering during the pandemic benefit
from enhancing customer experience, retaining its
customer, and receiving revenue (Gavilan et al.,
2021). OFD platform contains features such as online
review, online rating, and online tracking, which
influence customer satisfaction and the intention to
reuse the application (Alalwan, 2020). A survey
among OFD customers in Bandung found the direct
effect of food quality on online loyalty, but not e-
service quality (Suhartanto, Ali, et al., 2019).
The growth of OFD depends on the ICT
availability and accessibility in the region. It is
measured by ICT Development Index (IDI),
published annually since 2009. IDI comprises three
sub-index: ICT access, ICT use, and ICT skills. Until
2017, IDI was composed of 11 indicators and, starting
from 2018, by 14. In addition, new indicators were
added, such as the percent of individuals who own a
mobile phone, and some were discarded, such as
fixed broadband subscription per 100 inhabitants. The
IDI framework specified that IDI leads the ICT
impact (ITU, 2017).
The economic impact of ICT development in a
country or region has been widely explored (e.g.,
Appiah-Otoo & Song, 2021). The relationship
between ICT measures (e.g., ICT penetration) and
economic indicators (e.g., GDP growth) has been
summarized (Vu et al., 2020). Also, the impact of ICT
on social life, such as leisure activities and traveling,
was documented (Mokhtarian et al., 2006). Overall,
the result of ICT development in a country or region
is apparent, whether directly or indirectly.
This study departs from the question, "Does ICT
development impact the food consumption of
society?" This question arose from the emerging OFD
in many countries, including Indonesia. The
objectives are: (1) to investigate the pattern of ICT
development among provinces in Indonesia; (2) to
investigate the pattern of food consumption indicators
among provinces; (3) to cluster provinces based on
ICT development and food consumption; (4) to
deploy a predictive model into other datasets. The
unit of analysis is Indonesian provinces.
The remainder of the paper is designed as
follows. Section 2 presents a literature review on ICT
development and OFD. Section 3 describes methods,
framework, and variables. Moreover, the results and
discussions are presented in Section 4, with the
conclusion and recommendation in Section 5.
2 RELATED WORK
This literature review section was aimed to lead the
idea that ICT development relates to the consumption
level through the emerging OFD segment. This short
review subsequently presents the impact of OFD, ICT
development, and an overview of OFD services in
Indonesia.
2.1 Impact of OFD
The online food delivery (OFD) segment has been
investigated its relation to various issues. A prior
study discussed the impact of OFD on diet and diet-
related health (Bates et al., 2020). An example of
public health nutrition policy is mandatory to provide
consumers with energy content information. As an
OFD platform manage the partnership with many
food vendors, it may have little control for the outlets
to meet the policy. A good case in Australia,
Deliveroo, as an OFD platform, is committed to
presenting its food vendors' energy information
(Bates et al., 2020).
The impact of OFD was investigated based on
three aspects of sustainability: economic, social, and
environment (Li et al., 2020). The study specified that
the OFD provides transaction opportunities to food
vendors and employment to independent
riders/drivers as delivery people. However, the
negative impact was also identified, such as the high
charge fee to food vendors, the social impact on
public health, and the environmental impact on the
increasing waste and carbon footprint. The
investigation of the OFD impact on the environment
estimated that 86% of CO
2
equivalent came from the
food package (Xie et al., 2021). OFD platform and
food vendors could reduce a portion of the food
package, for example, by rewarding consumers who
do not require disposable spoons, forks, chopsticks,
and napkins.
The relationship between OFD services and
consumption was investigated based on the existing
Theory of Consumption Value (Kaur et al., 2020).
The paper tested whether the six dimensions of
consumption values relate to the intention to use OFD
applications. The study reported that price value and
visibility were significant predictors to order food
online through the OFD platform, but health-
consciousness and food-safety concerns were not.
A previous survey among young people
confirmed that the online service quality from the
OFD platform and the food quality from the food
vendor lead to customer satisfaction (Suhartanto,
Dean, et al., 2019). Furthermore, the satisfied
ICEIS 2022 - 24th International Conference on Enterprise Information Systems
172

consumers would repurchase, recommend to others,
and pay more. Therefore, as OFD continuously
improves its features, promotion programs, and more
varieties of food offered, more people will order food
online. (Suhartanto, Dean, et al., 2019).
Consequently, food consumption increases.
The OFD platform regularly makes extensive
advertisements to broaden its visibility and offer
attractive prices or promotions. These are likely to
lead more consumers to order food online. In
addition, less concern about food health and food
safety means more people order food online. As a
result, the OFD segment becomes a new and
emerging economic activity, replacing how people
consume foods and increasing consumption. For
example, a study in China indicated the escalating
consumption from food delivery services (Maimaiti
et al., 2018). Therefore, OFD platforms stimulate
more consumption.
Literature indicated that some researchers used
the term online-to-offline (O2O) food delivery for a
similar meaning of OFD. The O2O service platform
is defined as a marketing channel that facilitates
customers to order local, daily services online via
apps and deliver them directly offline (Zhang et al.,
2019). There are four alternative modes for O2O food
delivery: (1)the self-built platform and self-delivery,
(2) the self-built platform and third-party delivery, (3)
the third-party platform and self-delivery, and (4) the
third-party platform and third-party delivery (Du et
al., 2021). As described earlier, these four have the
same classification as Restaurant-to-Consumer and
Platform-to-Consumer.
2.2 ICT Development
ICT has entered many aspects of human life, the
organization and business operations, public services,
and international cooperation. As a result, countries
pursue ICT development as a global performance
measure. This global measure is named the ICT
Development Index (IDI), published annually by the
United Nations International Telecommunication
Union (ITU, 2017). Overall, IDI consists of 11
measures such as the percentage of households with
internet access, percentage of individuals using the
internet, and mobile broadband subscription. ICT
access refers to the availability of the mobile network
and international bandwidth. ICT use contains
measures such as the percentage of individuals using
the internet or mobile broadband subscription.
Finally, ICT skills relate to the education levels, such
as year schooling.
Most of the literature indicates a positive impact
of ICT on economic growth. For example, a prior
study contended that ICT increased economic growth
in rich and developing countries. However,
developing countries are inclined to gain more from
ICT development (Appiah-Otoo & Song, 2021).
Similarly, the study among selected developing
countries in the Middle East, North Africa, and Sub-
Saharan Africa confirmed the impact of ICT
development on ICT growth (Bahrini & Qaffas,
2019). Furthermore, the association between ICT
development and economic (GDP) growth among
OECD EU countries was also confirmed (Antonio
Fernández-Portillo et al., 2020).
The availability of ICT infrastructure (e.g., mobile
network) and adequate ICT skills enable
entrepreneurs (e.g., food vendors) to enter online
commerce. Entrepreneurs could develop their
applications or join a third-party platform (e-
marketplace). Moreover, access to the mobile
network or fixed broadband enables customers to
order online. The education level could be related to
the person's ability to use an ICT device. Therefore, it
is logical to link ICT with the increasing OFD
services. The concluding concept from this short
review is that ICT development enables the emerging
OFD, which subsequently increases consumption.
2.3 OFD in Indonesia
The primary OFD Platform-to-Consumer services in
Indonesia are GoFood and GrabFood, plus recently
emerging Shopee Food. Based on a survey conducted
by Rakuten Insight, around 78% of respondents in
Indonesia selected GoFood as the OFD app they used.
Similarly, 71% chosen GrabFood (Statista, 2021b). In
Indonesia, the couriers are not OFD service's
employees but independent partners. This new
business model has generated millions of jobs in the
informal sector. The Indonesian statistics agency
(BPS) reported that 59.45% of employment would
come from the informal sector by August 2021.
For the OFD Restaurant-to-Consumer services,
the fast-food restaurant chains such as KFCs.
McDonald, and Pizza Hut, provide their delivery
services. However, these big chain restaurants also
implement OFD Platform-to-Consumer services for
customer preferences in actual practice.
OFD services have been available to all
Indonesian provinces. Based on the data released by
Statista, Figure 1 presents the bar chart of the total
revenue from the Restaurant-to-Consumer and the
Platform-to Consumer segments (Statista, 2021c).
The revenue growth showed a logarithmic pattern
ICT Development and Food Consumption: An Impact of Online Food Delivery Services
173
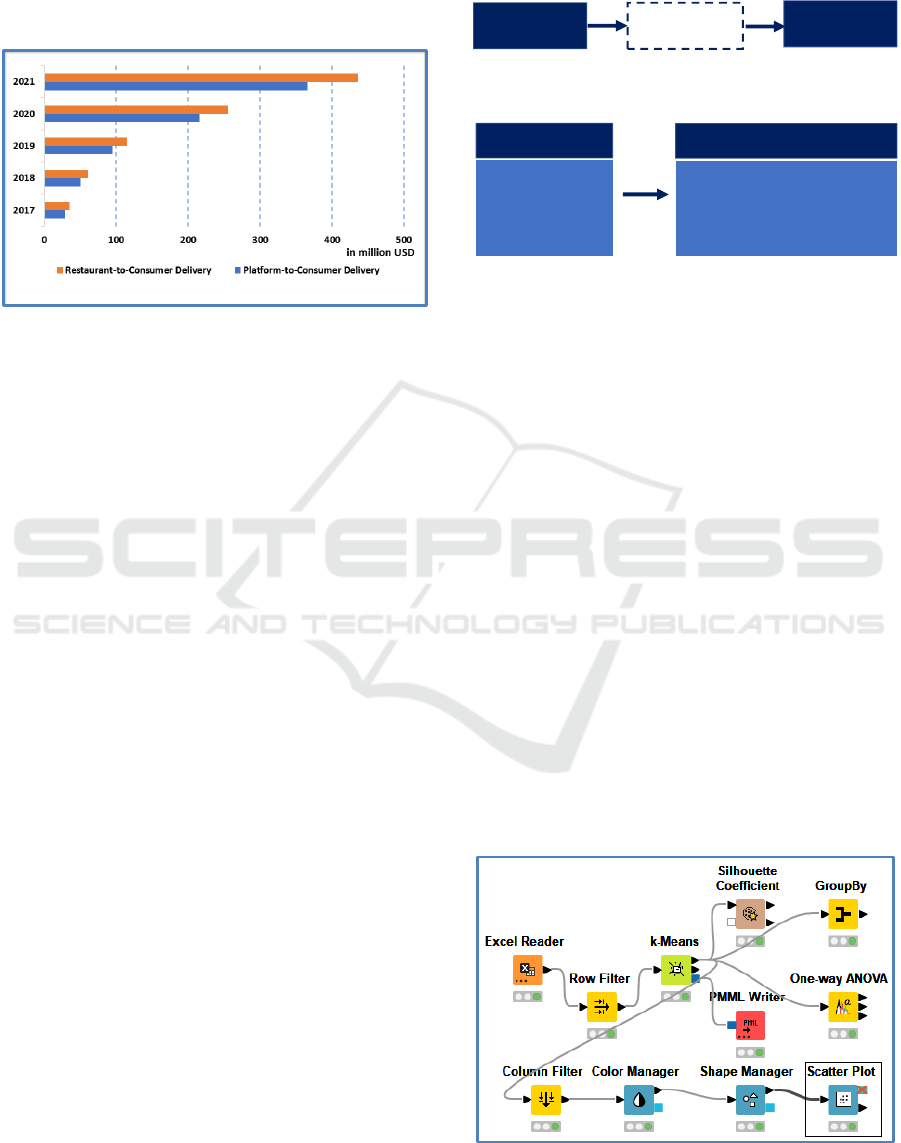
rather than linear. The projected total revenue from
both segments was $803 million by 2021. In addition,
revenue per segment for Restaurant-to-Consumer is
higher ($52.51 in 2021) than Platform-to-Consumer
($32.06 in 2021), as reported by Statista.
Figure 1: Revenue of online food delivery in Indonesia
(Statista, 2021c).
3 METHODS
This research was categorized as secondary and
quantitative research. Then, it adopted a data mining
approach implemented using the CRISP-DM
framework (Martinez-Plumed et al., 2019). The
framework consists of six steps: Research (Business)
understanding, Data understanding, Data preparation,
Modelling, Evaluation, and Deployment. Moreover,
Data mining was conducted using the Knime
Analytics Platform, an open-source software.
This study used the official statistics published by
the Indonesian Central Bureau of Statistics. Data
were classified into two groups. First, the indicator of
ICT development was taken from the ICT
development index as the world composite measure
of ICT development between countries. This index is
composed of three sub-index ICT usage sub-index
(40%), ICT access sub-index (40%), and ICT skill
sub-index (20%). For example, the ICT usage index
consists of (1) percentage of individuals using the
internet, (2) fix broadband subscriptions per 100
inhabitants, and (3) active mobile broadband
subscriptions per 100 inhabitants. Second, the
indicator for food consumption consists of four
indicators covering food expenditure in an urban area,
food expenditure in a rural area, amount of protein
consumed, and the number of calories consumed.
Based on section 2, a conceptual framework was
developed by linking ICT development, online food
delivery, and food consumption, as shown in Figure
2. However, data about OFD services in each
province, such as the total sales or orders, was not
available. Therefore, the working framework links
the variables of ICT Development and food
consumption variables, as shown in Figure 3.
Figure 2: Conceptual framework.
Figure 3: Working framework.
The unit of analysis is Indonesia province. From
the total 34 provinces, Jakarta as a special capital city
region was removed from the analysis because it has
no rural data. The ICT development index and online
food ordering service are higher than in other
provinces. Therefore these 33 provinces entered in
the analysis, in order of their location from west to
east: 1.Aceh, 2.North Sumatra, 3.West Sumatra,
4.Riau, 5.Jambi, 6.South Sumatra, 7.Bengkulu,
8.Lampung, 9.Bangka Belitung Isl. , 10.Riau Islands,
12.West Java, 13.Central Java, 14.Yogyakarta,
15.East Java, 16.Banten, 17.Bali, 18.West Nusa
Tenggara, 19.East Nusa Tenggara, 20.West
Kalimantan, 21.Central Kalimantan, 22.South
Kalimantan, 23.East Kalimantan, 24.North
Kalimantan, 25.North Sulawesi, 26.Central Sulawesi,
27.South Sulawesi, 28.Southeast Sulawesi,
29.Gorontalo, 30.West Sulawesi, 31.Maluku,
32.North Maluku, 33.West Papua, 34.Papua.
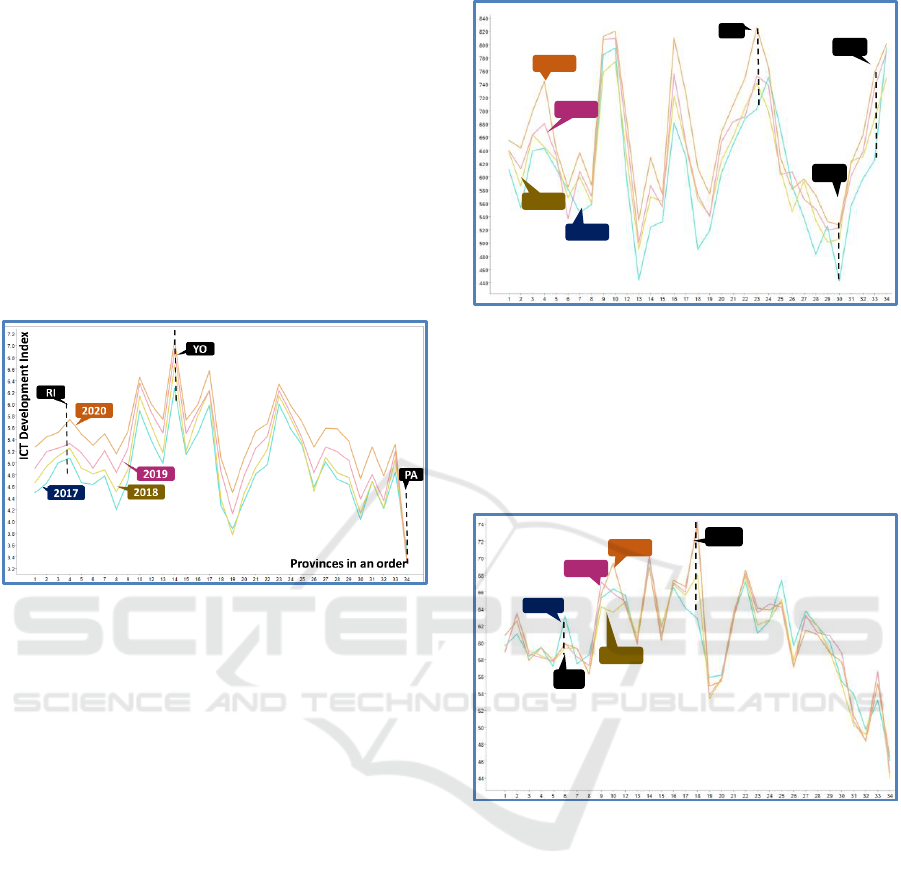
Data analysis was performed using Knime's
workflows. Figure 4 presents the basic workflow for
plotting and clustering consisting of several nodes
shown by colorful small boxes.
Figure 4: Knime's workflow.
ICT
Development
Food
consumption
Online Food
Delivery
IDI
ICT Access
ICT Use
ICT Skills
ICT Development
Food expenditure in urban areas
Food expenditure in rural areas
Amount of protein consumed
Amount of calories consumed
Food consumption
ICEIS 2022 - 24th International Conference on Enterprise Information Systems
174
4 RESULT AND DISCUSSION
This section was structured to answer each objective.
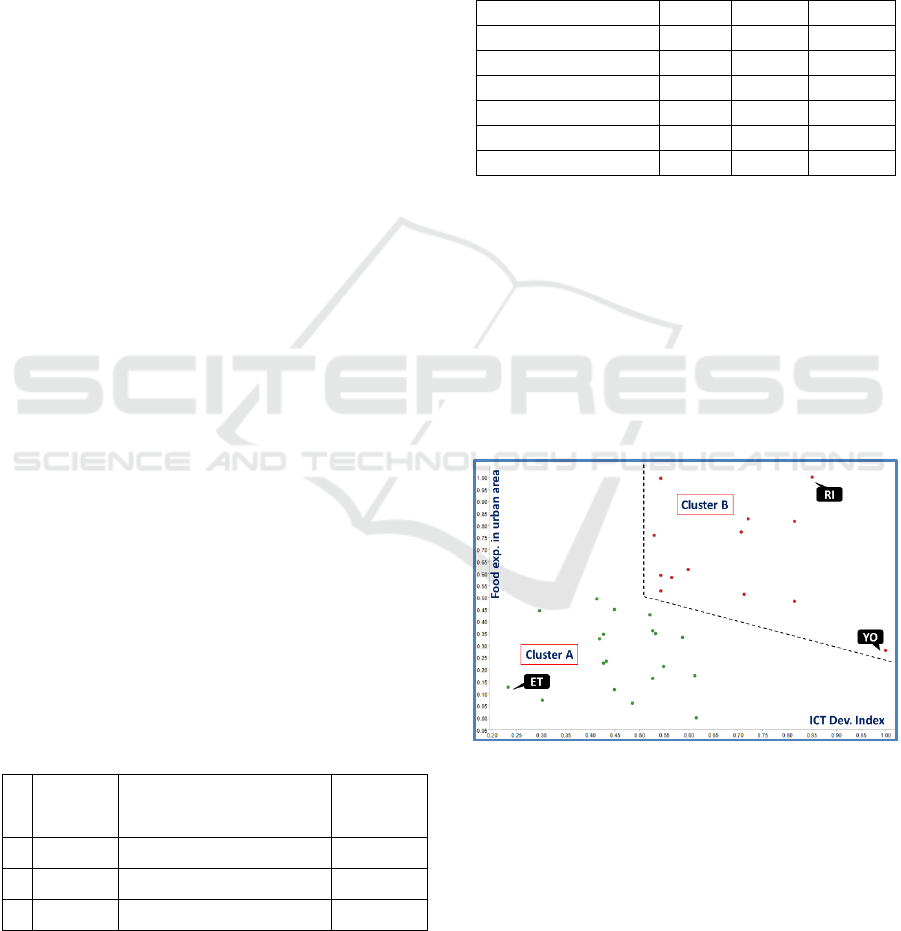
4.1 The Pattern of ICT Development
The overall ICT development index (IDI) was plotted
against provinces, as shown in Figure 5. Provinces
were ordered based on their official position from
west to east of the Indonesian area—the four-line
graphs representing the year 2017 to 2020 show a
similar pattern. The highest IDI is Yogyakarta (YO),
and the lowest is Papua (PA), as shown in Figure 5.
Figure 5: ICT Development Index among provinces.
The graph shows the increasing IDI from 2017 to
2020. Some provinces experience a high increase, led
by a significant gap between years, such as Riau (RI).
A high rise in IDI means a substantial improvement
in the ICT access and infrastructure (e.g., percentage
households with internet access) and ICT use (e.g.,
broadband subscribers).
4.2 The Pattern of Food Consumption
Figure 6 presents the line graph of food expenditure
(thousand IDR) in the urban area among provinces for
2017-2020. It appears that the gap among provinces
is considerably high. The highest expenditure took
place in East Kalimantan (EK), and the lowest was
West Sulawesi (WS) in 2020. The increase in
spending over the period appears from the gap.
Inflation also contributed to the rise that happened
during the period. The Indonesian statistics agency
released the data that the consumer price index for
food in 2020 (2018 as a base year) indicated the
inflation of 5.6% and food expenditure growth of
10.1%. The highest expenditure increase is observed
for West Papua (WP).
Figure 6: Food expenditure in the urban area.
As shown in Figure 7, the protein consumed per
inhabitant varies among provinces. The highest is
West Nusa Tenggara (WT), and the lowest is Papua
(PA). The line graph indicates that some provinces
experienced a decrease from 2017, such as South
Sumatra (SS).
Figure 7: Protein consumption among provinces.
4.3 Clustering
4.3.1 Cluster Model
The modeling and evaluation phase of CRISP-DM
was implemented. The objective of cluster modeling
was to group provinces based on the ICT
development and food consumption variables. The
year 2020 was the pandemic period with the non-
normal condition; therefore, the clustering used 2019
data. The k-means algorithm was adopted because of
its simplicity and the reasonably small number of
objects (33 provinces). The evaluation of the model
was conducted based on two aspects. First was the
number of clusters (k), which was determined as 2,3,4
by considering the number of objects, evaluated using
Provinces in an order
Food expenditure in urban area
2020
2019
2017
2018
EK
WS
WP
Provinces in an order
Protein consumption
2017
2018
2020
2019
WT
SS
ICT Development and Food Consumption: An Impact of Online Food Delivery Services
175
the Silhouette coefficient. The second was the
variables significantly different between clusters.
Preliminary k-means clustering was performed
with four variables of ICT and four of food
consumption. The position of cluster members was
investigated from scatter plots to detect any outliers.
It was found that Papua province does not have
closeness with others. For example, it has a high score
in food expenditure in an urban area, but the lowest
in the amount of protein consumed, as discussed
earlier. Therefore, Papua was excluded for further
clustering. The clustering result was examined with
an ANOVA test to find which variables significantly
differentiated between clusters. The test found two
insignificant variables: ICT skill and the calories
consumed. Thus, both were excluded for further
analysis.
Clustering was performed with six variables.
First, K-means clustering was performed for cluster
size k=2, 3, or 4. Then, the optimum k was evaluated
with the mean score of the Silhouette coefficient
(range -1 to 1), as shown by Table 1. The highest
mean score is 0.396 for k=2. The mean score +1
means clusters are well apart and distinguished, while
0 indicates the undistinguished clusters. The score of
0.396 implies that the two clusters are somewhat
separated. The clustering result grouped the
remaining 32 provinces into two (k=2), with 19
(cluster A) and 13 (cluster B).
Cluster A: Aceh, North Sumatra, Jambi, South
Sumatra, Bengkulu, Lampung, Central Java,
East Java, West Nusa Tenggara, East Nusa
Tenggara, West Kalimantan, North Sulawesi,
Central Sulawesi, South Sulawesi, South-East
Sulawesi, Gorontalo, West Sulawesi, Maluku,
North Maluku
Cluster B: West Sumatra, Riau, Bangka
Belitung Isl., Riau Islands, West Java,
Yogyakarta, Banten, Bali, Central Kalimantan,
South Kalimantan, East Kalimantan, North
Kalimantan, West Papua
Table 1: Cluster size and Silhouette coefficient.
k
cluster
size
Silhouette coef. each
cluster [-1 to 1]
Silhouette
coef.
overall
2
19,13
0.450, 0.317
0.396
3
11,12,9
0.328, 0.093, 0.355
0.247
4
12,4,8,8
0.251, 0.147, 0.038, 0.284
0.196
The characteristics of clusters A and B were
investigated through their normalized mean scores of
all six variables using Knime's Groupby node. Table
2 shows the mean scores and indicates that cluster A
has higher mean scores for all six variables than
cluster B. In addition, the p-value from the ANOVA
test was presented in the table to show that the protein
consumption variable is significant at p<0.01, while
the other five are at p<0.001. These significances
confirm that all variables' mean is different between
the two clusters.
Table 2: Normalized mean value.
Variable
A
B
p-value
IDI
0.46
0.69
0.000
ICT access
0.44
0.63
0.000
ICT use
0.47
0.79
0.000
Food exp. rural area
0.25
0.67
0.000
Food exp. urban area
0.26
0.67
0.000
Protein consumption
0.49
0.66
0.009
4.3.2 Cluster Plotting
Figure 8 presents the cluster members based on the
IDI and food expenditure in urban areas. Provinces in
Cluster B are likely to have higher IDI and food
expenditure in urban areas. For example, Riau (RI)
Province has high IDI and food expenditure in an
urban area. Conversely, East Nusa Tenggara (ET) has
a relatively low score for both variables. Yogyakarta
(YO) has the highest IDI among provinces but low
food expenditure for rural areas.
Figure 8: IDI vs. food expenditure in an urban area.
Figure 9 presents the cluster members based on
the ICT use and food expenditure in rural areas.
Provinces in cluster A tend to have lower ICT use and
food expenditure in rural areas than in cluster B. The
remote provinces, such as West Papua (WP) and
North Kalimantan (NK), have relatively high ICT use
and food expenditure in rural areas. In contrast, two
provinces of cluster A are marked in Fig. 9. East
Nusa Tenggara (ET) and Aceh (AC).
ICEIS 2022 - 24th International Conference on Enterprise Information Systems
176
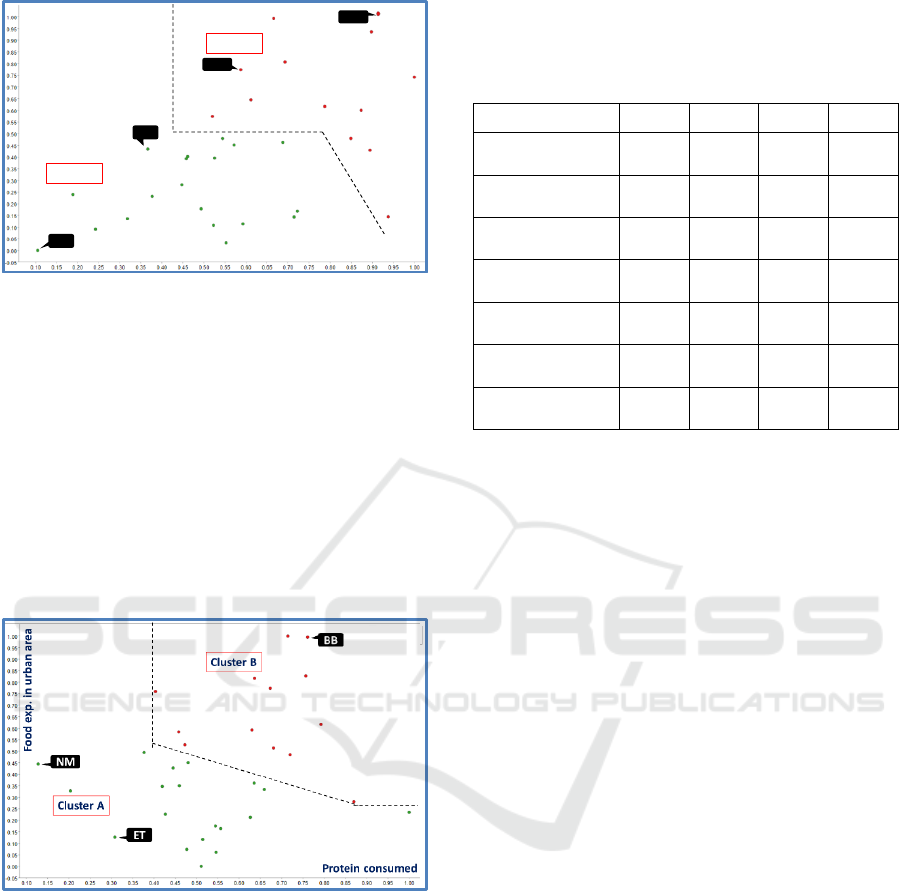
Figure 9: ICT use vs. food expenditure in a rural area.
Figure 10 displays the distribution of provinces
based on the protein consumed and food expenditure
in an urban area. It indicates that provinces with high
food expenditure in urban areas have more protein
consumption. Some provinces are shown in the
figure. Bangka Belitung Island (BB) has high food
expenditure and protein consumption. Contrary, East
Nusa Tenggara (ET) has relatively low food
expenditure and protein consumption. North Maluku
(NM) with the lowest protein consumed but food
expenditure around the median value among
provinces.
Figure 10: Protein consumption vs. food expenditure in an
urban area.
4.3.3 Predictive Modeling
The clustering using dataset 2019 produces a
predictive model in the PMML format. This model
was applied (deployed) to datasets 2017, 2018, and
2020 to observe which provinces shift their cluster
membership. The model deployment revealed that
seven provinces experienced shifting their relative
position between the two clusters. Table 3 presents
the shift and the ICT use index. Provinces shift from
A to B indicates the increasing ICT development and
food consumption. West Papua and West Nusa
Tenggara present their movement from A to B with
the significant increase in ICT use.
Table 3: ICT use index and cluster membership shift.
Province
2017
2018
2019
2020
West Nusa
Tenggara
3.01
A
3.09
A
3.87
A
4.28
B
West Papua
3.70
A
4.04
B
4.35
B
4.58
B
North Sumatra
3.38
A
3.72
B
4.19
A
4.72
A
Jambi
3.53
A
3.93
B
4.29
A
4.93
A
Bengkulu
3.55
A
3.61
B
4.12
A
4.58
A
North Sulawesi
4.62
B
4.55
B
4.72
A
5.15
B
Yogyakarta
5.01
B
5.44
B
5.65
B
5.91
A
4.4 Summarized Findings
The variation between provinces about the ICT
development and the food consumption indicators is
relatively high. Variations in geographic,
demographic, economic, and cultural attributes will
likely influence ICT development and food
consumption. Furthermore, all provinces experienced
an increase in ICT development. However, provinces
with lower existing scores shared higher growth of
ICT development scores. This fact shows that the
government has made significant ICT development in
those provinces. The analysis indicated that the ICT
development was positively associated with food
consumption among Indonesian provinces.
Therefore, this growth of OFD services and
increasing online consumers could be attributed to
this association.
5 CONCLUSIONS
This study investigated the relationship between ICT
development and food consumption based on
growing OFD customers. The analysis of official
statistics among Indonesian provinces indicates that
provinces with higher ICT development have higher
food consumption. This research gives the macro
social-economic perspective to support other OFD
related studies, mostly taking customers' views. The
use of official statistics and data mining approach
provides this research with generalized findings at the
country level. However, this approach might imply
some limitations. For example, the food expenditure
ICT use
Food exp. in rural area
Cluster A
Cluster B
ET
AC
WP
NK
ICT Development and Food Consumption: An Impact of Online Food Delivery Services
177

data do not differentiate the portion bought from
online or conventional channels. Moreover, the
generalization of the finding is limited to Indonesian
provinces. Further studies for countries with growing
online food delivery services could generalize.
Managers of OFD platforms might use the finding
to decide which provinces to focus on for their
marketing strategy. Similarly, as a prominent actor
for ICT development, the government might use the
result to formulate a better plan to improve ICT
access. The growth of OFD, especially the Platform-
to-Consumer segment, will give a big multiplier
economic impact, at least for food vendors and
delivery people. In addition, increasing food
consumption could heighten obesity or diet-related
disease in society. Therefore, the government and
OFD platforms should promote healthy food eating to
improve public health.
REFERENCES
Alalwan, A. A. (2020). Mobile food ordering apps: An
empirical study of the factors affecting customer e-
satisfaction and continued intention to reuse.
International Journal of Information Management, 50,
28–44.
Antonio Fernández-Portillo, Almodóvar-González, M., &
Hernández-Mogollón, R. (2020). Impact of ICT
development on economic growth. A study of OECD
European union countries. Technology in Society,
63(101420).
Appiah-Otoo, I., & Song, N. (2021). The impact of ICT on
economic growth: Comparing rich and poor countries.
Telecommunications Policy, 45(2), 102082.
Bahrini, R., & Qaffas, A. A. (2019). Impact of information
and communication technology on economic growth:
Evidence from developing countries. Economies, 7(1).
Bates, S., Bates, S., Reeve, B., & Trevena, H. (2020). A
narrative review of online food delivery in Australia:
Challenges and opportunities for public health nutrition
policy. Public Health Nutrition, 5.
Du, Z., Fan, Z. P., & Gao, G. X. (2021). Choice of O2O
Food Delivery Mode: Self-built Platform or Third-
Party Platform? Self-Delivery or Third-Party Delivery?
IEEE Transactions on Engineering Management, May.
Gavilan, D., Balderas-Cejudo, A., Fernández-Lores, S., &
Martinez-Navarro, G. (2021). Innovation in online food
delivery: Learnings from COVID-19. International
Journal of Gastronomy and Food Science,
24(February).
ITU. (2017). The ICT Development Index (IDI): conceptual
framework and methodology. International
Telecommunication Union.
Kaur, P., Dhir, A., Talwar, S., & Ghuman, K. (2020). The
value proposition of food delivery apps from the
perspective of theory of consumption value.
International Journal of Contemporary Hospitality
Management, 33(4), 1129–1159.
Keeble, M., Adams, J., Sacks, G., Vanderlee, L., White, C.
M., Hammond, D., & Burgoine, T. (2020). Use of
online food delivery services to order food prepared
away-from-home and associated sociodemographic
characteristics: A cross-sectional, multi-country
analysis. International Journal of Environmental
Research and Public Health, 17(14), 1–17.
Li, C., Mirosa, M., & Bremer, P. (2020). Review of online
food delivery platforms and their impacts on
sustainability. Sustainability (Switzerland), 12(14), 1–
17.
Maimaiti, M., Zhao, X., Jia, M., Ru, Y., & Zhu, S. (2018).
How we eat determines what we become: opportunities
and challenges brought by food delivery industry in a
changing world in China. European Journal of Clinical
Nutrition, 72(9), 1282–1286.
Martinez-Plumed, F., Contreras-Ochando, L., Ferri, C.,
Hernandez Orallo, J., Kull, M., Lachiche, N., Ramirez
Quintana, M. J., & Flach, P. A. (2019). CRISP-DM
Twenty Years Later: From Data Mining Processes to
Data Science Trajectories. IEEE Transactions on
Knowledge and Data Engineering, 33(8), 3048–3061.
Mokhtarian, P. L., Salomon, I., & Handy, S. L. (2006). The
impacts of ICT on leisure activities and travel: A
conceptual exploration. Transportation, 33(3), 263–
289.
Statista. (2021a). Online Food Delivery - Worldwide.
Statista.com.
https://www.statista.com/outlook/dmo/eservices/onlin
e-food-delivery/worldwide?currency=usd
Statista. (2021b). Most used food delivery app orders
Indonesia 2021. https://www.statista.com/statistics/
1149349/indonesia-favorite-food-delivery-apps/
Statista. (2021c). Online Food Delivery - Indonesia.
https://www.statista.com/outlook/dmo/eservices/onlin
e-food-delivery/indonesia
Suhartanto, D., Ali, M. H., Tan, K. H., Sjahroeddin, F., &
Kusdibyo, L. (2019). Loyalty toward online food
delivery service: the role of e-service quality and food
quality. Journal of Foodservice Business Research,
22(1), 2–3.
Suhartanto, D., Dean, D., Leo, G., & Triyuni, N. N. (2019).
Millennial Experience With Online Food Home
Delivery. Interdisciplinary Journal of Information,
Knowledge, and Management, 14, 277–279.
Vu, K., Hanafizadeh, P., & Bohlin, E. (2020). ICT as a
driver of economic growth: A survey of the literature
and directions for future research. Telecommunications
Policy, 44(2), 101922.
Xie, J., Xu, Y., & Li, H. (2021). Environmental impact of
express food delivery in China: the role of personal
consumption choice. Environment, Development, and
Sustainability, 23(6), 8234–8251.
Zhang, S., Pauwels, K., & Peng, C. (2019). The Impact of
Adding Online-to-Offline Service Platform Channels
on Firms' Offline and Total Sales and Profits. Journal
of Interactive Marketing, 47, 115–128.
ICEIS 2022 - 24th International Conference on Enterprise Information Systems
178
