
Evaluation of Risk Factors for Fall in Elderly People from Imbalanced
Data using the Oversampling Technique SMOTE
Gulshan Sihag
1
, Pankaj Yadav
2
, Veronique Delcroix
1
, Vivek Vijay
2
, Xavier Siebert
3
,
Sandeep Kumar Yadav
2
and Franc¸ois Puisieux
4
1
Univ. Polytechnique Hauts-de-France, CNRS, UMR 8201 - LAMIH, F-59313 Valenciennes, France
2
Department of Mathematics, Indian Institute of Technology, Jodhpur, India
3
Univ. de Mons, Facult
´
e Polytechnique, D
´
epartement de Math
´
ematique et Recherche Op
´
erationnelle, Belgium
4
D
´
epartment de G
´
erontologie, H
ˆ
opital Universitaire de Lille, 59037 Lille cedex, France
Francois.Puisieux@chru-lille.fr
Keywords:
Classification, Imbalanced Data, SMOTE, Fall Prevention, Risk Factors for Falls.
Abstract:
Prevention of falls requires providing a small number of recommendations based on the risk factors present
for a person. This article deals with the evaluation of 12 modifiable risk factors for fall, based on a selection of
45 variables from a real data set. The results of four classifiers (Logistic Regression, Random Forest, Artificial
Neural Networks, and Bayesian Networks) are compared when using the initial imbalanced data set, and after
using the balancing method SMOTE. We have compared the results using four different measures to evaluate
their performance (balanced accuracy, area under the Receiver Operating Characteristic (ROC) curve F1-score,
and F2-score). The results show that there is a significant improvement for all the classifiers when classifying
each target risk factor using the data after balancing with SMOTE.
1 INTRODUCTION
In the elderly, falls are a leading cause of morbidity
and disability. Falls are a common and serious health
issue that can have life-changing consequences. Fall
prevention contributes to prolonging the autonomy
of the elderly. It requires to provide a small num-
ber of recommendations depending on the risk fac-
tors present for a person. Thus the repeated evalua-
tion of risk factors is the basis of fall prevention. The
use of machine learning algorithms to detect health
related risks in patients is now usual. But, most of the
machine learning classifiers trained on data with an
uneven distribution of classes are prone to over pre-
dicting the majority class. As a result, the minority
class has a higher rate of misclassification. In addi-
tion, classification algorithms penalize false positive
and false negative equally, which is not adapted for
imbalanced data.
This study is based on a real imbalanced data
set from Lille’s Hospital in France, corresponding
to 1810 patients from the service of fall prevention.
These patients are sent in that service because of the
possibility of a high risk of fall. Among the 45 se-
lected variables, we focus on 12 target variables, each
corresponding to a modifiable risk factor for fall. For
each of them, we address a problem of binary classi-
fication. The positive value represents the presence of
the risk factor, that we aim to detect. The 12 selected
risk factors for fall are modifiable, meaning that they
are associated with recommendations and actions that
contribute to decrease each of these risks, and thus re-
duce the risk of fall. The final objective is to develop
an application of fall prevention that provides a small
number of well adapted recommendations for a given
person based on the prediction of risk factors for fall.
Such an application aims also to participate in active
ageing.
These 12 targets are divided in two groups: in the
first group, the positive value corresponds to the ma-
jority class, whereas in the second group, the positive
value corresponds to the minority class. The data set
is more or less imbalanced regarding the target vari-
able.
In order to improve the prediction, we utilize
the advantage of Synthetic Minority Over-sampling
Technique (SMOTE) (Chawla et al., 2002). SMOTE
is a technique of over-sampling, meaning that it in-
50
Sihag, G., Yadav, P., Delcroix, V., Vijay, V., Siebert, X., Yadav, S. and Puisieux, F.
Evaluation of Risk Factors for Fall in Elderly People from Imbalanced Data using the Oversampling Technique SMOTE.
DOI: 10.5220/0011041200003188
In Proceedings of the 8th International Conference on Information and Communication Technologies for Ageing Well and e-Health (ICT4AWE 2022), pages 50-58
ISBN: 978-989-758-566-1; ISSN: 2184-4984
Copyright
c
2022 by SCITEPRESS – Science and Technology Publications, Lda. All rights reserved

creases the number of minority class members by re-
sampling the data set. We have selected this data level
approach to address imbalanced data because it al-
lows to benefit from the complete initial data set (no
loss of information) and also because previous com-
parisons with other techniques on our data set reveal
its advantage.
We use three well known classifiers, random for-
est, artificial neural network and logistic regression
along with a Bayesian network. The interest of this
probabilistic graphical model is to be explainable,
which is important in the context of the development
of an application of fall prevention.
In Section 2, we present an overview of previous
works done in the use of imbalanced data in medical
field. We present the data set, the pre-processing steps
and the description of selected and target variables in
Sections 3 to 6 respectively. Section 7 discusses the
methodology whereas section 8 presents the results
and discussions. Finally, we conclude the article.
2 RELATED WORKS
Data mining combined with machine learning is a
powerful tool for resolving a wide range of issues.
Healthcare data is difficult to manually handle due
to the large number of data sources. Artificial in-
telligence advancements have introduced precise and
accurate systems for medical applications that deal
with sensitive medical data(Ahmed et al., 2020). We
present an overview of some of the work done in the
use of imbalanced data in the medical field.
In study (Shuja et al., 2020), the author uses data
mining techniques to create a model for diabetic pre-
diction. At first step they preprocess the data us-
ing the Synthetic Minority Oversampling Technique,
and then feed this preprocessed data to five classifiers
(Bagging, Support Vector Machine, Multi-Layer Per-
ceptron, Simple Logistic, and Decision Tree) in order
to select the best classifier for a balanced data set to
predict diabetes. In another study (Ishaq et al., 2021),
the authors classify the survivors during heart fail-
ure from a data set of 299 hospitalised patients. The
goal is to identify key characteristics and data min-
ing techniques that can improve the accuracy of car-
diovascular patient’s survival prediction. This study
uses nine classification models to predict patient sur-
vival: Decision Tree, Adaptive Boosting Classifier,
Logistic Regression, Stochastic Gradient classifier,
Random Forest, Gradient Boosting classifier, Extra
Tree Classifier (ETC), Gaussian Naive Bayes classi-
fier, and Support Vector Machine. Synthetic Minority
Oversampling Technique (SMOTE) is used to solve
the problem of class imbalance. To deal with the
problem of classifying imbalanced data, the author, in
study (Jeatrakul et al., 2010), proposed a method that
combines SMOTE and Complementary Neural Net-
work. Three classification algorithms, Artificial Neu-
ral Network, k Nearest Neighbor and Support Vec-
tor Machine, were used for comparison. The bench-
mark data set with various ratios between the minor-
ity and majority classes were obtained from the ma-
chine learning repository at the University of Cali-
fornia Irvine. The findings demonstrate that the pro-
posed combination of techniques is effective and im-
proves the performance. The author in (Guan et al.,
2021) proposed a hybrid re-sampling method to solve
the problems of small sample size and class imbal-
ance which combines SMOTE and weighted edited
nearest neighbour rule (WENN). First, SMOTE uses
linear interpolation to create synthetic minority class
examples. Then WENN uses a weighted distance
function and the k-nearest neighbour rule to detect
and delete unsafe majority and minority class exam-
ples. By taking into account local imbalance and spa-
tial sparsity, the weighted distance function scales up
a commonly used distance.
3 DATA SOURCE
The 1810 patients who attended the Lille University
Hospital Falls Clinic, between January 2005 and De-
cember 2018, were included in the study. The mini-
mum and maximum age of the patients are 51 and 100
years respectively, with an average age of 81 years
old. Also, the male and female patients are 28% and
72% respectively. The patients are admitted in that
service for a complete day, during which they meet
different medical personnel and each of them explores
a set of factors such as history of falls, nutrition, phys-
ical activities, medical tests such as balance test etc.
At each step, the data collected about the patient are
registered. After that, a team of specialists about the
fall of the elderly gathers around the case file of the
patient and discusses about the most appropriate rec-
ommendations on the basis of the observed risk fac-
tors of the person. At the end of the day, a small num-
ber of appropriate recommendations is selected and
explained to the patient. The patient is invited to come
back 6 months later in the hospital for a short consul-
tation during which an assessment is done regarding
the recommendations and the number of falls during
the last 6 months. This information is added in the
data file which was provided to us for our analysis.
Evaluation of Risk Factors for Fall in Elderly People from Imbalanced Data using the Oversampling Technique SMOTE
51

4 DATA PRE-PROCESSING AND
VARIABLE SELECTION
Data pre-processing has a significant impact on the
performance of machine learning models because un-
reliable samples may lead to wrong outputs (Alasadi
and Bhaya, 2017). To perform a meaningful data pre-
processing, either the domain expert should be inte-
grated in the data analysis or the domain should be
extensively studied before the data is pre-processed
(Kotsiantis et al., 2006). In this study, we have used
expert knowledge to provide a better understanding of
data. Furthermore, common pre-processing steps in-
cluding data set creation, data cleaning, variable sam-
pling, and selection of variables are used to choose
the optimal subset of relevant information. We dis-
cuss these steps in detail below.
Data Cleaning
The data can have many irrelevant and incomplete
variables with missing information. Cleaning is re-
quired to get understandable information from this
kind of data (Garc
´
ıa et al., 2015). At first step, we
have removed variables whose content is not usable
(free text, very heterogeneous type of values). Subse-
quently, variables having missing values greater than
30% are removed. This threshold was chosen to keep
the important information available and to maintain
the quality of data.
Reducing the Number of Variables
This modelling is a step of a process to demon-
strate the interest of a fall prevention system based
on knowledge model. We follow an incremental ap-
proach that consists in beginning with a limited model
size and going through the whole process and make a
second loop in which the model and each step can
be improved. Some general rules that we have estab-
lished to reduce the number of variables are as fol-
lows:
– In case of two variables X, nbX with X a binary
variable and nbX the number of X, we keep only
the binary variable (for example, presence of en-
vironmental factors);
– in case of two variables X, Y where X is a specific
case of Y, meaning that Y is more general, we keep
Y (for example, fracture, Hip fracture)
– in case of two variables X,Y within the same cat-
egory but in different sub classes, create a new
var V = X or Y (for example, variable newTrOst
that regroups biphosphonate and other treatment
against osteoporosis)
Moreover, some continuous variables and discrete
variables with large domain were transformed into
discretized variables with small domain (binary, ter-
tiary etc).
Imputation of Missing Values
Missing data is a common problem faced with real-
world data sets. Missing data can be anything from
missing sequence, incomplete variable, missing files,
incomplete information, data entry error etc. The
cause of missing values can be different and de-
pend on the type (generally classified as missing
completely at random (MCAR), missing at random
(MAR), and ‘missing not at random (MNAR)), miss-
ing values should be considered differently and dealt
with in different ways (Lin and Tsai, 2020). Many
studies have proposed different types of techniques
to impute missing values such as mean imputation, k
nearest neighbours (knn), EM algorithms, Maximum
Likelihood Estimation and Multiple Imputation (Rah-
man and Davis, 2013). Although, these methods have
their own advantages and disadvantages, but we se-
lect knn Imputation over other methods. Reasons of
this selection are: (1) it is very simple and easy to
use as compared to others; (2) it can be applied irre-
spective of the data, that is, whether data are MCAR,
MAR or MNAR (Aljuaid and Sasi, 2016) (which is
the same situation we have with our data). The num-
ber of neighbors is set to five after evaluating different
choices.
5 VARIABLE DESCRIPTION
We now describe the list of 45 variables obtained from
the steps described above. In Table 1, the first 4 vari-
ables are direct features of the person (age, sex, body
mass index and number of falls in last six months),
and the following 24 variables directly represent the
main risk factors for fall identified in the ontology
about fall prevention (Delcroix et al., 2019), devel-
oped previously with the same service of fall pre-
vention of Lille’s Hospital. The remaining 17 vari-
ables, concern secondary risk factors for fall and as-
sociated variables, are as follows: diabete (diabete),
unipedal stance test more than 5 sec (apUniGt5),
cardiac arrhythmia (arythm), cardiopathy (cardiop),
drives her car (conduit), difficulty using the toilets
(difWC), diuretic (diuretiq), avoids going out by fear
of falling (evitSort), get up and go test greater than
20 sec (GUGOgt20), high blood pressure (HTA), lives
in a retirement home (maisRet), podiatric problem
(pbPodo), pneumopathy (pneumo), urologic pathol-
ICT4AWE 2022 - 8th International Conference on Information and Communication Technologies for Ageing Well and e-Health
52

ogy (pathUro), goes out of his/her house (sort), en-
vironmental factors (factEnv), tobacco (tabac). All
the variables are binary (yes: 1, no: 0), except the
variables nbMed3 and BMI4 (discretized in 3 or 4 in-
tervals).
Table 1: List of variables regrouped by categories.
Variable description short
name
age greater than 80 agegt80
sex sex
body mass index BMI4
two falls or more during the last six
months
nbChu2
precipitating factors
number of drugs nbMed3
orthostatic hypotension newHypoT
at least 1 psychotropic drug gt1psych
predisposing factors
balance impairment trEq
gait impairment trMar
sarcopenia d f OuFaiM
activities of daily living less than 5 ADLin f 5
depression dep
stroke or TIA AVCAIT
parkinson disease (PD) or parkinso-
nian syndrome
parkOuSP
neurological disorder other than
stroke, TIA, PD or dementia
auTrNeur
dementia demence
arthritis or rheumatoid arthritis arthPoly
vision disorder trVision
hearing disorder trAudit
behavioral factors
alcohol consumption alc
fear of falling peurTom
walking aids utiATM
severity factors
fracture during a fall or vertebral
collapse
f racturA
confirmed osteoporosis osteoCon f
anti osteoporosis treatment newTrOst
was able to get up off floor on his
own
aSuSeRel
remained on the ground for more
than one hour
gt1hSol
lives alone vitSeul
6 TARGET VARIABLES
Among the list of variables in Table 1, twelve target
variables have been selected for prediction because
of the interest to evaluate their value. Indeed, in-
formation about these risk factors is frequently not
available, outside of specialized fall prevention ser-
vices. Evaluating how probable is the presence, ei-
ther present or future, of these factors is interesting
for several reasons:
1. All these variables contribute to evaluate the risk
of fall, and they are all modifiable, meaning that
some actions are possible to reduce that risk.
2. Depression, dementia, orthostatic hypotension,
the Parkinson disease and other neurological dis-
orders are not always diagnosed; as a conse-
quence, evaluating their risk of presence allows
to warn the physician that further investigations
should be done.
3. Regarding osteoporosis and loss of autonomy, it
is interesting to assess their risk of becoming pos-
itive in the future, even if they are not currently
present, in order to prevent them.
Table 2 provides the list of target variables and their
prevalence. We distinguish two groups among these
target variables:
– Group A - the risk factors with majority class 1
– Group B - the risk factors with majority class 0.
The target variables are listed by decreasing order of
their prevalence.
Table 2: Target Risk Factors for Fall and their group.
Group Target variable prevalence of the RFF
A trMar 83.3 %
A peurTom 77.2 %
A trEq 74.5 %
A auTrNeur 70.1 %
A dFouFaiM 66 %
A nbChu2 58.4 %
B demence 42.2 %
B newHypoT 32.5 %
B dep 28.4 %
B ADLinf5 25.5 %
B osteoConf 19.2 %
B parkOuSP 16.5 %
7 METHODOLOGY
In this article we compare the results using imbal-
anced data and data after balancing with the over-
sampling method SMOTE, for four classifiers (Lo-
Evaluation of Risk Factors for Fall in Elderly People from Imbalanced Data using the Oversampling Technique SMOTE
53
gistic Regression, Random Forest, Artificial Neural
Networks and Bayesian Networks) to evaluate 12 dif-
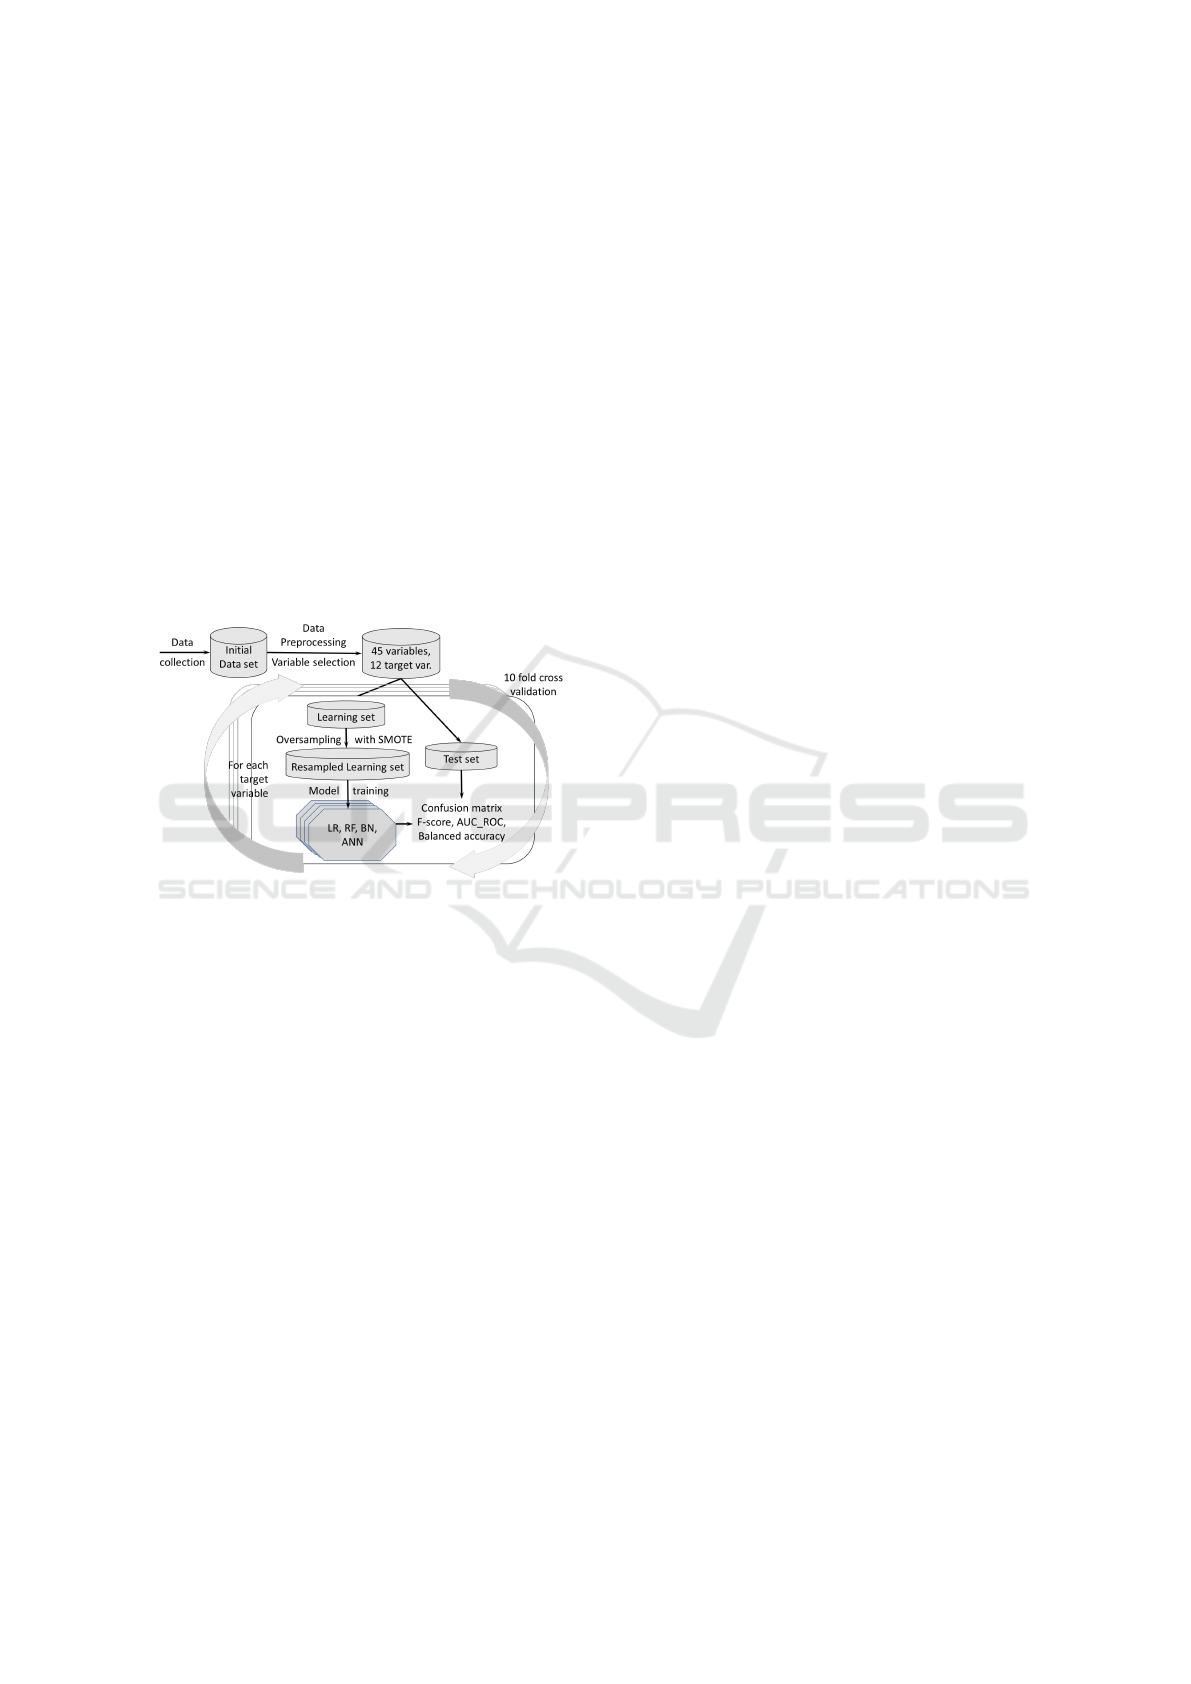
ferent target risk factors. Figure 1 provides a general
view of the methodology. We use 10 fold cross val-
idation where for each fold 90% of data is used as
training set and 10% of the data is used as test set.
When using SMOTE, the balancing method is used
only on the training set. Indeed, balancing the test set
may artificially improve the results, while it would not
be the same after deploying the classifier in real con-
ditions. The confusion matrix is computed and we
use different measures to evaluate the quality of the
evaluation: f1-score, f2-score, area under the ROC
curve and balanced-accuracy. The whole process is
repeated for each of the 12 target variables.
Below, we describe the balancing method SMOTE
and we present the different classifiers and measures
used in our study.
Figure 1: General view of the methodology.
7.1 Synthetic Minority Oversampling
Technique (SMOTE)
Consider a given training data set T with m exam-
ples, we define: T = (x
i
, y
i
), (i = 1, ··· , m), where
x
i
∈ X is an observation in the n-dimensional space,
X = ( f
1
, f
2
, · ·· , f
n
), and y
i
∈ Y = 1, ·· · , I is a class
identity label related with instance x
i
. Typically, I = 2
shows the two-class classification problem. We define
subsets T
min
⊂ T and T
ma j
⊂ T, where T
min
is the set
of minority class examples in T, and T
min
∩ T
ma j
= φ ,
and T
min
∪ T
ma j
= T .
The SMOTE algorithm creates synthetic data by
using some resemblance between available minority
examples. For subset T
min
∈ T , consider the K-nearest
neighbors for each example x
i
∈ T
min
, for some spec-
ified integer K; the K-nearest neighbors are described
as the K elements of T
min
whose euclidian distance
between itself and x
i
under consideration shows the
smallest magnitude along the n-dimensions of feature
space X. For creating a synthetic sample, select one
of the K-nearest neighbors randomly, multiply the re-
spective feature vector difference by a random num-
ber between [0, 1], and then add this vector to x
i
.(He
and Garcia, 2009)
x
new
= x
i
+ δ × ( ˆx
i
− x
i
),
where, x
i
∈ T
min
is the minority observation under
consideration, ˆx
i
is one of the K-nearest neighbors for
x
i
: ˆx
i
∈ T
min
, and δ is a random number. Hence, the fi-
nal synthetic observation is a point along the line seg-
ment joining x
i
and the randomly selected K-nearest
neighbor ˆx
i
.
7.2 Different Classifiers Used
We have used four different classifiers, namely, Lo-
gistic Regression (LR), Random Forest (RF), Artifi-
cial Neural Networks (ANN), and Bayesian Networks
(BN). We have chosen LR, RF and ANN for our anal-
ysis because they are among the most frequently used
classifiers and also in our previous study(Sihag et al.,
2020) we have seen that there is no significant dif-
ference when using other machine learning methods
such as Support Vector Machine (SVM) or Decision
Tree (DT). Furthermore, We choose BN since proba-
bilistic graphical models are explainable, which is an
important feature for the final users. Now we will give
a brief description about the methods:
Logistic Regression is a statistical model that uses
a logistic function to model a dependent variable. It
is used in various fields, including machine learning,
most medical fields, and social sciences. For exam-
ple, logistic regression may be used to predict the risk
of developing a given disease (e.g. diabetes; coro-
nary heart disease), based on observed characteristics
of the patient (Russell and Norvig, 2002)
Random Forest is an ensemble learning method for
classification, regression and other tasks that operate
by constructing a multitude of decision trees at train-
ing time and outputting the class that is the mode
of the classes (classification) or mean prediction (re-
gression) of the individual trees (Russell and Norvig,
2002).
Artificial Neural Network is made up of inter-
connected nodes that form a network with varying
weights between them. The relationship between the
neuron’s input and output can be described as follows:
y = f (
n
∑
i=1
w
i
x
i
+ b),
where x
i
denotes the input signal, w
i
denotes the
weight, y denotes the output, b denotes the threshold,
and f denotes the activation function. These neurons
are linked together to form neural networks (Russell
and Norvig, 2002).
ICT4AWE 2022 - 8th International Conference on Information and Communication Technologies for Ageing Well and e-Health
54

Bayesian Network is a graphical representation of a
set of variables U = {X
1
, X
2
, . . . , X
n
} with a joint prob-
ability that can be factorized as follows:
P(X
1
, X
2
, ..., X
n
) =
n
∏
i=1
P(X
i
|Parent(X
i
))
where Parent(X
i
) is the set of variables that corre-
spond to direct predecessors of X
i
in the graph. It con-
sists of a directed acyclic graph and a set of the local
probability distributions, one for each node/variable
(Koller and Friedman, 2009).
7.3 Evaluation Metrics Used
Machine learning models can be evaluated using a
variety of methods. The use of a variety of evalu-
ation tools is expected to support the growth of an-
alytical research. Since our data are imbalanced, we
measure the performance of classifier using F1-Score,
F2-score, ROC-AUC and balanced accuracy. In fall
prevention, reducing the false negative is the first
objective since it corresponds to the positive cases
whose risk factor is not detected (no recommenda-
tion is given to patient at risk). We do not use ac-
curacy since it is generally not appropriate for im-
balanced data, because the same importance is given
to the majority class and minority class. We use the
F1-score, F2-score and ROC-AUC and balanced ac-
curacy since their definitions include the recall which
is well adapted to evaluate the ability of a classifier to
reduce the number of false negative. However, using
only the recall does not allow to evaluate the ability of
the classifier to reduce also the false positive. A brief
description of the measures used is as follows:
A confusion matrix is used to describe the perfor-
mance of a classification model (or ”classifier”) on a
set of test data for which the true values are known.
Shown in table 3, where TN (TP) is number of neg-
ative (positive) samples correctly classified, and FP
(FN) is number of negative (positive) samples incor-
rectly classified as positive (negative)(Sokolova et al.,
2006).
Table 3: A confusion matrix.
predict predict
Positive Negative
Actual Positive TP FN
Actual Negative FP TN
Balanced Accuracy is used when dealing with im-
balanced data. It’s the arithmetic mean of the true
positive rate (also called recall or sensitivity) and the
true negative rate (also called specificity).
BalancedAccuracy =
1
2
(
T P
T P + FN
+
T N
T N + FP
)
F1-score is a harmonic mean of the true positive rate
(recall) and precision (Sokolova et al., 2006), where
Precision =
T P
T P + FP
; Recall =
T P
T P + FN
F1 − score =
2 ∗ Precision ∗ Recall
Recall + Precision
In our case, the main focus is not to miss a risk
factor for fall, meaning that we want FN to be as low
as possible. However, since we also want to reduce
FP, we need to adapt the compromise between recall
and precision, giving a higher importance to the re-
call. This is the reason why we also consider the F2-
score.
F2-score is used when recall is twice as important as
precision:
F2 − score =
5 ∗ Precision ∗ Recall
4 ∗ Recall + Precision
Receiver Operating Characteristic (ROC) is a
commonly used graph that summarizes the perfor-
mance of a classifier over all possible thresholds. It is
generated by plotting the True Positive Rate (y-axis)
against the False Positive Rate (x-axis) as you vary the
threshold for assigning observations to a given class.
It is a useful metric for classifier performance, partic-
ularly when dealing with imbalanced data, and it is
independent of the decision boundary. The line x = y
denotes the strategy of guessing a random class or a
constant class in all cases. The ideal situation for a
model is a True Positive Rate of 1 and a False Positive
Rate of 0. The performance of a classification model
can be summarised using the area under the ROC and
the higher is the area, the best is the classifier (Castro
and Braga, 2008).
8 RESULTS AND DISCUSSION
In order to see the difference when using imbalanced
data for classifications and using the data after bal-
ancing with SMOTE, we have compared the results
for four different classifiers namely Logistic Regres-
sion (LR), Random Forest (RF), Artificial Neural Net-
works (ANN), and Bayesian Networks (BN).
The obtained results with all four classifiers to
evaluate the 12 risk factors for fall are very similar,
whatever the target variable and the quality measure.
As a consequence, the average results of these classi-
fiers are a good way to display the results. Figure 2
shows the average value of the four classifiers when
comparing AUC-ROC, balanced accuracy, F1 score
Evaluation of Risk Factors for Fall in Elderly People from Imbalanced Data using the Oversampling Technique SMOTE
55
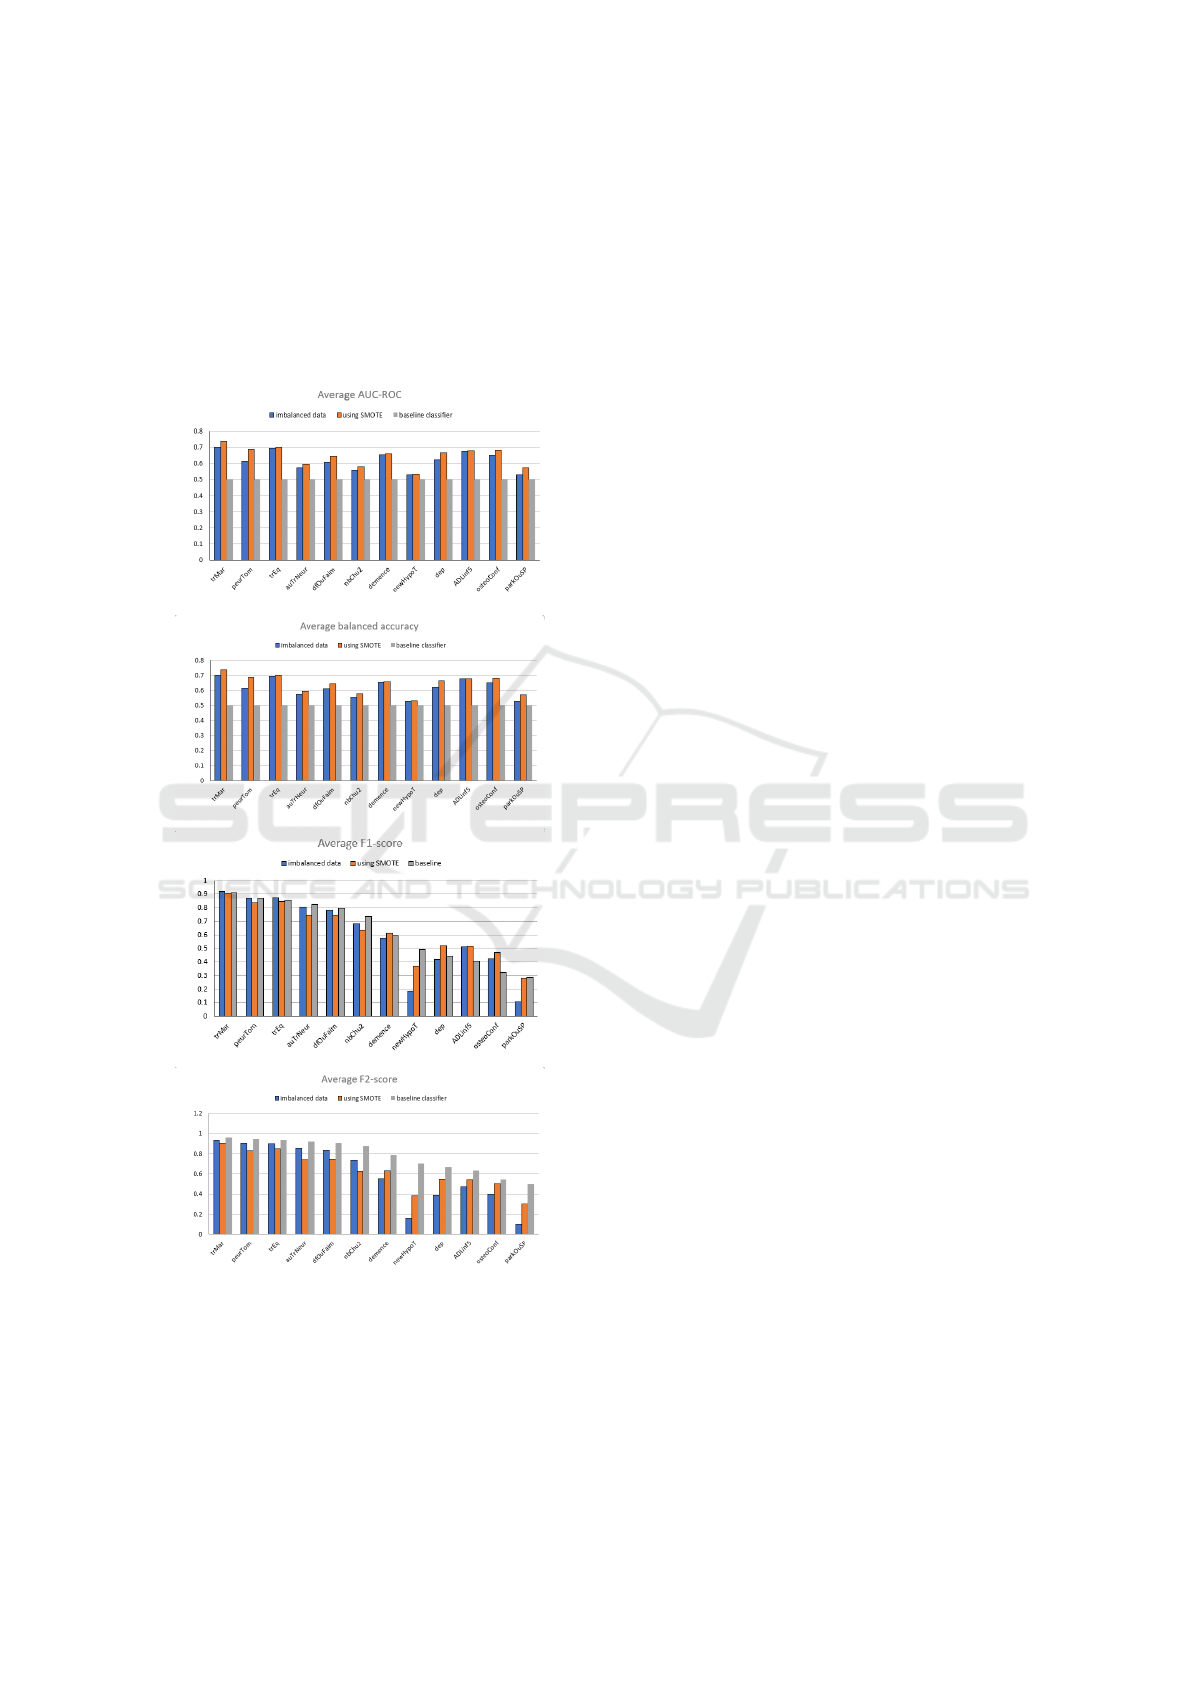
and F2-score for the 12 target variables using imbal-
anced and balanced data. The X-axis represents the
list of target variables and the Y-axis represents the
value of a given measure for given imbalanced or bal-
anced data. We also plot the results of the baseline
classifier that always predict 1, meaning that the true
positive rate (recall) is 1, and the true negative rate is
0.
Figure 2: Average quality of different classifiers regarding
(1) AUC-ROC, (2) Balanced accuracy, (3) F1-score, (4) F2-
score for 12 target variables using imbalanced and balanced
data respectively and compared with the baseline classifier.
Results about balanced accuracy and AUC-ROC
(first two figures) show that the classifiers provide
better results than the baseline classifier for all tar-
get variables, and that using SMOTE provide an im-
provement for all target risk factor. Results about F-
score (last two figures) show that we have to distin-
guish the two groups A and B of target variables (see
Table 2). Results on F1-score and F2-score have the
same general shape: on the left, the F-score of vari-
ables in group A is not improved by using SMOTE,
whereas on the right, the F-score of variables in group
B is significantly increased by using SMOTE. Finally,
using SMOTE allows to outperform the F1-score of
the baseline classifier for the variables whose major-
ity class is the negative class, except for the variables
newHypoT and parkOuSP.
About results oregarding the variables newHypoT
and parkOuSP: First, we have very poor results for F-
score without using SMOTE, and an enormous gain
after balancing the training set. This observation may
be the result of over-fitting for these two variables
when using SMOTE. In order to evaluate over-fitting,
we compute the difference of performance obtained
on the training set and on the test set. These two
variables have the highest difference for the four mea-
sures, and this difference is much larger when using
SMOTE. This confirms that we have over-fitting for
these two variables, mostly when using SMOTE.
Finally, we had an interview with a specialist of
fall prevention to analyse those results. And it ap-
pears that the selected variables are not sufficient to
evaluate the Parkinson disease or hypotension. As a
consequence, we remove the variables newHypoT and
parkOuSP for the summary of the evaluation.
Table 4 presents the average difference in bal-
anced accuracy, AUC-ROC, F1-score and F2-score
for the complete group A and the group B’ restricted to
the four remaining variables (after removing the vari-
ables newHypoT and parkOuSP). The results show
that the average increase in AUC - ROC and balanced
accuracy in group A and B’ is 3.2 % and 2.2 % respec-
tively.
There is average 3.5 % decrease in F1-score (re-
spectively 7.7 % in F2-score) for variables in group
A, whereas the average increase in F1-score and F2-
score for the risk factors in group B’ is 4.6 % and 10.7
% respectively.
8.1 Statistical Tests
In order to compare the difference for doing classi-
fication using balanced data versus the original im-
balanced data, a one tailed t-test is performed. The
null hypothesis states that there is no improvement af-
ter balancing the data by using SMOTE. In Figure 2,
the average comparison of balanced accuracy, AUC
ICT4AWE 2022 - 8th International Conference on Information and Communication Technologies for Ageing Well and e-Health
56

Table 4: Average percentage difference between the qual-
ity measures AUC-ROC, balanced accuracy, F1-score and
F2-score when using the initial imbalanced data set and the
balanced data set with SMOTE.
group A group B’
AUC - ROC 3.2 2.2
Balanced accuracy 3.2 2.2
F1 - score -3.5 4.6
F2 - score -7.7 10.7
- ROC F1-score and F2-score for all the classifiers
using balanced versus imbalanced data is shown for
each group.
We can see from table 5 that the null hypotheses
are rejected in group A for all the measures as the p-
values are negligible. In case of group B’, the null
hypothesis is rejected at 92%, 92% and 94% level
of significance for balanced accuracy, AUC-ROC and
F1-score respectively. The p-values for F2-score is
also negligible in group B’. Hence from these results
we can say that there is significant improvements in
the balanced accuracy, AUC-ROC, F1 as well as F2
scores for all the classifiers when classifying each
target risk factor using the data after balancing with
SMOTE.
Table 5: p-Value of one tailed t-test with Hypothesis Testing
for no improvement.
p-values
group A group B’
Bal. Acc. 0.0099 0.0708
AUC-ROC 0.0099 0.0708
F1-score 0.0015 0.0531
F2-score 0.0009 0.0073
9 CONCLUSION
In this study, we have discussed the problem of clas-
sification with imbalanced data and analysed the im-
pact of using data balancing technique, SMOTE. A
real data set from Lille’s Hospital in France, corre-
sponding to 1810 patients from the service of fall pre-
vention is used, which is highly imbalanced. In order
to see the difference when using imbalanced data ver-
sus the data after balancing with SMOTE, we have
compared the results using four different classifiers
namely Logistic Regression, Random Forest, Artifi-
cial Neural Networks, and Bayesian Networks. To
evaluate the performance of different classifiers four
different measures Balanced Accuracy, F1-score, F2-
score, and area under the Receiver Operating Charac-
teristic (ROC) curve are used. As observed, all the
classifiers have good balanced accuracy as well as
AUC - ROC scores when using imbalanced data ir-
respective of the target variable. But, when looking
at F1-score and F2-score the results are dominated by
the target variables whose majority class is 1. Now,
after balancing the data using SMOTE, AUC - ROC
score as well as balanced accuracy are improved for
each target risk factor. Also, the results for F1-score
and F2-score are no longer dominated by the target
variables whose majority class is 1. Furthermore,
the one-tailed t-test at the end of the study confirms
our findings that there is significant improvements in
AUC - ROC and balanced accuracy for all target risk
factors when using SMOTE, and that there is signif-
icant improvements in F1-score and F2-score for the
target variables whose majority class is 0 when using
SMOTE.
ACKNOWLEDGEMENTS
This research is supported by the Hauts-de-France re-
gion, the University of Mons, Belgium, the Ministry
of Higher Education and Research and the National
Center for Scientific Research. Also, we are grateful
to Dr. C
´
edric Gaxatte and the service of fall preven-
tion of Lille’s hospital for their support.
REFERENCES
Ahmed, Z., Mohamed, K., Zeeshan, S., and Dong, X.
(2020). Artificial intelligence with multi-functional
machine learning platform development for better
healthcare and precision medicine. Database, 2020.
Alasadi, S. A. and Bhaya, W. S. (2017). Review of data pre-
processing techniques in data mining. Journal of En-
gineering and Applied Sciences, 12(16):4102–4107.
Aljuaid, T. and Sasi, S. (2016). Proper imputation tech-
niques for missing values in data sets. In 2016 Inter-
national Conference on Data Science and Engineer-
ing (ICDSE), pages 1–5. IEEE.
Castro, C. L. and Braga, A. P. (2008). Optimization of the
area under the roc curve. In 2008 10th Brazilian Sym-
posium on Neural Networks, pages 141–146. IEEE.
Chawla, N. V., Bowyer, K. W., Hall, L. O., and Kegelmeyer,
W. P. (2002). Smote: synthetic minority over-
sampling technique. Journal of artificial intelligence
research, 16:321–357.
Delcroix, V., Essghaier, F., Oliveira, K., Pudlo, P., Gaxatte,
C., and Puisieux, F. (2019). Towards a fall preven-
tion system design by using ontology. en lien avec
les Journ
´
ees francophones d’Ing
´
enierie des Connais-
sances, Plate-Forme PFIA.
Garc
´
ıa, S., Luengo, J., and Herrera, F. (2015). Data prepro-
cessing in data mining, volume 72. Springer.
Evaluation of Risk Factors for Fall in Elderly People from Imbalanced Data using the Oversampling Technique SMOTE
57

Guan, H., Zhang, Y., Xian, M., Cheng, H.-D., and Tang,
X. (2021). Smote-wenn: Solving class imbalance and
small sample problems by oversampling and distance
scaling. Applied Intelligence, 51(3):1394–1409.
He, H. and Garcia, E. A. (2009). Learning from imbalanced
data. IEEE Transactions on knowledge and data engi-
neering, 21(9):1263–1284.
Ishaq, A., Sadiq, S., Umer, M., Ullah, S., Mirjalili, S., Ru-
papara, V., and Nappi, M. (2021). Improving the pre-
diction of heart failure patients’ survival using smote
and effective data mining techniques. IEEE Access,
9:39707–39716.
Jeatrakul, P., Wong, K. W., and Fung, C. C. (2010). Clas-
sification of imbalanced data by combining the com-
plementary neural network and smote algorithm. In
International Conference on Neural Information Pro-
cessing, pages 152–159. Springer.
Koller, D. and Friedman, N. (2009). Probabilistic graphical
models: principles and techniques. MIT press.
Kotsiantis, S. B., Kanellopoulos, D., and Pintelas, P. E.
(2006). Data preprocessing for supervised leaning.
International journal of computer science, 1(2):111–
117.
Lin, W.-C. and Tsai, C.-F. (2020). Missing value imputa-
tion: a review and analysis of the literature (2006–
2017). Artificial Intelligence Review, 53(2):1487–
1509.
Rahman, M. M. and Davis, D. N. (2013). Machine learning-
based missing value imputation method for clinical
datasets. In IAENG transactions on engineering tech-
nologies, pages 245–257. Springer.
Russell, S. and Norvig, P. (2002). Artificial intelligence: a
modern approach.
Shuja, M., Mittal, S., and Zaman, M. (2020). Effective pre-
diction of type ii diabetes mellitus using data mining
classifiers and smote. In Advances in computing and
intelligent systems, pages 195–211. Springer.
Sihag, G., Delcroix, V., Grislin, E., Siebert, X., Piechowiak,
S., and Puisieux, F. (2020). Prediction of risk factors
for fall using bayesian networks with partial health in-
formation. In AIdSH: International Workshop on AI-
driven Smart Healthcare, pages 1–6. IEEE GLOBE-
COM.
Sokolova, M., Japkowicz, N., and Szpakowicz, S. (2006).
Beyond accuracy, f-score and roc: a family of discrim-
inant measures for performance evaluation. In Aus-
tralasian joint conference on artificial intelligence,
pages 1015–1021. Springer.
ICT4AWE 2022 - 8th International Conference on Information and Communication Technologies for Ageing Well and e-Health
58
