
Testing an Eco-Cooperative Adaptive Cruise Control System in a
Large-scale Metropolitan Network
Hao Chen
a
and Hesham A. Rakha
b
Charles E. Via, Jr. Department of Civil and Environmental Engineering, Virginia Tech Transportation Institute, Virginia
Polytechnic Institute and State University, 3500 Transportation Research Plaza, Blacksburg, VA 24061, U.S.A.
Keywords: Eco-driving, Large-scale Traffic Network, Vehicle Engine Type, Signalized Intersections, Energy Optimized
Solution, Connected and Automated Vehicles.
Abstract: This study implements and tests an Eco-Cooperative Adaptive Cruise Control at Intersections (Eco-CACC-I)
system in a large-scale metropolitan network to quantify the system-level performance considering different
vehicle powertrains, connected automated vehicle (CAV) market penetration rates, and congestion levels.
Specifically, three vehicle powertrains are considered in this study, including internal combustion engine
vehicles (ICEVs), battery electric vehicles (BEVs) and hybrid electric vehicles (HEVs). This study integrates
the Eco-CACC-I controller with different fuel/energy consumption models, so that the controller can compute
energy-optimized solutions to assist ICEVs, BEVs and HEVs traverse signalized intersections. A simulated
traffic network in the Greater Los Angeles Area including the downtown LA and the immediate vicinity is
used to implement and test the Eco-CACC-I controller. The test results demonstrate that the controller
produces positive impacts on saving fuel/energy consumption, reducing travel time and delays on urban
networks for different combinations of CAV market penetration and congestion levels.
1 INTRODUCTION
Studies have showed that vehicle acceleration,
deceleration maneuvers and idling events near
signalized intersections increase vehicle energy
consumption and emission levels on arterial road,
since vehicle are forced to stop ahead of traffic signals
when encountering red indications, producing shock
waves within the traffic stream (Barth &
Boriboonsomsin, 2008). The communications
between vehicles (V2V) and between vehicles and
infrastructure (V2I) provide additional data for
researchers to develop control strategies such as eco-
driving systems to optimize vehicle trajectories in the
vicinity of signalized intersections to enhance
mobility and reduce vehicle fuel consumption and
emissions (Saboohi & Farzaneh, 2008).
Most of the studies in this area have focused on
developing eco-driving strategies for ICEVs, since
the current car market is dominated by fuel-powered
vehicles. For example, a cooperative adaptive cruise
control system using SPaT information was proposed
a
https://orcid.org/0000-0001-8272-734X
b
https://orcid.org/ 0000-0002-5845-2929
to minimize the absolute acceleration levels of
vehicles and reduce vehicle fuel consumption levels
(Malakorn & Park, 2010). A dynamic programming-
based fuel-optimization strategy was developed using
recursive path-finding principles, and evaluated the
developed strategy using an agent-based modeling
approach (Kamalanathsharma & Rakha, 2014).
Moreover, an eco-driving system entitled Eco-CACC
for fuel-powered vehicles was developed, and field
tests were conducted to demonstrate that the
developed system can efficiently reduce stop-and-go
traffic and produce significant fuel and delay savings
of 31% and 9%, respectively (Almannaa, Chen,
Rakha, Loulizi, & El-Shawarby, 2019).
With the rapid growth of electric vehicles in the
past decade, recently some researchers have started to
develop speed control strategies for electric vehicles,
including BEVs and HEVs. For instance, an eco-
driving technique for BEVs was developed in
(Miyatake, Kuriyama, & Takeda, 2011), and the
vehicle trajectory control problem was formulated as
an optimization problem to minimize the summation
Chen, H. and Rakha, H.
Testing an Eco-Cooperative Adaptive Cruise Control System in a Large-scale Metropolitan Network.
DOI: 10.5220/0011039200003191
In Proceedings of the 8th International Conference on Vehicle Technology and Intelligent Transport Systems (VEHITS 2022), pages 265-272
ISBN: 978-989-758-573-9; ISSN: 2184-495X
Copyright
c
2022 by SCITEPRESS – Science and Technology Publications, Lda. All rights reserved
265

of vehicle power. However, a simple energy model
was used by assuming that the recharge efficiency is
a constant value. Another BEV eco-driving algorithm
was proposed in (Zhang & Yao, 2015), in which an
energy consumption model based on the VT-Micro
model was developed for different operation modes
of BEVs, then an eco-driving model for a single
signalized intersection was proposed using the
developed energy model. However, the proposed
energy consumption model was a statistical model
based on limited collected data, thus the accuracy
may not be good enough for the purpose of
developing an optimal control strategy for dynamic
vehicle maneuvers. The same energy consumption
model was used in (Qi, Barth, Wu, Boriboonsomsin,
& Wang, 2018) to develop a connected eco-driving
system for BEVs. However, the case study used a
2012 Ford Escape with a hybrid engine to represent
the performance of an actual BEV. A more robust
algorithm which uses a realistic energy consumption
model for BEV was developed in (Chen & Rakha,
2020) and the simulated test results demonstrated the
benefits of the developed controller to save energy
consumption and delays. An extension work further
expanded the controller to HEVs, and the test results
from an arterial corridor with three signalized
intersections demonstrated that the proposed system
can effectively reduce stop-and-go traffic in the
vicinity of signalized intersections (Chen & Rakha,
2021).
Most of existing studies investigated the eco-
driving strategies for a single vehicle engine type.
Moreover, the developed algorithms were generally
tested using simplified or small traffic networks, and
none of these studies investigated the performance on
large-scale traffic networks calibrated to real traffic
conditions. Considering the abovementioned
problems, this study implements and tests an Eco-
CACC-I system using a large-scale metropolitan
network to investigate the system-level performances
for different vehicle powertrains (ICEV, BEV and
HEV), CAV market penetration rates and congestion
levels. Based on the previous work, the optimal speed
profiles for different vehicle powertrains are
generally very different under certain conditions,
such as different speed limits and roadway grades.
This study integrates the Eco-CACC-I controller with
different fuel/energy consumption models, so that the
controller can compute energy-optimized solutions to
assist ICEVs, BEVs and HEVs traverse signalized
intersections. A simulated traffic network in the
Greater Los Angeles Area including the downtown
LA and the immediate vicinity is used to implement
and test the Eco-CACC-I controller. The test results
demonstrate the controller can effectively reduce
stopped delay and energy consumption for ICEV,
BEV and HEV in the LA network.
2 Eco-CACC-I CONTROLLER
In this study, the Eco-CACC-I controller uses eco-
driving strategy to compute real-time fuel/energy-
optimized speed profile for assist vehicles pass
signalized intersections. Our previous work
developed various Eco-CACC-I systems for vehicles
with different engine types, including ICEV, BEV
and HEV. In this study, we use the same Eco-CACC-
I framework we developed in previous work, and
incorporate the energy models of ICEV, BEV and
HEV so that the controller can work with different
vehicle types in large-scale traffic network.
2.1 Eco-CACC-I Algorithm
The control region is defined as vehicles follow the
recommended speed by Eco-CACC-I from a distance
upstream of the signalized intersection (defined as
d
up
) to a distance downstream of the intersection
(defined as d
down
), as the Eco-CACC-I algorithm
optimizes speed profile for vehicle approaching and
leaving signalized intersections. Upon approaching a
signalized intersection, the vehicle may accelerate,
decelerate, or cruise (maintain a constant speed)
based on a number of factors, such as vehicle speed,
signal timing and phase, distance to the intersection,
road grade, headway distance, etc. Considering that
the vehicle may or may not need to decelerate when
approaching the traffic signal, two cases are
considered to develop the Eco-CACC-I strategies.
Case 1 doesn’t require the vehicle to decelerate to
pass the signalized intersection. In this case, the
cruise speed for the vehicle to approach the
intersection during the red indication can be
calculated by Equation (1) to maximize the average
vehicle speed during the control region.
𝑢
𝑚𝑖𝑛
𝑑
𝑡
,𝑢
(1
)
In case 2, the vehicle’s energy-optimized speed
profile is illustrated in Figure 1. After entering the
control region, the vehicle with the initial speed of
u(t
0
) needs to brake at deceleration level denoted by
a, then cruise at a constant speed of u
c
to approach the
signalized intersection. After passing the stop bar, the
vehicle should increase speed to u
f
per the vehicle
dynamics model, and then cruise at u
f
until the vehicle
VEHITS 2022 - 8th International Conference on Vehicle Technology and Intelligent Transport Systems
266

leaves the control region. In this case, The following
optimization problem is formulated to compute the
optimum vehicle speed profile, and the only unknown
variables are the upstream deceleration rate a and the
downstream throttle f
p
.
Figure 1: Vehicle optimum speed profile.
Assuming a vehicle enters the Eco-CACC-I
control region at time t
0
and leaves the control region
at time t
0
+T, the objective function entails
minimizing the total energy consumption as
𝑚𝑖𝑛 𝐸𝐶𝑢
𝑡
𝑑𝑡
(2)
where EC denotes the energy consumption at instant
t. The energy models for ICEVs, BEVs and HEVs are
presented in Equations (5) ~ (10). The constraints to
solve the optimization problem can be built according
to the relationships between vehicle speed, location,
acceleration/deceleration as presented below:
𝑢
𝑡
:
⎩
⎪
⎨
⎪
⎧
𝑢
𝑡
𝑢
𝑡
𝑎𝑡
𝑢
𝑡
𝑢
𝑡
𝑡𝑡
𝑡
𝑡𝑡
𝑢
𝑡∆𝑡
𝑢
𝑡
∆𝑡
𝑢
𝑡
𝑢
𝑡
𝑡𝑡
𝑡
𝑡𝑡
𝑇
(3)
𝑢
𝑢
𝑡
𝑡
1
2
𝑎𝑡
𝑢
𝑡
𝑡
𝑑
𝑢
𝑢
𝑡
𝑎
𝑡
𝑡
𝑢
𝑡
𝑑𝑡 𝑢
𝑡
𝑇𝑡
𝑑
𝑢
𝑡
𝑢
𝑎
𝑎𝑎
𝑓
𝑓
𝑓
𝑢
0
(4)
In Equation (3), u(t) is the velocity at instant t; m is
the vehicle mass; 𝑎
𝑡
𝑑𝑣𝑡𝑑𝑡
⁄
is the
acceleration of the vehicle in [m/s
2
] ( 𝑎
𝑡
takes
negative values when the vehicle decelerates);
function F denotes vehicle tractive force and function
R represents all the resistance forces (aerodynamic,
rolling, and grade resistance forces). Note that the
maximum deceleration is limited by the comfortable
threshold felt by average drivers. The throttle value f
p
ranges between f
min
and f
max
. Dynamic programming
(DP) is used to solve the problem by constructing a
graph of the solution space by discretizing the
combinations of deceleration and throttle values and
calculating the corresponding energy consumption
levels; the minimum path through the graph computes
the energy-efficient trajectory and optimum
parameters (Guan & Frey, 2013).
2.2 Energy Consumption Models
The energy consumption models for ICEVs, BEVs
and HEVs are the key inputs to the abovementioned
objective function to solve the optimization problem.
In this study, the fuel/energy consumption models for
various vehicle powertrains are selected by
considering: (1) speed and grade data are the only
required input for the energy models, and vehicle
engine data are not required so that the optimization
problem can be easily solved; (2) the energy models
have been validated and demonstrated to produce
good accuracy compared to empirical data; (3)
models can be easily calibrated to a specific vehicle
type using public data and/or the EPA combined fuel
economy data. By considering those factors, the
following fuel/energy models for ICEV, BEV and
HEV are selected in this study.
The Virginia Tech Comprehensive Power-based
Fuel Consumption Model (VT-CPFM) type 1 is
selected to estimate the instantaneous fuel
consumption rate for ICEV (Park, Rakha, Ahn, &
Moran, 2013). The VT-CPFM utilizes instantaneous
power as an input variable and can be easily
calibrated using publicly available fuel economy data
(e.g., Environmental Protection Agency [EPA]-
published city and highway gas mileage). The VT-
CPFM is formulated as below.
𝐹𝐶
𝑡
𝑎
𝑎
𝑃
𝑡
𝑎
𝑃𝑡
∀ 𝑃𝑡0
𝑎
∀ 𝑃
𝑡
0
(5)
𝑃
𝑡
𝑚𝑎
𝑡
𝑚𝑔∙
𝐶
1000
𝑐
𝑢
𝑡
𝑐
1
2
𝜌
𝐴
𝐶
𝑢
𝑡
𝑚𝑔 𝜃𝑢𝑡
(6)
Where FC
ICEV
(t) is the fuel consumption rate for
ICEV; α
, α
and α
are the model parameters that
can be calibrated for a particular vehicle using public
available vehicle specification information from
manufacturer; P(t) is the instantaneous total power
(kW); 𝑔 [m/s
2
] is the gravitational acceleration; 𝜃 is
the road grade; 𝐶
,𝑐
and 𝑐
are the rolling resistance
parameters that vary as a function of the road surface
type, road condition, and vehicle tire type; 𝜌
[kg/m
3
] is the air mass density; 𝐴
[m
2
] is the frontal
Testing an Eco-Cooperative Adaptive Cruise Control System in a Large-scale Metropolitan Network
267

area of the vehicle, and 𝐶
is the aerodynamic drag
coefficient of the vehicle.
This study uses the Virginia Tech Comprehensive
Power-based EV Energy consumption Model (VT-
CPEM) compute instantaneous energy consumption
levels for BEV (Fiori, Ahn, & Rakha, 2016). The VT-
CPEM only requires the instantaneous speed and the
EV characteristics as input to compute the
instantaneous power consumed. One of the major
advantages of VT-CPEM is that it captures
instantaneous braking energy regeneration, which is
not available in most BEV energy models. The VT-
CPEM model is summarized as below.
𝐸𝐶
𝑡
𝑃
𝑡
∙𝑑𝑡
(7)
𝑃
𝑡
⎩
⎨
⎧
𝑃
𝑡
𝜂
∙𝜂
∙
𝜂
𝑃
∀ 𝑃
𝑡0
𝑃
𝑡
∙𝜂
∙𝜂
∙𝜂
∙𝜂
∀ 𝑃
𝑡0
𝑃
(8)
𝜂
𝑡𝑒
.
|
|
(9)
where EC
BEV
represents the energy consumption for
BEV; P
B
is the power consumed by (regenerated to)
the electric motor; Pw denotes the power at the
wheels computed in Equation (6); P
Aux
is the power
consumed by the auxiliary systems; η
D
and η
M
are the
driveline efficiency and the efficiency of the electric
motor, respectively; η
B
denotes the efficiency from
battery to electric motor; η
rb
represents the
regenerative braking energy efficiency, which can be
computed using Equation (9).
An HEV energy consumption model developed in
(Ahn & Rakha, 2019) is selected to compute
instantaneous energy consumption levels for HEVs.
The model was developed after analyzing field data
and HEV energy consumption behaviors. First, the
amount of fuel consumed is proportionally related to
both the vehicle power and speed; second, the HEV
operates in EV mode when the power is less than 0;
third, the HEV utilizes only an electric mode when
the speed is lower than an EV mode speed (u
a
) and
the required power is lower than a specific power
(P
a
). This model only requires instantaneous speed as
input and can be easily calibrated with high accuracy
to match field data. The HEV energy consumption
model is formulated as below.
𝐹𝐶
𝑡
⎩
⎪
⎨
⎪
⎧
𝐹𝐶
for
𝑃0
𝑢𝑢
and 𝑃𝑃
𝑎𝑏∗𝑢
𝑡
𝑐∗𝑃
𝑡
𝑑∗𝑃
𝑡
for
𝑃0 and 𝑢𝑢
𝑢𝑢
and 𝑃𝑃
(10)
where FC
HEV
(t) is the fuel consumption rate for HEV,
and FC
EV_mode
is the fuel consumption rate in EV
mode and estimated as average fuel consumption in
EV mode; P(t) is the instantaneous total power and
can be computed using Equation (6); and u is the
instantaneous vehicle speed. Statistical analysis of the
empirical data found that the optimum values for v
a
and P
a
are 32 km/h, and 10 kW, respectively (Ahn &
Rakha, 2019).
3 CASE STUDY
3.1 The Simulated Traffic Network
In this study, INTEGRATION was used as the
simulation tool to simulate the traffic network in the
Greater Los Angeles Area including the downtown
LA and the immediate vicinity. INTEGRATION is an
integrated simulation and traffic assignment model
that creates individual vehicle trip departures based
on an aggregated time-varying O-D matrix. In
consideration of traffic control devices and gap
acceptance, INTEGRATION moves vehicles along the
network in accordance with embedded preset traffic
assignment models and the Rakha-Pasumarthy-
Adjerid (RPA) car-following model. A more-detailed
description of INTEGRATION is provided in the
literature (Aerde & Rakha, 2007a, 2007b).
Different data sources are used to build the
microscopic network, including NavTeq for
generating nodes and links, OpenStreetMap for
creating intersection traffic control information, and
Google Maps for validating road attributes – the
number of lanes, one-way streets, speed limits, bus
lane locations, etc. The simulated traffic network in
LA includes 1625 nodes, 3561 links and 457 signals.
A static O-D demand file was generated using
QueensOD (Rakha & Lucic, 2002), a software
application developed by VTTI researchers.
QueensOD estimates the most-likely time-dependent
static O-D using observed link traffic flows, observed
link turning movement counts, link travel times, and
a seed matrix. QueensOD iteratively minimizes the
error between the observed link volumes and
estimated link flow to generate a most-likely O-D
matrix that is as close as possible to the seed matrix.
VEHITS 2022 - 8th International Conference on Vehicle Technology and Intelligent Transport Systems
268
In this study, the median of the traffic count data for
ten randomly selected Tuesdays and Wednesdays in
2014, which were provided by the Caltrans
Performance Measurement System (PEMS), were
used as the input observed link flow data for
QueensOD.
The simulation results were compared against the
traffic count data from PEMS and the corresponding
R values were computed. The statistical analysis
demonstrated that the simulated network is highly
accurate by comparing to the field data collected in
LA. More detailed information of the simulated LA
traffic network can be found in (Du, Rakha, Elbery,
& Klenk, 2018; Elbery, Devorak, Du, Rakha, &
Klenk, 2019).
3.2 Test the Eco-CACC-I Controller
The Eco-CACC-I controller was implemented into
the simulated LA network using the INTEGRATION
software. The Eco-CACC-I controller was enabled on
all the 457 signalized intersections in the LA network.
In particular, 1,606 arterial links (including both
upstream and downstream links) that are controlled
by traffic signals for vehicle entering or existing are
selected to implement the Eco-CACC-I controller. An
experiment design was conducted to test the
performances of the LA network in two scenarios
(base case, Eco-CACC-I), under the combinations of
vehicle type (ICEV, BEV and HEV), traffic demand
(no congestion - 25% demand, mild congestion - 50%
demand and heavy congestion - 100% demand), and
level of market penetration (LMP) rate of the
controlled vehicles (1%, 2%, 5%, 10%, 20%, 25%,
50%, 75% and 100%). It should be noted that 100%
demand was calibrated by one-hour real traffic data
under weekday morning peak traffic conditions,
which represents heavy traffic congestion. Note that
the Eco-CACC-I controllers are disabled in the base
case, and the controllers are enabled on the selected
1,606 arterial links in the Eco-CACC-I case. Each
scenario was simulated using 10 different random
number seeds to address the stochastic characteristics
of real-world traffic conditions, we should point out
that all results reported below are averages across the
10 runs. The comparisons of the test results in two
scenarios are presented as below.
Figure 2: The savings of Eco-CACC-I vs. base for BEV under different CAV market penetration and congestion levels.
Testing an Eco-Cooperative Adaptive Cruise Control System in a Large-scale Metropolitan Network
269
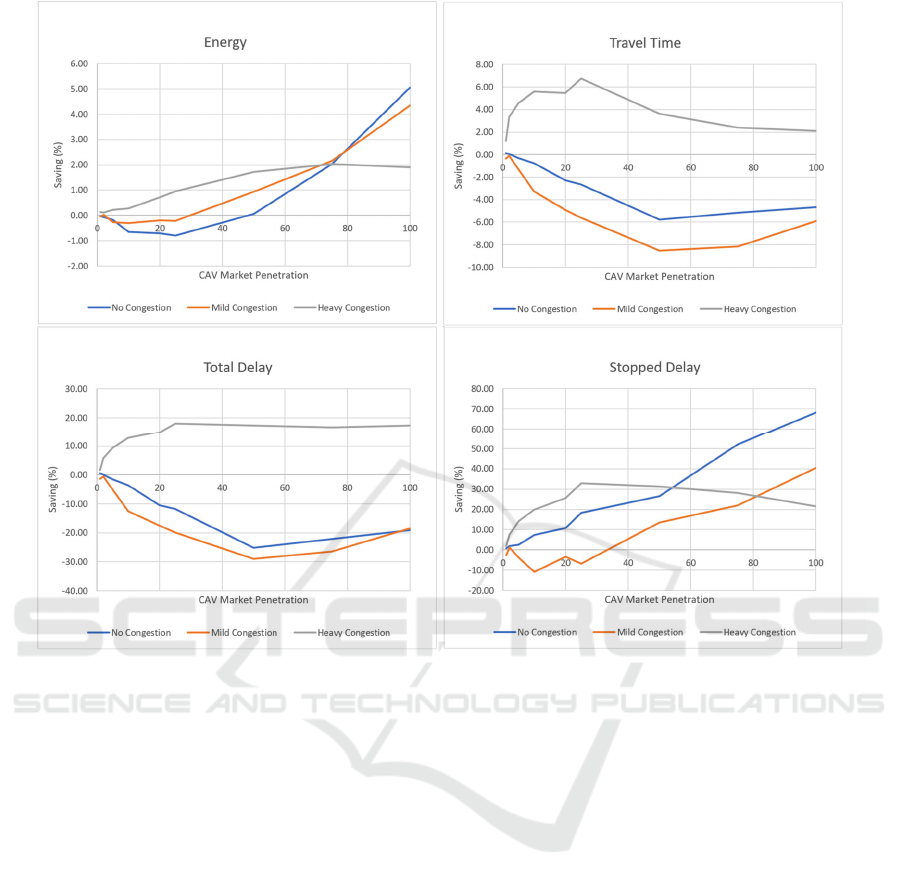
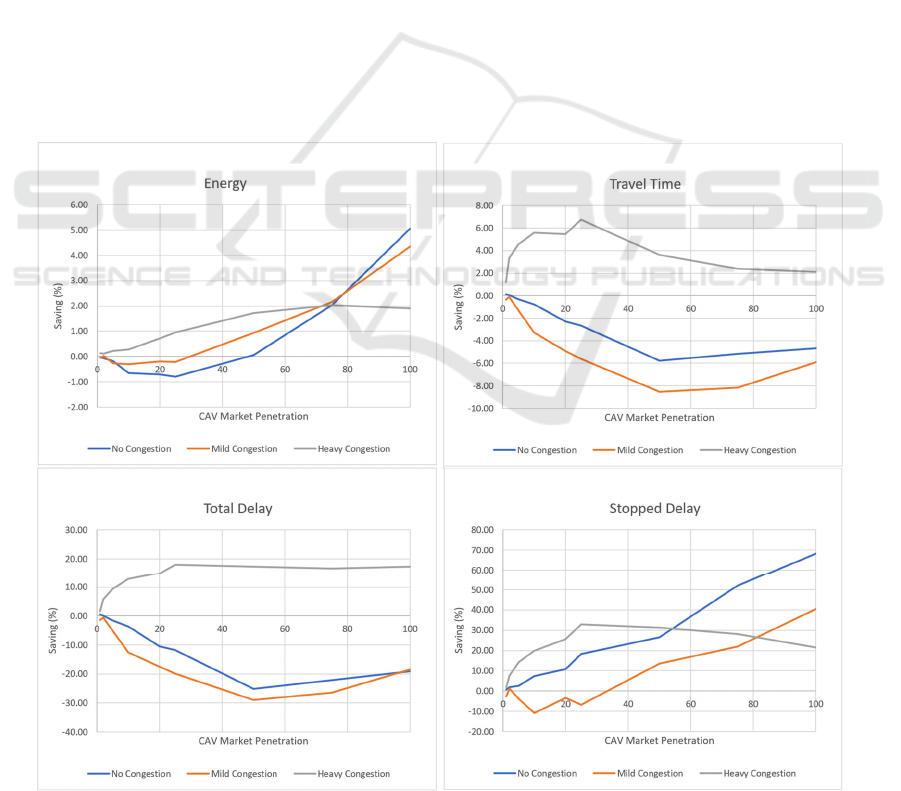
Figure 3: The savings of Eco-CACC-I vs. base for BEV under different CAV market penetration and congestion levels.
Figure 2 illustrates the savings in fuel, travel time,
total delay and stopped delay associated with the
application of the Eco-CACC-I controller for ICEV.
The test results indicate that the Eco-CACC-I
controller reduced the fuel consumption of ICEVs by
up to 6.4%, travel time by up to 8.7%, total delay by
up to 21.5%, stopped delay by up to 68.5%. We
performed t-tests and found the results to be
statistically significant. Figure 2 also demonstrates
that the Eco-CACC-I controller effectively improves
the fuel efficiency of ICEVs in heavily congested
conditions, but the controller increases fuel
consumption by up to 4% when the congestion levels
are low. This is due to the fact that the entire network
uses dynamic vehicle routing and an adaptive traffic
signal controller that continuously changes the traffic
signal timings, which makes the control of the vehicle
very challenging given the continuous stochastic
changes in the system. In addition, the study found
that the Eco-CACC-I controller is most effective for
ICEVs on fuel consumption, travel time, and total
delay when the CAV MPR is 25% and the roads are
heavily congested. The results also indicate that the
Eco-CACC-I controller can effectively reduce ICEV
stopped delay in various congestion levels. The
savings of stopped delay are generally increased with
higher MPRs when the congestion levels are low. The
maximal savings of stopped delay are 68% and 41%
for no congestion and mild congestion levels for a
100% MPR.
Figure 3 illustrates the savings in energy, travel
time, total delay and stopped delay associated with
using the Eco-CACC-I controller for BEV. The
simulation results demonstrate that the Eco-CACC-I
controller produces energy savings of BEVs up to
5.05% (p-value < 0.01) on the LA network. The
energy consumption savings increase as the CAV
MPR increases for all congestion levels. The study
found that the BEV energy savings for no congestion
and mild congestion cases are greater than those of
heavy congestion cases when the CAV MPR is 100%.
Figure 3 also demonstrates that the Eco-CACC-I
controller reduces BEV travel times and the total
delays in the heavily congested cases. In particular,
the controller produces savings in travel time by up to
6.8% (p-value < 0.01) and total delay by up to 17.9%
(p-value < 0.01) at a 25% CAV MPR in heavily
congested
conditions. However, Figure 3 also
VEHITS 2022 - 8th International Conference on Vehicle Technology and Intelligent Transport Systems
270
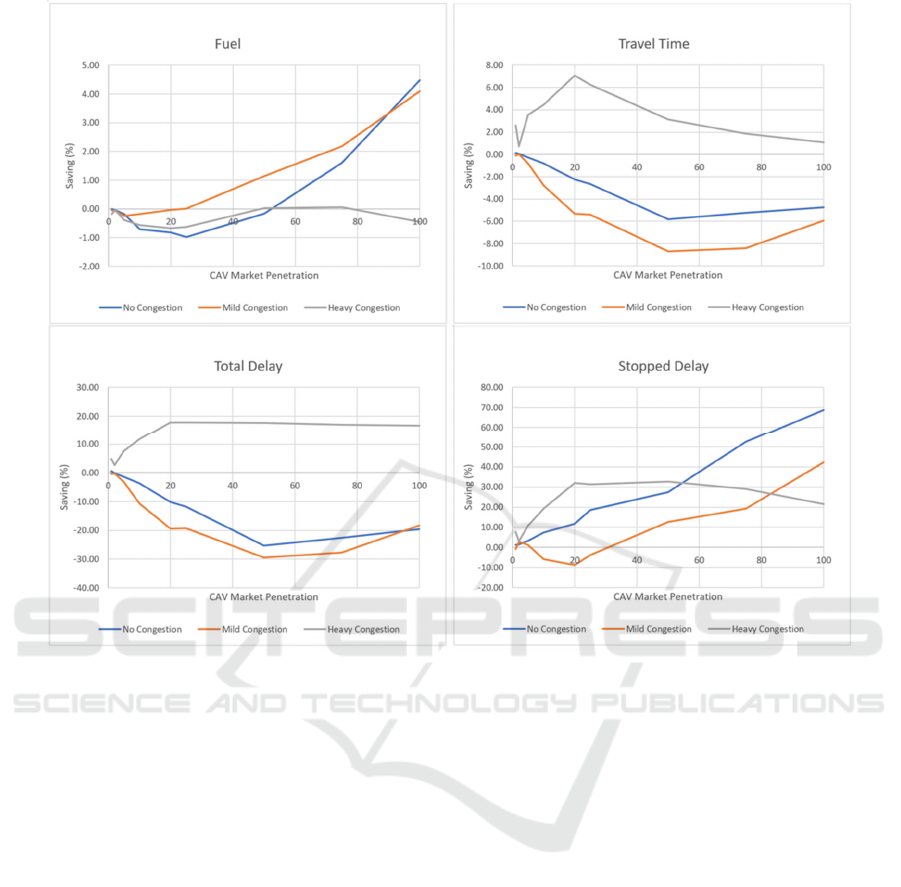
Figure 4: The savings of Eco-CACC-I vs. base for HEV under different CAV market penetration and congestion levels.
demonstrates that the Eco-CACC-I increases both
travel time and total delay in the no congestion and
mild congestion cases when BEV powertrains are
considered. The simulation results indicate that the
BEV Eco-CACC-I controller can effectively reduce
stopped delay under various congestion levels. The
savings in stopped delay generally increase with
higher CAV MPRs for no and mild congestion
conditions. The study found that the Eco-CACC-I
produced savings in BEV stopped delay by up to
68.2% (p-value < 0.01) with a 100% CAV MPR and
no congested conditions.
Figure 4 illustrates the savings in fuel, travel time,
total delay and stopped delay by using the Eco-
CACC-I controller for HEV. The simulation study
found that the Eco-CACC-I controller reduced the
fuel consumption of HEVs by up to 4.5% (p-value <
0.01) when the CAV MPR is 100% with no
congestion in the LA network. The study found that
Eco-CACC-I increased the fuel consumption of
HEVs for most cases. However, Eco-CACC-I
reduced the fuel consumption of HEVs for high CAV
MPR cases (75% and 100%) in no congestion and
mild congestion cases. Figure 4 also demonstrates
that the Eco-CACC-I reduces the travel time by up to
7.1% (p-value < 0.01) and total delay by up to 17.8%
(p-value < 0.01), and stopped delay by up to 32.8%
(p-value < 0.01). The study found that Eco-CACC-I
is most effective on travel time, total delay, and
stopped delay for HEVs when CAV MPRs are
between 20% and 50% and when roadways are
heavily congested. However, Eco-CACC-I is not
effective when the roads are not congested or are
mildly congested. The results also indicate that the
Eco-CACC-I controller can effectively reduce
stopped delay under various congestion levels. The
savings in stopped delay generally increase with
higher CAV MPRs in low to mild traffic congestion.
4 CONCLUSIONS
This study implements and tests an Eco-CACC-I
system on a large-scale metropolitan network to
quantify the system-level impact considering
different vehicle powertrains, CAV market
penetration rates and congestion levels. Specifically,
Testing an Eco-Cooperative Adaptive Cruise Control System in a Large-scale Metropolitan Network
271

three powertrains are considered in this study,
including ICEVs, BEVs and HEVs. This study
integrates the Eco-CACC-I controller with different
fuel/energy consumption models, so that the
controller can compute energy-optimized solutions to
assist ICEVs, BEVs and HEVs traverse signalized
intersections. A simulated traffic network in the
Greater Los Angeles Area including the downtown
LA and the immediate vicinity is used to implement
and test the Eco-CACC-I controller. The test results
demonstrate that the controller has positive impacts
on reducing fuel/energy consumption, travel time,
total and stopped delay, for ICEVs, BEVs and HEVs
for different combinations of CAV market
penetration and congestion levels. More data analysis
on links with or without Eco-CACC-I controllers, and
the further tests to combine Eco-CACC-I with other
controllers (such as freeway speed harmonization,
platooning, eco-routing, etc.) will be considered in
the future work.
ACKNOWLEDGEMENTS
This work was funded by the Department of Energy
through the Office of Energy Efficiency and
Renewable Energy (EERE), Vehicle Technologies
Office, Energy Efficient Mobility Systems Program
under award number DE-EE0008209.
REFERENCES
Aerde, M. V., & Rakha, H. (2007a). INTEGRATION ©
Release 2.30 for Windows: User's Guide – Volume I:
Fundamental Model Features. M. Van Aerde & Assoc.,
Ltd., Blacksburg.
Aerde, M. V., & Rakha, H. (2007b). INTEGRATION ©
Release 2.30 for Windows: User's Guide – Volume II:
Advanced Model Features. M. Van Aerde & Assoc.,
Ltd., Blacksburg.
Ahn, K., & Rakha, H. A. (2019). A Simple Hybrid Electric
Vehicle Fuel Consumption Model for Transportation
Applications Electric and Hybrid Vehicles.
Almannaa, M. H., Chen, H., Rakha, H. A., Loulizi, A., &
El-Shawarby, I. (2019). Field implementation and
testing of an automated eco-cooperative adaptive cruise
control system in the vicinity of signalized
intersections. Transportation Research Part D:
Transport and Environment, 67, 244-262.
Barth, M., & Boriboonsomsin, K. (2008). Real-world
carbon dioxide impacts of traffic congestion.
Transportation Research Record: Journal of the
Transportation Research Board(2058), 163-171.
Chen, H., & Rakha, H. A. (2020). Battery Electric Vehicle
Eco-Cooperative Adaptive Cruise Control in the
Vicinity of Signalized Intersections. Energies, 13(10),
2433.
Chen, H., & Rakha, H. A. (2021). Developing a Hybrid
Electric Vehicle Eco-Cooperative Adaptive Cruise
Control System at Signalized Intersections. Retrieved
from
Du, J., Rakha, H. A., Elbery, A., & Klenk, M. (2018).
Microscopic simulation and calibration of a large-scale
metropolitan network: Issues and proposed solutions.
Retrieved from
Elbery, A., Devorak, F., Du, J., Rakha, H. A., & Klenk, M.
(2019). Large-scale Agent-based Multi-modal
Modeling of Transportation Networks.
Fiori, C., Ahn, K., & Rakha, H. A. (2016). Power-based
electric vehicle energy consumption model: Model
development and validation. Applied Energy, 168, 257-
268.
Guan, T., & Frey, C. W. (2013). Predictive fuel efficiency
optimization using traffic light timings and fuel
consumption model. Paper presented at the Intelligent
Transportation Systems-(ITSC), 2013 16th
International IEEE Conference on.
Kamalanathsharma, R., & Rakha, H. (2014). Agent-Based
Simulation of Ecospeed-Controlled Vehicles at
Signalized Intersections. Transportation Research
Record: Journal of the Transportation Research
Board(2427), 1-12.
Malakorn, K. J., & Park, B. (2010). Assessment of mobility,
energy, and environment impacts of IntelliDrive-based
Cooperative Adaptive Cruise Control and Intelligent
Traffic Signal control. Paper presented at the
Sustainable Systems and Technology (ISSST), 2010
IEEE International Symposium on.
Miyatake, M., Kuriyama, M., & Takeda, Y. (2011).
Theoretical study on eco-driving technique for an
electric vehicle considering traffic signals. Paper
presented at the Power Electronics and Drive Systems
(PEDS), 2011 IEEE Ninth International Conference on.
Park, S., Rakha, H., Ahn, K., & Moran, K. (2013). Virginia
tech comprehensive power-based fuel consumption
model (VT-CPFM): model validation and calibration
considerations. International Journal of Transportation
Science and Technology, 2(4), 317-336.
Qi, X., Barth, M. J., Wu, G., Boriboonsomsin, K., & Wang,
P. (2018). Energy Impact of Connected Eco-driving on
Electric Vehicles Road Vehicle Automation 4 (pp. 97-
111): Springer.
Rakha, H., & Lucic, I. (2002). Variable power vehicle
dynamics model for estimating truck accelerations.
Journal of transportation engineering, 128(5), 412-419.
Saboohi, Y., & Farzaneh, H. (2008). Model for optimizing
energy efficiency through controlling speed and gear
ratio. Energy Efficiency, 1(1), 65-76.
Zhang, R., & Yao, E. (2015). Eco-driving at signalised
intersections for electric vehicles. IET Intelligent
Transport Systems, 9(5), 488-497.
VEHITS 2022 - 8th International Conference on Vehicle Technology and Intelligent Transport Systems
272
