
Multi-parametric Performance Evaluation of Drone-based Surveying for
Disaster Risk Management
Athina Silvestrou, Andreas M. Georgiou
a
, Panayiotis Kolios and Christos G. Panayiotou
University of Cyprus, KIOS Research and Innovation Center of Excellence,
1 Panepistimiou Avenue, P.O. Box 20537, 2109 Aglantzia, Cyprus
Keywords:
Aerial Photogrammetry, UAV, Flight Properties, Orthophoto, Digital Elevation Model, Metashape,
OpenDroneMap.
Abstract:
Disaster situations, either natural or man-made, could be catastrophic as causes massive destruction of infras-
tructures or loss of human lives. First-responders should conduct quickly and efficiently to locate survivors; an
operation that becomes difficult when the existing infrastructure and the conventional communication might
collapse. Unmanned Aerial Vehicles have emerged as a reliable and cost-effective solution, which aids humans
in performing such operations by implementing accurate geographical surveying. The proper combination of
hardware and software components (for the design and implementation) has to be selected to produce appropri-
ate results, both with respect to output quality and processing time. In this paper, photogrammetric approaches
have been investigated in the terms of collection, processing and producing of dense clouds, orthophotos and
digital elevation models considering the aforementioned aspects in disaster risk management missions. Thus,
different datasets have been collected where the drone-based flight along with sensing parameters were jointly
investigated, evaluating the total processing time and model quality. More specific, the following scenarios
were investigated: (i) Selection and combination of the photogrammetric method parameters, (ii) Sensor alti-
tude, and (iii) Area division into separated sectors. The decision about the processing software has be done
after assessing the capabilities and the limitations of each solution, since this will affect time, quality and cost
of the end result. Under this perspective, a commercial and non-commercial tools compared for the data anal-
ysis. Finally, the results of each tool were evaluated while the capabilities and limitations have been perceived.
1 INTRODUCTION
Disaster situations are catastrophic events that are im-
portant problems in all the areas of the world, both
developed and developing. The problem arises from
the extent of the disaster, which either can be natu-
ral (geophysical, hydrological, climatological or me-
teorological) or man-made, which causes massive de-
struction of infrastructures and loss of human lives.
The first few hours following a disaster may be con-
sidered as the golden relief time to save the lives of
several victims by providing emergency aid (Panda
et al., 2019). During the disaster, the existing infras-
tructure and the conventional communication might
collapse, meaning that the affected areas are dis-
connected without the ability to exchange informa-
tion. Therefore, it becomes difficult from the first-
responders to locate the survivors during the Search
And Rescue (SAR) operation that have to conduct
a
https://orcid.org/0000-0002-0989-4309
quickly and efficiently, and for the field teams to col-
lect information, ranging from immediate metrics on
the event itself, to more specific damage, need and
recovery information (Kerle et al., 2014).
Nowadays, Unmanned Aerial Vehicles (UAVs)
have emerged as a reliable and cost-effective solu-
tion, which aids humans in performing SAR opera-
tions, gathering early and continuous intelligence of
a disaster site and monitoring variety of tasks such
as planetary exploration, wireless related services for
ground wireless devices, and many more (Al-Kaff
et al., 2018; Akram et al., 2020; Kerle et al., 2014).
Drone-based surveying, introduces a multiplicity
of additional factors that affect both accuracy and
completion times (Kr
ˇ
s
´
ak et al., 2016). With respect to
flight planning, higher travelling speeds and higher al-
titudes reduces data collection times at the expense of
lower sensing resolution (Yusoff et al., 2017). In ad-
dition, most positioning devices onboard drone plat-
forms, are generally not able to provide location in-
Silvestrou, A., Georgiou, A., Kolios, P. and Panayiotou, C.
Multi-parametric Performance Evaluation of Drone-based Surveying for Disaster Risk Management.
DOI: 10.5220/0011038300003185
In Proceedings of the 8th International Conference on Geographical Information Systems Theory, Applications and Management (GISTAM 2022), pages 123-129
ISBN: 978-989-758-571-5; ISSN: 2184-500X
Copyright
c
2022 by SCITEPRESS – Science and Technology Publications, Lda. All rights reserved
123

formation with accuracy more than ±5m. Real Time
Kinematic (RTK) and Direct Real Time Kinematic
(DRTK) technology could be deployed at the expense,
however, of shorter fly times and travel distances (due
mainly to the increasing weight and limited available
transmit power). Nevertheless, drone-based survey-
ing stems as a highly favorable approach for on-time
surveying especially in disaster risk management op-
erations as exemplified above. Many methods and
sensors have been considered to date (P
´
ołka et al.,
2018) and drone-based approaches have unlocked ca-
pabilities that could not be possible before; especially
in hard to reach areas (Giordan et al., 2017; Ruzgien
˙
e
et al., 2015).
UAV platforms, can offer sensing measurements
at the low capital and operating cost. Among their
benefits are: a) high portability, b) high ground reso-
lution (Nex and Remondino, 2014), c) their ability to
deploy easily, d) the ease of capturing images/ videos,
e) the ability of drones to fly at arbitrary altitudes
(P
´
ołka et al., 2018; Giordan et al., 2017) enables col-
lection of data (images/ videos) of variable accuracy
depending on the mission. Importantly, drone plat-
forms are easily programmed to address varying re-
quirements, and thus, easily adapt to the user needs
(Yeong et al., 2015). Moreover, the high spatial and
temporal resolution of onboard sensors and the ability
to carry multiple such sensors like 3D sensors or near
infrared sensors (Doulamis et al., 2017), enable sig-
nificant uptake of this technology (Rao et al., 2016).
According the EU funded project INACHUS con-
clusions (INACHUS Project, 2019), first responders
given the strong time pressure on their work, require
some flexible solutions that is able to deliver timely
data and with frequent update possibility. In addi-
tion, they need data that are easy to produce and quick
to interpret also by non-remote sensing experts. All
these, regard to low-cost and easily deployable and
replicable solutions (Nex et al., 2019).
The aim of this work, is to investigate how flight
planning parameters and image processing procedure
can affect the total flight mission time of an a UAV
participation in disaster management by providing sit-
uational awareness in less time. More specific, the
following points were investigated:
1. Software tools performance using selected pho-
togrammetric parameters.
2. How the model quality and processing time can
be affected by flights on different altitudes.
3. How the division of the study area into sectors can
affect the processing time.
The rest of the paper is organized as follows; Section
2 details the proposed methodology approach while
Section 3 discuss the results obtained. Finally, con-
cluding remarks us drawn and future research direc-
tion are highlighted in Section 4.
2 PROPOSED METHODOLOGY
A survey project, has to lead to the decision of how
the 2 main steps such as flight planning and image
processing, will be conducted. The needs and con-
strains of each survey mission rely on the considered
parameter values from which any inaccuracy could re-
sult massive volume of collected data, increased pro-
cessing time and geographical model estimation er-
rors. A survey, can be considered holistically by pro-
cessing the collected dataset in its unison to ensure
quality. Moreover, when time is of essence then the
various steps of the photogrammetry procedure can
be designed and executed in a parallel fashion (Vacca
et al., 2017; Xing et al., 2010). Under this perspec-
tive, the present methodological framework involves
a coherence of several stages, aiming to investigate
the latter fact and jointly consider flight planning pa-
rameters, along with the image processing procedure,
in order to expedite the creation of the geographic
model. More specific, this work investigates how the
following cases/parameters can affect the total mis-
sion time and model quality:
1. Calculation of different photogrammetric method
parameters using different software packages.
2. Flight altitude.
3. Area sectorization.
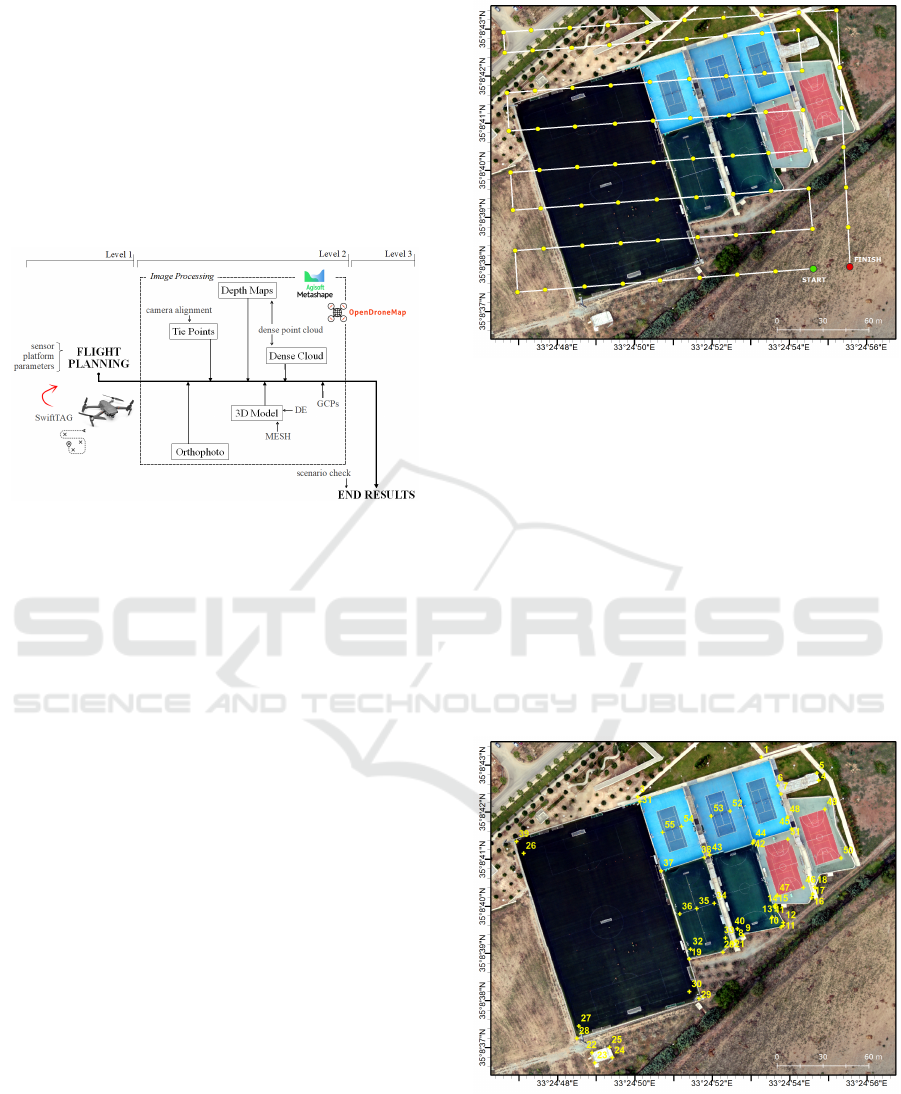
Figure 1, provides a schematic diagram of the pro-
posed methodology architecture with the performed
operational functions. Level 1, refers to flight plan-
ning where several parameters has to be taken into
consideration such as selection of the appropriate sen-
sor and platform. In addition, some parameters have
to be defined regarding image overlapping percent-
age, flight altitude, area boundaries, etc. Level 2,
refers to the image processing parameters that in-
vestigated and the photogrammetric products that de-
rived, which includes: (i) Camera alignment result-
ing the tie points, (ii) Dense point cloud generation
resulting the depth maps and dense cloud, (iii) 3D
Model resulted through mesh and digital elevation
model (DEM) products, and (iv) Orthophoto produc-
tion to eliminate the effect of image perspective and
correction of relief shifts caused by terrain condi-
tions. In this level, the performance and sensitiv-
ity of both commercial and non-commercial solutions
were also investigated. Precisely, the commercial
Agisoft Metashape software and the non-commercial
GISTAM 2022 - 8th International Conference on Geographical Information Systems Theory, Applications and Management
124
photogrammetric package of OpenDroneMap (ODM)
were used, that have the ability to establish relative
camera positions and use these positions to create ac-
curate three-dimensional models of the ground sur-
face. The models are textured by draping the aerial
photographs over them to produce photo-realistic
three-dimensional rendered outputs of the ground sur-
face (Quartermaine et al., 2013). Finally, on Level 3,
the results were extracted and grouped according the
investigated cases.
Figure 1: Proposed methodology architecture.
2.1 Implementation Aspects
In order to investigate all cases, 12 flights were con-
ducted using the same UAV and camera parameters
for all the flights. DJI Mavic 2 Enterprise was em-
ployed with an onboard sensor of 1/2.3” CMOS (com-
plementary metal oxide semiconductor) and effective
pixels 12M along with a lens of 82.6° field of view at
35mm and an aperture of f/2.8. Both the forward (p%)
and the lateral (q%) overlap were fluctuated between
75-80%. The image location is planned to guarantee
the results quality with almost the minimum overlap
in each point of the surveyed area. Both position and
acquisition order are optimized to minimize the num-
ber of acquired images and therefore, their acquisition
time. The flight strip orientation is set parallel to the
longer side of the surveyed area, as the image collec-
tion along the same strip is faster than across adja-
cent strips, minimizing the same time the number of
of strips (Nex et al., 2019). The survey area was 220
m long and 170 m wide covering an area of 0.04 km
2
(Figure 2). Flight planning was completed using the
SwiftTAG software that developed from KIOS CoE of
the University of Cyprus and the UAV flight was au-
tonomous allowing the automated generation of way-
points on the surveyed area. SwiftTAG software has
been chosen, as an open-source solution which has the
ability to be customized according the flight needs.
The PC used for the analysis, has 6GB of RAM, an i5-
7500 CPU core and an internal hard drive for 20TB.
A certain amount of points (field courts, poles
Figure 2: Flight plan of the surveyed area. The dots indicate
the waypoints of the strips.
and building corners) clearly identified in the images
where selected and measured by the method of RTK
GPS survey and used as ground control points (GCPs)
for georeferencing the data. Consequently, 55 targets
were placed evenly throughout the entire area before
the flight. The coordinates of the targets were deter-
mined using the Stonex S900 GNSS receiver. Ac-
cording to the manufacturer, the RTK performance of
this receiver is 8 mm + 1 ppm RMS × the distance
to next reference station horizontally and 15 mm + 1
ppm RMS × the distance to next reference station ver-
tically. Figure 3, shows the location of the GCPs as
distributed on study area.
Figure 3: Spatial allocation of GCPs.
For each flight, specific settings and characteris-
tics have been chosen comparing them in as simi-
lar conditions as possible, including weather condi-
tions (under sunny, cloudless and breezeless weather
conditions) and same flight speed (3 m/s). Flights
Multi-parametric Performance Evaluation of Drone-based Surveying for Disaster Risk Management
125
A-B refer to different area with the same altitude,
where the datasets have been processed using both
Agisoft Metashape from Agisoft LLC and ODM as
photogrammetric packages. The total processing time
and the sensitivity of each package was the primary
performance indicator. Flights C-E were designed
to investigate the impact of altitude on the process-
ing time. The collected datasets from the respective
flights captured images at 60 m, 90 m and 120 m
height in the same area. Finally, flights F-L have
been conducted to investigate the total processing
time when a particular area of interest (AOI) is split
into sectors. Specifically, flight F captured the full
AOI, while flights G and H split the AOI into two
equal sectors and flights I-L split the AOI into 4 equal
sectors.
Table 1, summarizes all information about the col-
lected 1.467 images (no oblique images were col-
lected) along with their associated parameters.
Table 1: Collected data information.
Parameter
Flight Image No p% q% Alt/ (m) Resolution
Value
A 54 75 75 80 4Kx2K
B 49 80 80 120 4Kx2K
C 143 85 85 60 4Kx2K
D 73 85 85 90 4Kx2K
E 49 85 85 120 4Kx2K
F 326 85 85 40 4Kx2K
G 186 85 85 40 4Kx2K
H 182 85 85 40 4Kx2K
I 122 85 85 40 4Kx2K
J 94 85 85 40 4Kx2K
K 109 85 85 40 4Kx2K
L 110 85 85 40 4Kx2K
3 EXPERIMENTAL RESULTS
3.1 Photogrammetric Parameters
Average time processing values have been ex-
tracted performing several repetitions on the col-
lected dataset, using the same processing unit. Ta-
ble 2, summarizes the results on each photogrammet-
ric stage calculation, using both commercial and non-
commercial software tools for 2 distinct datasets. As
indicated in the table, ODM did not manage to com-
plete all stages of the photogrammetric product in or-
der to produce the orthophoto and this is the main rea-
son for the significantly reduced execution time.
It has to be noted, that Agisoft Metashape offers
6 accuracy levels, from which the 3rd (medium ac-
curacy) has been selected to account for the results
produced by ODM. The batch processing option on
the Agisoft Metashape environment, provided an au-
tomated processing operation, minimizing the user in-
teraction.
Table 2: Processing time Vs Software package.
Time (s)
Task Metashape ODM
Dataset A
Align 94,25 X
Dense Cloud 429,75 X
Mesh 3.333,00 Not Produced
Texture 145,75 Not Produced
Tiled Model 690,25 X
DEM 7,00 Not Produced
Orthophoto 150,75 X
Total Time 4.850,75 1.020,00
Dataset B
Align 102,33 X
Dense Cloud 2.160,67 X
Mesh 4.591,00 Not Produced
Texture 173,00 Not Produced
Tiled Model 356,67 X
DEM 3,00 Not Produced
Orthophoto 87,00 X
Total Time 7.467,45 1.620,00
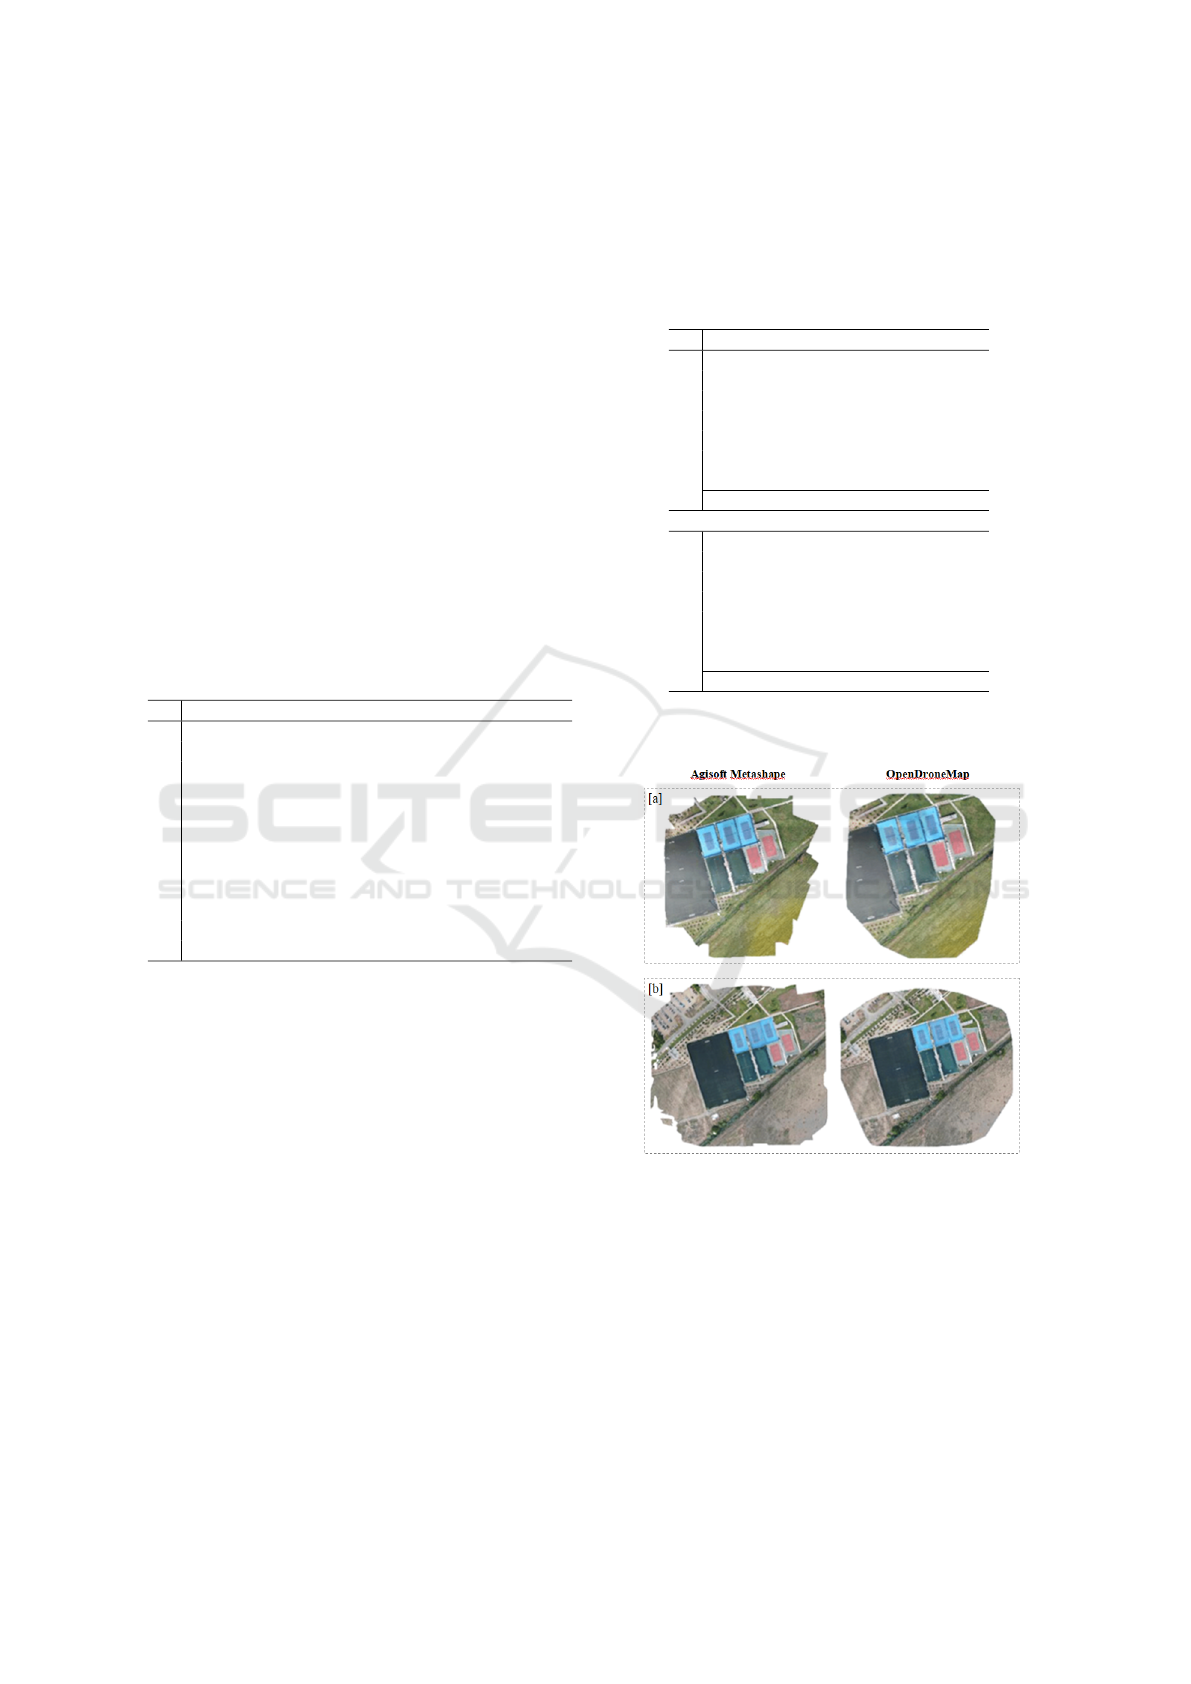
Figure 4, presents the resulted 4 orthophotos using
both software packages for the 2-dataset collection.
Figure 4: Orthophotos as created for both dataset packages
[a] and [b].
The details of RMS errors for the GCPs and the
resulted orthophotos for the 2-dataset collection, us-
ing both Agisodt Metashape and ODM software pack-
ages, are in Table 3.
3.2 Altitude Impact
In order to investigate the impact of altitude on the
processing time, 3 flights were performed at 60 m,
GISTAM 2022 - 8th International Conference on Geographical Information Systems Theory, Applications and Management
126
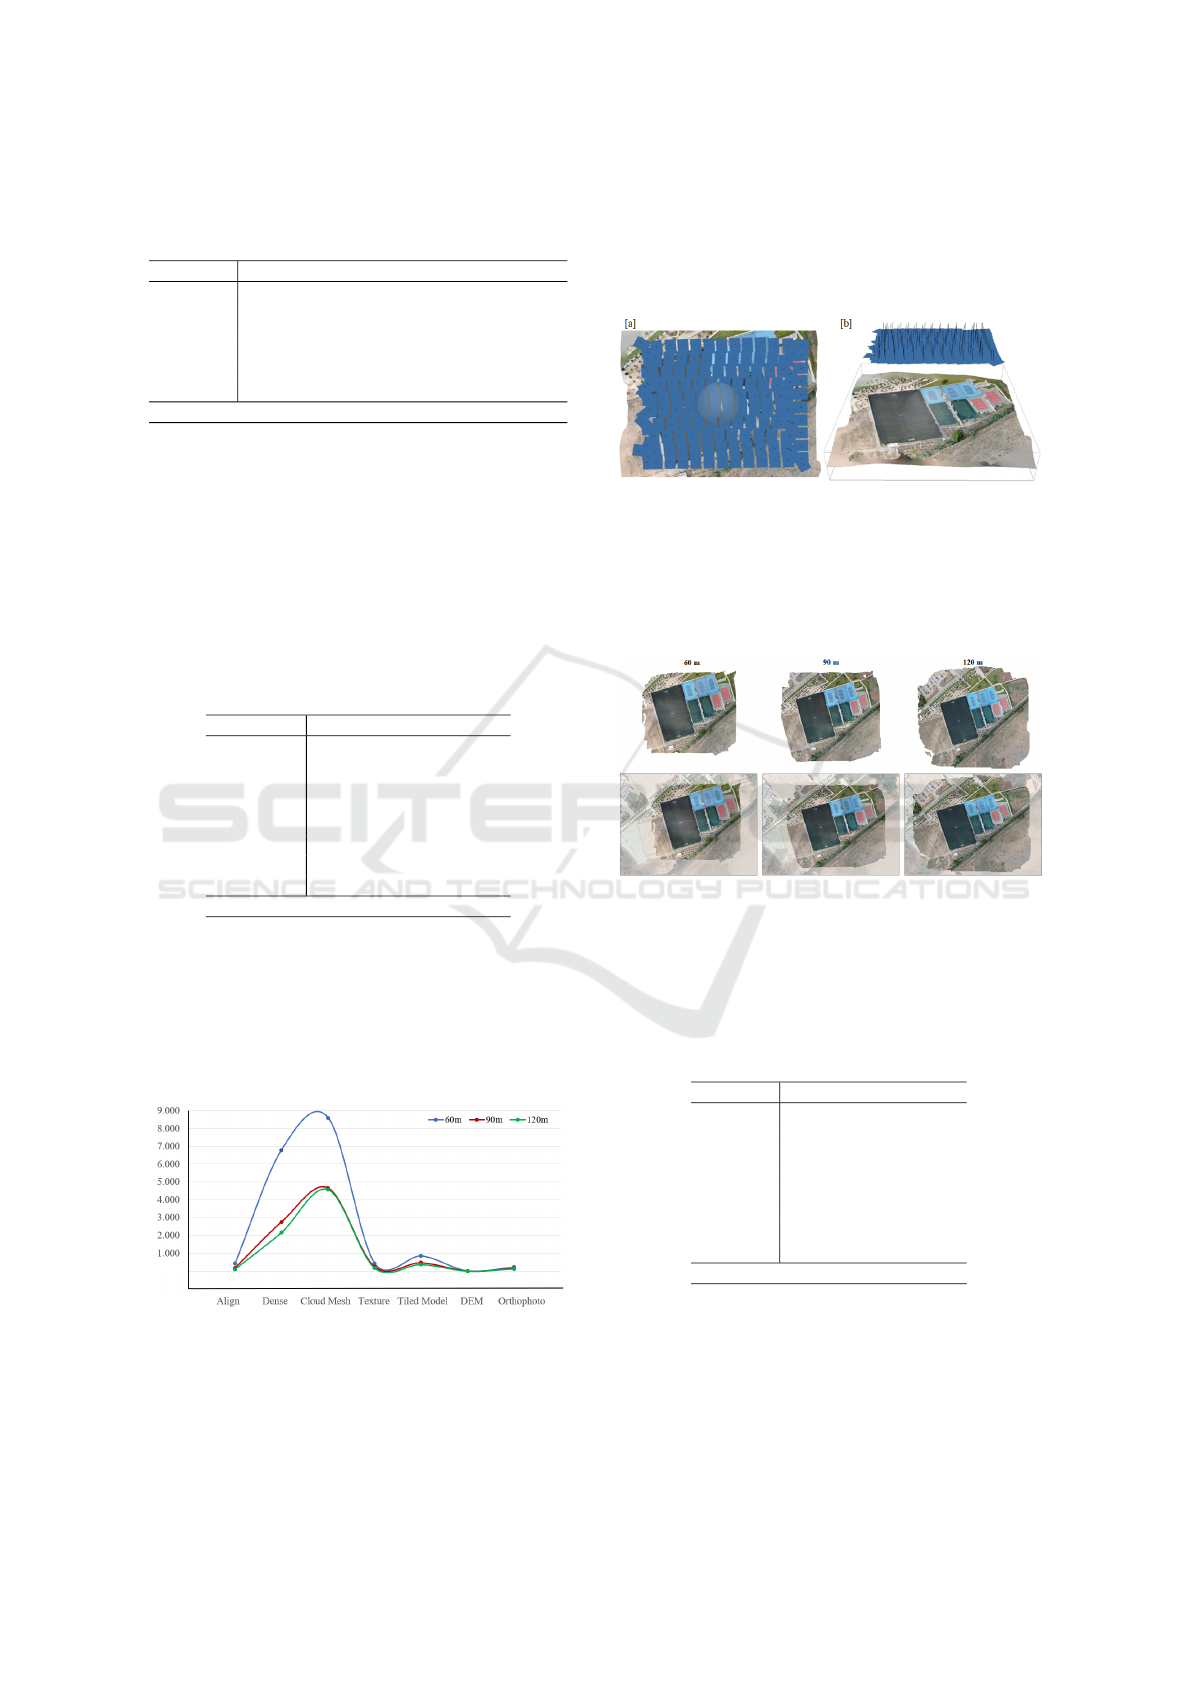
Table 3: Measured errors between generated orthophotos
and GCPs.
Residual
GCP Agisoft [a] ODM [a] Agisoft [b] ODM [b]
29 0,1043 0,1899 0,7338 0,1242
30 0,1599 0,1913 1,5234 0,3148
31 0,1215 0,1350 0,7276 0,2373
36 0,2722 0,0468 0,6699 0,0628
47 0,0518 0,1615 0,4124 0,0509
49 0,0829 0,4352 1,7566 0,0661
RMSE (m) 0,1499 0,2268 1,0873 0,1740
90 m and 120 m respectively. The UAV imagery
have been processed using AgiSoft Metashape soft-
ware package.
Table 4, summarizes the results on time process-
ing for the production of each photogrammetric prod-
uct for height-missions C to E. As is shown, altitude
change, has a significant impact on the processing
time, reducing from 17.325 s on a 60 m altitude to-
wards to 7.521 s on a 120 m altitude.
Table 4: Processing time Vs Flying altitudes.
Time (s)
Task 60 m 90 m 120 m
Align 434,8 180,6 105,2
Dense Cloud 6.796,4 2.753,8 2.172,8
Mesh 8.593,2 4.647,2 4.570,0
Texture 435,6 239,4 174,0
Tiled Model 845,8 462,1 366,2
DEM 6,2 3,6 3,2
Orthophoto 212,8 150,2 129,8
Total Images 143 73 49
Total Time 17.324,8 8.433,9 7.521,2
Figure 5, presents the processing time for each ex-
amined parameter per altitude level. It is obvious that
in high altitudes, where there are less images cover-
ing the AOI, the processing time reduces significantly.
Dense and cloud mesh, stand out as the parameters
with the major reduction on processing time when in-
creasing the image capture altitude.
Figure 5: Processing time (sec) per altitude for each exam-
ined parameter.
Figure 6, presents a sample of the UAV imagery
processing in Agisoft Metashape software environ-
ment, at 60 m flight altitude. The blue rectangles
represent the collected images as distributed over the
AOI, where the black axes refer to the platform posi-
tion on capturing time as it is calculated with a ±5m
GPS accuracy. In addition, a 3D model has been ex-
tracted of the AOI.
Figure 6: Image processing, where: (a) Distribution of im-
ages collected to cover the AOI, and (b) 3D model extrac-
tion of the AOI.
Figure 7, presents the resulted orthophotos per
examined altitude flight and as fitted on the respect
scene from Google satellite.
Figure 7: Resulted orthophotos for each altitude flight com-
pared to the respect scene of Google satellite basemap.
Table 5, summarizes the total error values on
GCPs for the resulted orthophotos per altitude.
Table 5: Measured errors between generated orthophotos
per altitude and GCPs.
Residual
GCP 60 m 90 m 120 m
25 0,1584 0,3692 0,3690
26 0,0487 0,1606 0,4107
27 0,3064 0,1664 0,0839
30 0,1309 0,2409 0,1559
31 0,2011 0,1958 0,1453
36 0,1389 0,3060 0,3573
47 0,1988 0,2140 0,2961
49 0,1173 0,2759 0,1466
RMSE (m) 0,1773 0,2504 0,2725
3.3 AOI Coverage
The processing time of a selected AOI, proved to be
significant depended with the respect covered area.
Table 6, summarizes the processing time when area
Multi-parametric Performance Evaluation of Drone-based Surveying for Disaster Risk Management
127
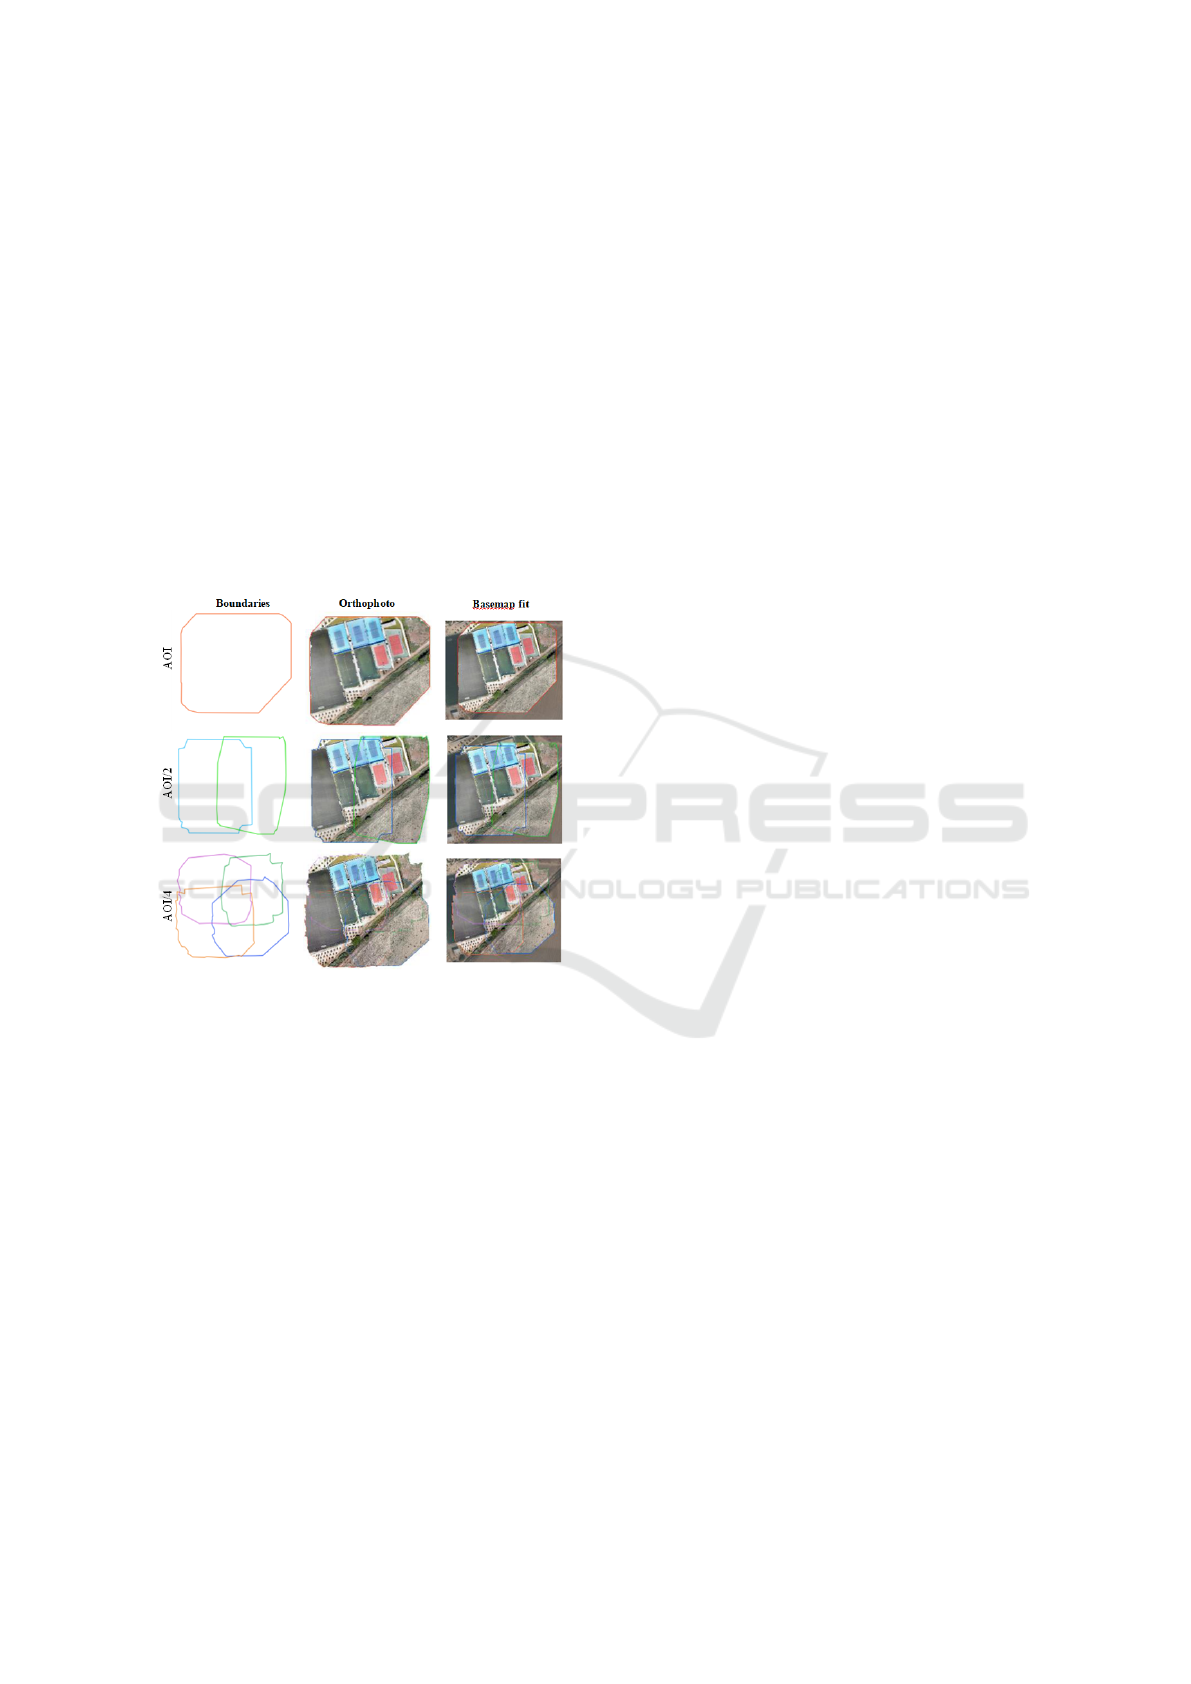
sectorization is applied in each overlap-mission. As
it is shown, when the dataset covered the whole AOI,
the total completion time was less than the total sum
time of the subdivided areas 2a and 2b respectively.
The same trend, is also observed on the next datasets
where the AOI is divided into 4 sectors. The sum
value of the total completion time of the last four
datasets (4a-4d), has been approximately the same
with the sum value of datasets 2a and 2b respectively.
In the same way, this sum value is also close enough
to total completion time of the dataset refereed to the
whole AOI (a). Importantly though, smaller sectors
enable parallelization in the execution and thus sig-
nificantly slash processing time.
In Figure 8, the resulted orthophotos are illus-
trated, as derived from AOI sectorization, with the re-
spect fitted scene from Google Satellite.
Figure 8: Resulted orthophotos for each flight with different
AOI boundaries, compared to the respect scene of Google
satellite basemap.
4 CONCLUSIONS
The proper combination of both hardware and soft-
ware solutions is necessary to design and implement
an accurate geographical survey. These components,
are vital in the production of appropriate results in
the terms of output quality and processing time, espe-
cially for disaster risk management. This paper, pro-
vides a very brief overview on how the total mission
time and model quality can be affected during the pro-
cessing of specific photogrammetric parameters. The
investigated cases based on empirical findings from
an extensive surveying campaign totaling 12 flights
using various parameter settings (including altitude
and coverage areas). In addition, a comparison of
state-of-the-art commercial and non-commercial pho-
togrammetric software was conducted to demonstrate
the possible benefits in completion time from the use
of different data processing algorithms.
The major findings of this work, can be summa-
rized in some key points. First, the height of the
flight plays significant role on time measurements and
achieved accuracy. It is associated with the resulted
orthophoto and the value of height should be calcu-
lated along with the focal length of the camera to
meet the needed requirements. However, when there
is a margin, a higher altitude could be considered for
less flight mission and less processing time. Another
key point is that the side and forward overlap of im-
ages is essential to acquire a higher accuracy which
increases the time has to be spend for acquiring im-
ages and processing them in the software. However,
smaller sectors enable parallel processing that signif-
icantly slash processing time. Finally, regarding the
analysis software package, AgiSoft Metashape com-
mercial software proved to be a reliable solution for
data processing.
4.1 Future Recommendation
Given the importance of model accuracy when de-
signing time-sensitive surveys, the following aspects
should be taken into consideration for future work.
Use and test additional photogrammetric software
in order to understand the limitations and capabilities
of various algorithms employed. More commercial
and non-commercial packages could be evaluated for
their performance and their end results quality, in or-
der to identify the best combination on processing
time and model accuracy. Moreover, a further re-
search is needed on how the quality of the orthophotos
can be regulated to further improve the overall pro-
cessing time. In addition, several parameters affect-
ing the flight should be taken into consideration that
might affect the survey overall measurements time
and the output quality and accuracy. The drone size
(mainly for its’ vulnerability to weather conditions
such as wind) and drone speed while taking photos
should be investigated as well along with the influ-
ence of weather conditions and solar positioning dur-
ing the UAV survey.
Another aspect that should take into considera-
tion, is the use of Artificial Intelligence (AI) tech-
niques to: (1) automate processes that require heavy
manual operation; (2) improve performance of pro-
cesses in terms of efficiency and robustness (Qin and
Gruen, 2021).
GISTAM 2022 - 8th International Conference on Geographical Information Systems Theory, Applications and Management
128
Table 6: Processing time Vs Sectorized AOI.
Time (s)
Task
AOI AOI/2 AOI/2 AOI/4 AOI/4 AOI/4 AOI/4
(a) (2a) (2b) (4a) (4b) (4c) (4d)
Align 972,5 411,5 463,7 222,5 196,7 223,5 231,2
Dense Cloud 11.274,7 6.046,2 6.427,7 3.084,2 2.413,2 3.469,0 4.698,5
Mesh 17.100,0 10.809,2 10.185,0 4.682,7 3.416,7 4.740,5 5.887,2
Texture 710,0 414,7 405,5 275,0 21,0 255,2 256,5
Tiled Model 1.293,5 789,0 762,7 590,5 487,7 531,2 448,5
DEM 13,7 7,2 6,2 6,0 4,7 4,2 4,2
Orthophoto 649,7 434,5 429,7 168,0 141,0 182,2 212,5
Total Time 30.014,25 18.912,5 18.680,7 9.029,7 6.875,2 9.406,0 11.738,7
,→ ←- ,→ ←-
37.593,2 37.049,6
ACKNOWLEDGEMENTS
The work of authors, has been partially supported by
the European Union’s Horizon 2020 research and in-
novation program under grant agreement No 739551
(KIOS CoE) and by the Republic of Cyprus through
the Deputy Ministry of Research, Innovation and Dig-
ital Policy.
REFERENCES
Akram, T., Awais, M., Naqvi, R., Ahmed, A., and Naeem,
M. (2020). Multicriteria uav base stations place-
ment for disaster management. IEEE Systems Journal,
14(3):3475–3482.
Al-Kaff, A., Mart
´
ın, D., Garc
´
ıa, F., de la Escalera, A., and
Mar
´
ıa Armingol, J. (2018). Survey of computer vision
algorithms and applications for unmanned aerial vehi-
cles. Expert Systems with Applications, 92:447–463.
Doulamis, N., Agrafiotis, P., Athanasiou, G., and Amditis,
A. (2017). Human object detection using very low res-
olution thermal cameras for urban search and rescue.
In Proceedings of the 10th International Conference
on PErvasive Technologies Related to Assistive Envi-
ronments, PETRA ’17, page 311–318, New York, NY,
USA. Association for Computing Machinery.
Giordan, D., Manconi, A., Remondino, F., and Nex, F.
(2017). Use of unmanned aerial vehicles in monitor-
ing application and management of natural hazards.
INACHUS Project (2019). Available online: www.inachus.
eu (accessed on 17 february 2022).
Kerle, N., Fernandez Galarreta, J., and Gerke, M. (2014).
Urban structural damage assessment with oblique uav
imagery, object-based image analysis and semantic
reasoning. In Proc., 35th Asian conference on remote
sensing.
Kr
ˇ
s
´
ak, B., Bli
ˇ
st’an, P., Paulikov
´
a, A., Pu
ˇ
sk
´
arov
´
a, P., Ko-
vani
ˇ
c, L., Palkov
´
a, J., and Zeliz
ˇ
nakov
´
a, V. (2016). Use
of low-cost uav photogrammetry to analyze the accu-
racy of a digital elevation model in a case study. Mea-
surement, 91:276–287.
Nex, F., Duarte, D., Steenbeek, A., and Kerle, N. (2019).
Towards real-time building damage mapping with
low-cost uav solutions. Remote Sensing, 11(3).
Nex, F. and Remondino, F. (2014). Uav for 3d mapping
applications: a review. Applied geomatics, 6(1):1–15.
Panda, K. G., Das, S., Sen, D., and Arif, W. (2019). Design
and deployment of uav-aided post-disaster emergency
network. IEEE Access, 7:102985–102999.
P
´
ołka, M., Ptak, S., Kuziora, Ł., and Kuczy
´
nska, A. (2018).
The use of unmanned aerial vehicles by urban search
and rescue groups. Drones-Applications. London: In-
techOpen, pages 83–96.
Qin, R. and Gruen, A. (2021). The role of machine intelli-
gence in photogrammetric 3d modeling–an overview
and perspectives. International Journal of Digital
Earth, 14(1):15–31.
Quartermaine, J., Olson, B. R., and Howland, M. (2013).
Appendix b: Using photogrammetry and geographic
information systems (gis) to draft accurate plans of
qazion. Journal of Eastern Mediterranean Archaeol-
ogy and Heritage Studies, 1(2):169–174.
Rao, B., Gopi, A. G., and Maione, R. (2016). The societal
impact of commercial drones. Technology in society,
45:83–90.
Ruzgien
˙
e, B., Berte
ˇ
ska, T., Ge
ˇ
cyte, S., Jakubauskien
˙
e, E.,
and Aksamitauskas, V.
ˇ
C. (2015). The surface mod-
elling based on uav photogrammetry and qualitative
estimation. Measurement, 73:619–627.
Vacca, G., Dess
`
ı, A., and Sacco, A. (2017). The
use of nadir and oblique uav images for building
knowledge. ISPRS International Journal of Geo-
Information, 6(12):393.
Xing, C., Wang, J., and Xu, Y. (2010). Overlap analysis of
the images from unmanned aerial vehicles. In 2010 In-
ternational Conference on Electrical and Control En-
gineering, pages 1459–1462. IEEE.
Yeong, S., King, L., and Dol, S. (2015). A review on marine
search and rescue operations using unmanned aerial
vehicles. International Journal of Marine and Envi-
ronmental Sciences, 9(2):396–399.
Yusoff, A. R., Ariff, M. M., Idris, K. M., Majid, Z., and
Chong, A. K. (2017). Camera calibration accuracy
at different uav flying heights. The international
archives of photogrammetry, remote sensing and spa-
tial information sciences, 42:595.
Multi-parametric Performance Evaluation of Drone-based Surveying for Disaster Risk Management
129
