
Is There an Optimal Sprint Length on Agile Software Development
Projects?
Nicolas Nascimento
a
, Alan Santos
b
, Afonso Sales
c
and Rafael Chanin
d
Polytechnical School, Pontifical Catholic University of Rio Grande do Sul, Avenida Ipiranga 6681, Porto Alegre, Brazil
Keywords:
Software Engineering, Agile, Sprint Length.
Abstract:
Agile software development is adopted by the industry as a way to develop applications while also remaining
flexible to quickly respond and adapt. At its core, agile relies heavily upon time-constrained iterations, usually
named “sprints”, which should provide the development team to deliver a functional version of a software
product. This study aims at understanding what is the impact of different sprint lengths in agile software
teams. In order to achieve it, we have conducted a field study at a mobile software development course for
eight months. The course was organized on three stages, where at each stage ten projects were simultaneously
conducted. Data collection was based on project outcome including daily logs and deliverables generated by
the teams. Each stage had a different sprint length (1-week, 2-week, or 3-week iterations). Our results indi-
cate that there are differences in some aspects, including project evaluation and weekly impediments. These
differences were statistically analyzed regarding the impacts of different sprint lengths in agile teams. Fur-
ther, we have also observed some correlation between weekly impediments and project evaluation, providing
indications of a possible impact on overall projects outcome.
1 INTRODUCTION
The growing demand for faster time to market cy-
cles has shaped the way software products are man-
aged, developed and delivered to users over the years.
There is demand on the software industry for shorter
software development cycles (Bourque and Fairley,
2018). In this context, traditional project management
approaches, including waterfall, have been replaced
by agile methodologies, e.g., Scrum, Extreme Pro-
gramming, Kanban, among others (Hasnain, 2010).
Agile methodologies tend to reduce time to market
cycles because they are based upon lean principles
which foster agility and waste reduction (Tore and
Torgeir, 2008; Santos et al., 2013).
At its core, agile relies heavily upon time-
constrained iterations, usually named Sprints, which
should provide the development team to deliver a
functional version of a software product. The Scrum
guide (Schwaber and Sutherland, 2011), for example,
states that Sprints are its heartbeat, where “ideas are
a
https://orcid.org/0000-0002-0080-8822
b
https://orcid.org/0000-0001-8323-3472
c
https://orcid.org/0000-0001-6962-3706
d
https://orcid.org/0000-0002-6293-7419
turned into value”. Furthermore, the guide provides a
directive that sprints can vary in length, never exceed-
ing one month. As a result, the consequences of dif-
ferent sprint durations are still an open research topic
as very few research studies target this.
The contribution of this paper is an empirical field
study that evaluates the use of different sprint lengths
at an agile software development environment, eval-
uating the impacts and influences of different sprint
lengths structure on software development issues, im-
pediments and deliverables.
This paper is organized as follows: in Section 2
we explore important concepts and the background
for this research. Section 3 depicts the methodology
used in this study. In Section 4 we explore our re-
sults, followed by Section 5, in which we take away
the most important insights. Section 6 presents the
limitations of this study. Finally, Section 7 concludes
the paper and indicates next steps and future works.
2 BACKGROUND
In modern software development, change is a con-
stant and it is often caused by external and uncon-
trollable factors (Barry et al., 2002). As markets and
98
Nascimento, N., Santos, A., Sales, A. and Chanin, R.
Is There an Optimal Sprint Length on Agile Software Development Projects?.
DOI: 10.5220/0011037700003179
In Proceedings of the 24th International Conference on Enter prise Information Systems (ICEIS 2022) - Volume 2, pages 98-105
ISBN: 978-989-758-569-2; ISSN: 2184-4992
Copyright
c
2022 by SCITEPRESS – Science and Technology Publications, Lda. All rights reserved

economies quickly and unpredictably change, tradi-
tional software development practices, tool and tech-
niques become difficult to apply and to follow ap-
propriately. In addition, these changes impact on
the software development project, which commonly
grows both in scope and cost, a phenomenon known
as Scope Creep (Barry et al., 2002). This results in
high costs for the development, maintenance and up-
date of software products, thus reducing the competi-
tiveness of software development companies.
In this context, as faster and more flexible soft-
ware development techniques became more neces-
sary, in 2001, the “Manifesto for Agile Software De-
velopment” (Beck et al., 2001) was created. As core
principles for software development, the Manifesto
proposes valuing:
• Individuals and interactions over processes and
tools;
• Working software over comprehensive documen-
tation;
• Customer collaboration over contract negotiation
and;
• Responding to change over following a plan.
Thus, Agile Methodologies, as defined by Press-
man (Pressman, 2005), are a modern approach to de-
velop software. By embracing continuous change,
emphasizing quick deployment of functional software
and relying heavily on a close collaboration with the
customer during the development lifecycle, agile is
suitable to be applied in a variety of projects, even
outside of the software development realm.
Although the Manifesto states that less value is
put in the processes used for developing software,
Agile has some commonly applied development ap-
proaches. Some of the most commonly applied are
Extreme Programming, Feature-Driven Development
and Scrum (Anand and Dinakaran, 2016).
Extreme Programming (XP), as well as other agile
methods were presented as an approach for software
development projects (Conboy and Fitzgerald, 2010).
XP is a software development approach which em-
phasizes productivity, flexibility, informality, team-
work, a limited usage of tech outside of programming
and working in short cycles, where each cycle be-
gins by choosing requirements from a backlog (Ma-
cias et al., 2003). Beck (Beck and Andres, 2004) pre-
sented XP as a lightweight methodology for small and
medium size software development teams which deal
with vague and fast-changing requirements.
There are many agile methods and, according to
recent research performed by Version One with 3,925
participants from North America and Europe (One,
2015), Scrum methods and practices are the used by
majority of the industry. Mariz et al. (de Souza Mariz
et al., 2010) presented an investigation the relation-
ship among agile practices and the success of projects
using Scrum. In this investigation, with 62 software
engineers which were associated with 11 projects in
nine different companies, results show that eight out
of 25 attributes which are associated with agile prac-
tices have a significant correlation with project suc-
cess, suggesting that it is important to consider agile
as a way to improve efficacy in projects in the soft-
ware industry.
Scrum is an agile, iterative and incremental soft-
ware development approach (Schwaber, 2004) which
is also used in complex projects, in which is impos-
sible to predict how everything will occur. Further,
Scrum offers a framework and set of practices which
keep things visible, allowing teams to know exactly
what is happening and adjust as needed to maintain
project progress. As Scrum practices are part of an
iterative and incremental process, the output of each
iteration is a product increment, and the iterations re-
peat until the project is completed or is terminated.
Each iteration in Scrum is called a sprint and lasts
from one to four weeks. There are three main arte-
facts in Scrum: Product Backlog, Sprint Backlog and
a potentially functional product increment (Schwaber,
2004). The Product Backlog is a priority-ordered re-
quirements list, usually written as user stories. The
Sprint Backlog is a sprint subset of the Product Back-
log which is organized during the planning of a sprint,
where user stories are identified and implemented ac-
cording to their priority. In Scrum, activities are esti-
mated in hours by teams (Reichlmayr, 2011), however
this approach is not the only option, as there are others
such as complexity points.
During each sprint, daily meetings are conducted.
In these meetings, each team member lets the team
know what he/she has done the previous day, what
will be done in the current day and what impediments
are blocking development. At the end of each sprint, a
product demonstration called Sprint Review held and
after this review, a meeting to discuss lessons learned
and next steps called Sprint Retrospective (Scharff
and Verma, 2010).
In agile software development, given the context
of the software industry, there are some relevant as-
pect that have to be considered, and also in software
development more broadly, such as the task of con-
stantly manage people. In this sense, e.g. People
Management (de Alc
ˆ
antara et al., 2018), an approach
which understand people involved in a team or an or-
ganization as human beings, plays a fundamental role
of effectively adding to the organization effectiveness.
Further, It is also important to note that a team’s ex-
Is There an Optimal Sprint Length on Agile Software Development Projects?
99

pertise and technical ability, specially in larger teams,
has to be aligned to incompass the design of the fi-
nal software product (Grabis et al., 2016). Finally,
agile is a methodology that requires modification to
the fundamentals of building software, and so it is
requires a transition strategy when applied to tradi-
tional software development environments (Bider and
S
¨
oderberg, 2016).
3 METHODOLOGY
The research question proposed in this study was:
“What are the effects of using different sprint
lengths on agile software development on project per-
formance, amount of impediments and amount of is-
sues?”
In this section, we depict the steps undertaken to
address the research question.
3.1 Field Study Protocol
A field study was conducted at a mobile software de-
velopment course during a period of eight months.
The goal of this field study was to empirically un-
derstand the influences and impacts of different sprint
lengths performing data analysis of sprint plannings,
daily meetings and sprints deliverables.
In a general sense, field studies do not general-
ize obtained results. Rather, they allow researchers to
illustrate a particular phenomenon in its original con-
text (Hall, 2008).
The goal of the field study conducted in this re-
search was to assess the influence of sprint length on
agile software development. The sample population
(50 students) was composed of undergraduate stu-
dents in a mobile application development program,
who were chosen using the convenience criteria due
to the fact that participants were selected for their
availability. The sample population size was defined
using the higher number of available people to partic-
ipate in this study.
3.2 Data Collection and Analysis
For our field study, we have considered two data
points:
1. Teams deliverables;
2. Daily meetings logs;
3.2.1 Team Deliverables
To evaluate the team deliverables, throughout the
stages, instructors performed an assessment of each
individual project students had worked on. This as-
sessment revolved around three main points:
1. The final presentation delivered by the each team;
2. The challenge level addressed by each team;
3. The team collaboration during the execution of
the project.
Considering these points, each instructor provided
an individual evaluation which ranged from 1 to 5,
following a Likert-type scale. This evaluation would
be equivalent to:
1. Terrible performance;
2. Poor performance;
3. Average performance;
4. Good performance;
5. Amazing performance.
Using the instructors individual assessment, to a
have single assessment per team, we have obtained
the average evaluation of all projects performed by
the students.
3.2.2 Daily Meeting Logs
As the goal of the study was the assess the impacts
and influences of sprint duration in agile projects, we
have used the daily meeting logs of each team. These
daily meeting logs were records of the daily meeting
the team were performing during the agile develop-
ment process. In this daily meeting log, each student
would answer the following questions:
1. “What did I do yesterday?”
2. “What will I do today?”
3. “What are my current impediments?”
For the purpose of our study, we decided to fo-
cus primarily in the third question, regarding imped-
iments. As such, we have split impediments in two
different types:
1. Impediments: These were impediments which
were technical and revolved around the actual im-
plementation of the project. A real example from
the logs which was classified as an impediment
was “problems with the backend debugging tool”.
2. Issues: These were impediments caused by exter-
nal factors, such as illnesses, hard weather condi-
tions or external appointments / limitations.
ICEIS 2022 - 24th International Conference on Enterprise Information Systems
100
3.3 Field Study Stages
The field study consolidated data from three stages.
Each stage collected data from 10 different teams dur-
ing the process of agile software development. Each
stage differed from the others in sprint duration and
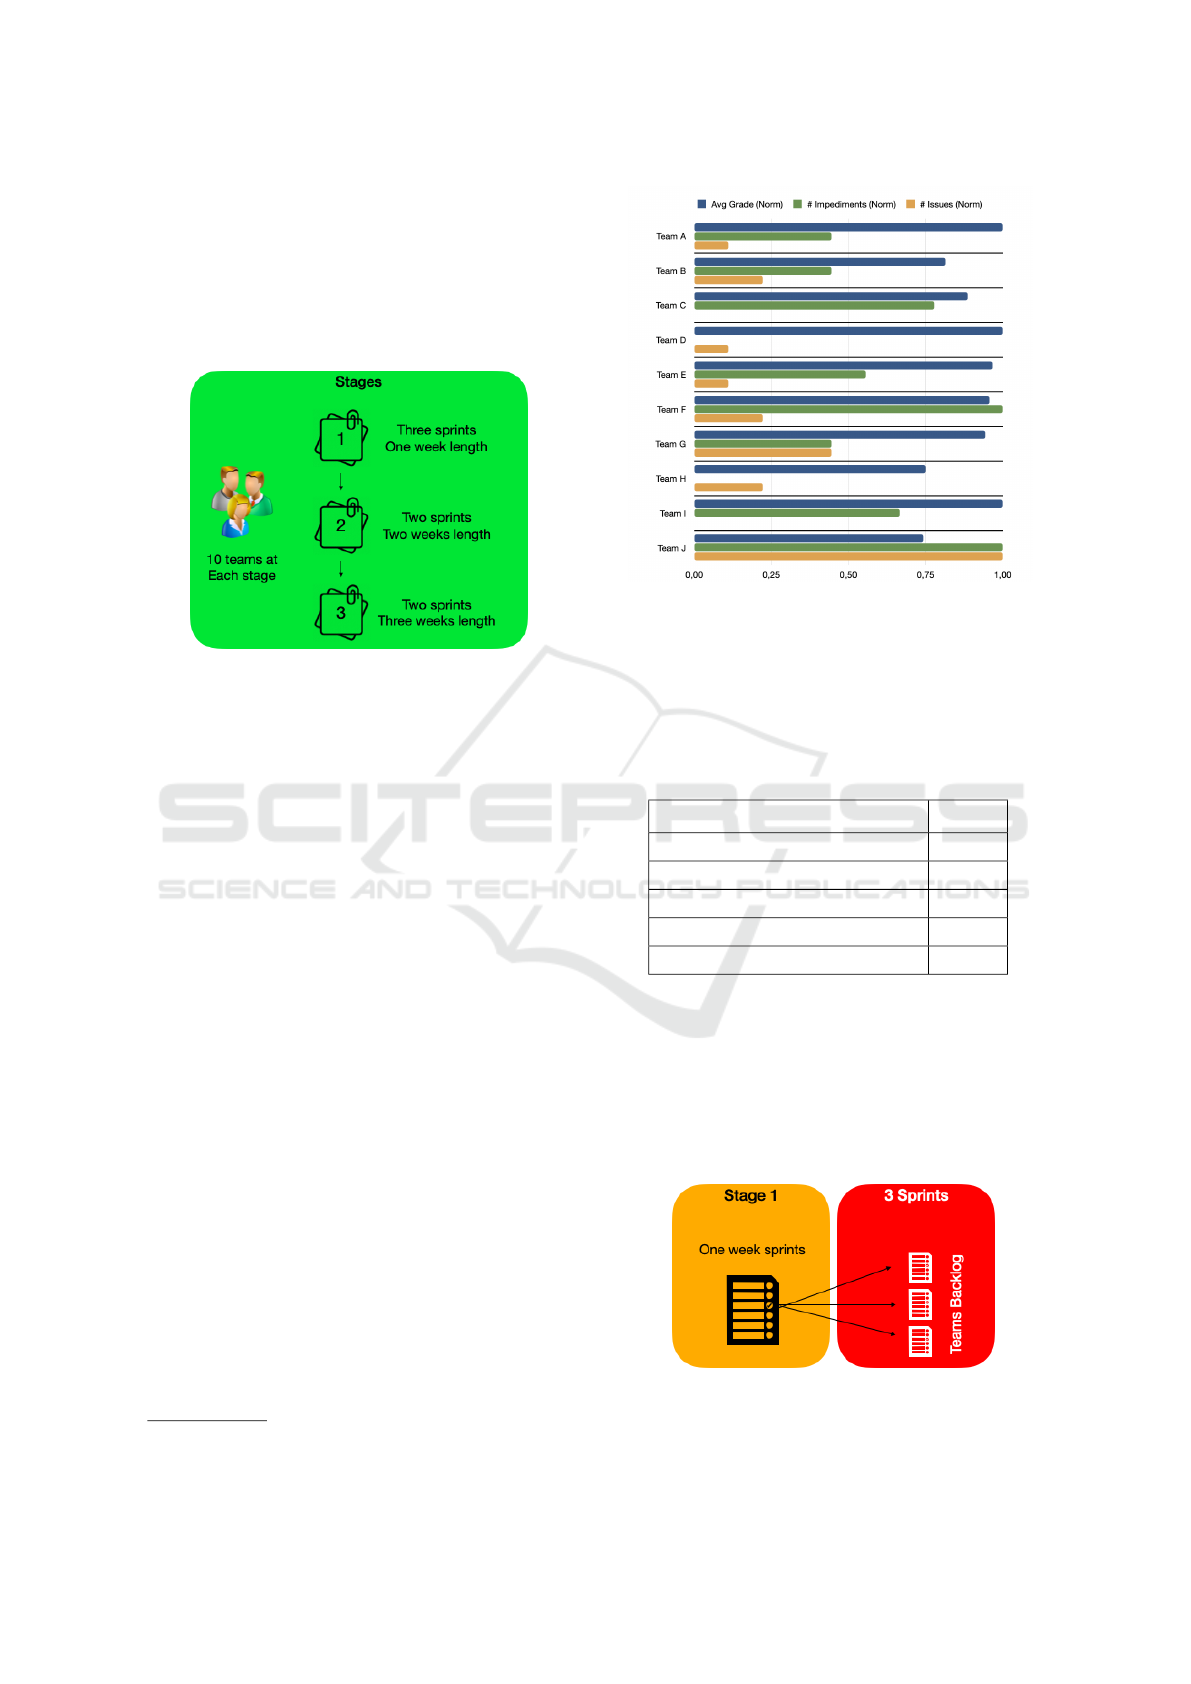
project length. Stages setup are presented at Figure 1
Figure 1: Stages setup.
In this context, Stage 1 was composed by three
sprints of one-week length; Stage 2 was composed
by two sprints of two-week length; and Stage 3 was
composed by two sprints of three-week length.
After the end of each stage, new teams composi-
tions were done for the next stage in order to avoid
team bias. Once the data collection was completed,
we have prepared and categorized all data points ob-
tained, generating the data analysis foundation. All
data was stored at Airtable database
1
.
4 RESULTS
This section depicts the field study results from Stage
1, Stage 2, and Stage 3. For each stage, we present
the average evaluation score, impediments and issues
found by 10 teams. Further, to account for the dif-
ferent durations of each project, we have also used a
“weekly” metric for the number of impediments and
issues as a normalization strategy.
4.1 Stage 1
Figure 2 presents the first stage data, running three
sprints of one week length each. On this configuration
setting, majority of teams had a score 4+ on a scale
from 1 (worst) to 5 (best). Four teams had more than
5 impediments, however from these four teams, only
one team (Team J) scored less than 4 points out of 5.
1
https://airtable.com
Figure 2: Stage 1 Results.
Some results were translated to weekly values
(impediments and issues) in order to enable further
comparison between the different stages, using dif-
ferent sprint lengths and different number of sprints.
Table 4 describes the overall Stage 1 results.
Table 1: Stage 1 Data.
Aspect Result
Avg score 4.5
Avg # of impediments 4.8
Avg # of issues 2.2
Avg # of weekly impediments 1.6
Avg # of weekly issues 0.7
During Stage 1, running three sprints of one week
each (Figure 3), we have found on average 1.6 imped-
iments per team per week and 0.7 issues per team per
week. Only 30% of Stage 1 teams had up to 4 imped-
iments total. Despite the low number of impediments
from those teams, their scores have not presented a
significant difference when compared with teams that
had higher number of impediments.
Figure 3: Stage 1 Setting.
Is There an Optimal Sprint Length on Agile Software Development Projects?
101
Running sprints of one week length, we have
found that Team H had the lowest score and have
not reported any impediments. Furthermore, it had
a small number of issues as well. This could indicate
that team H had difficulty to perceive impediments
and issues in the sprints.
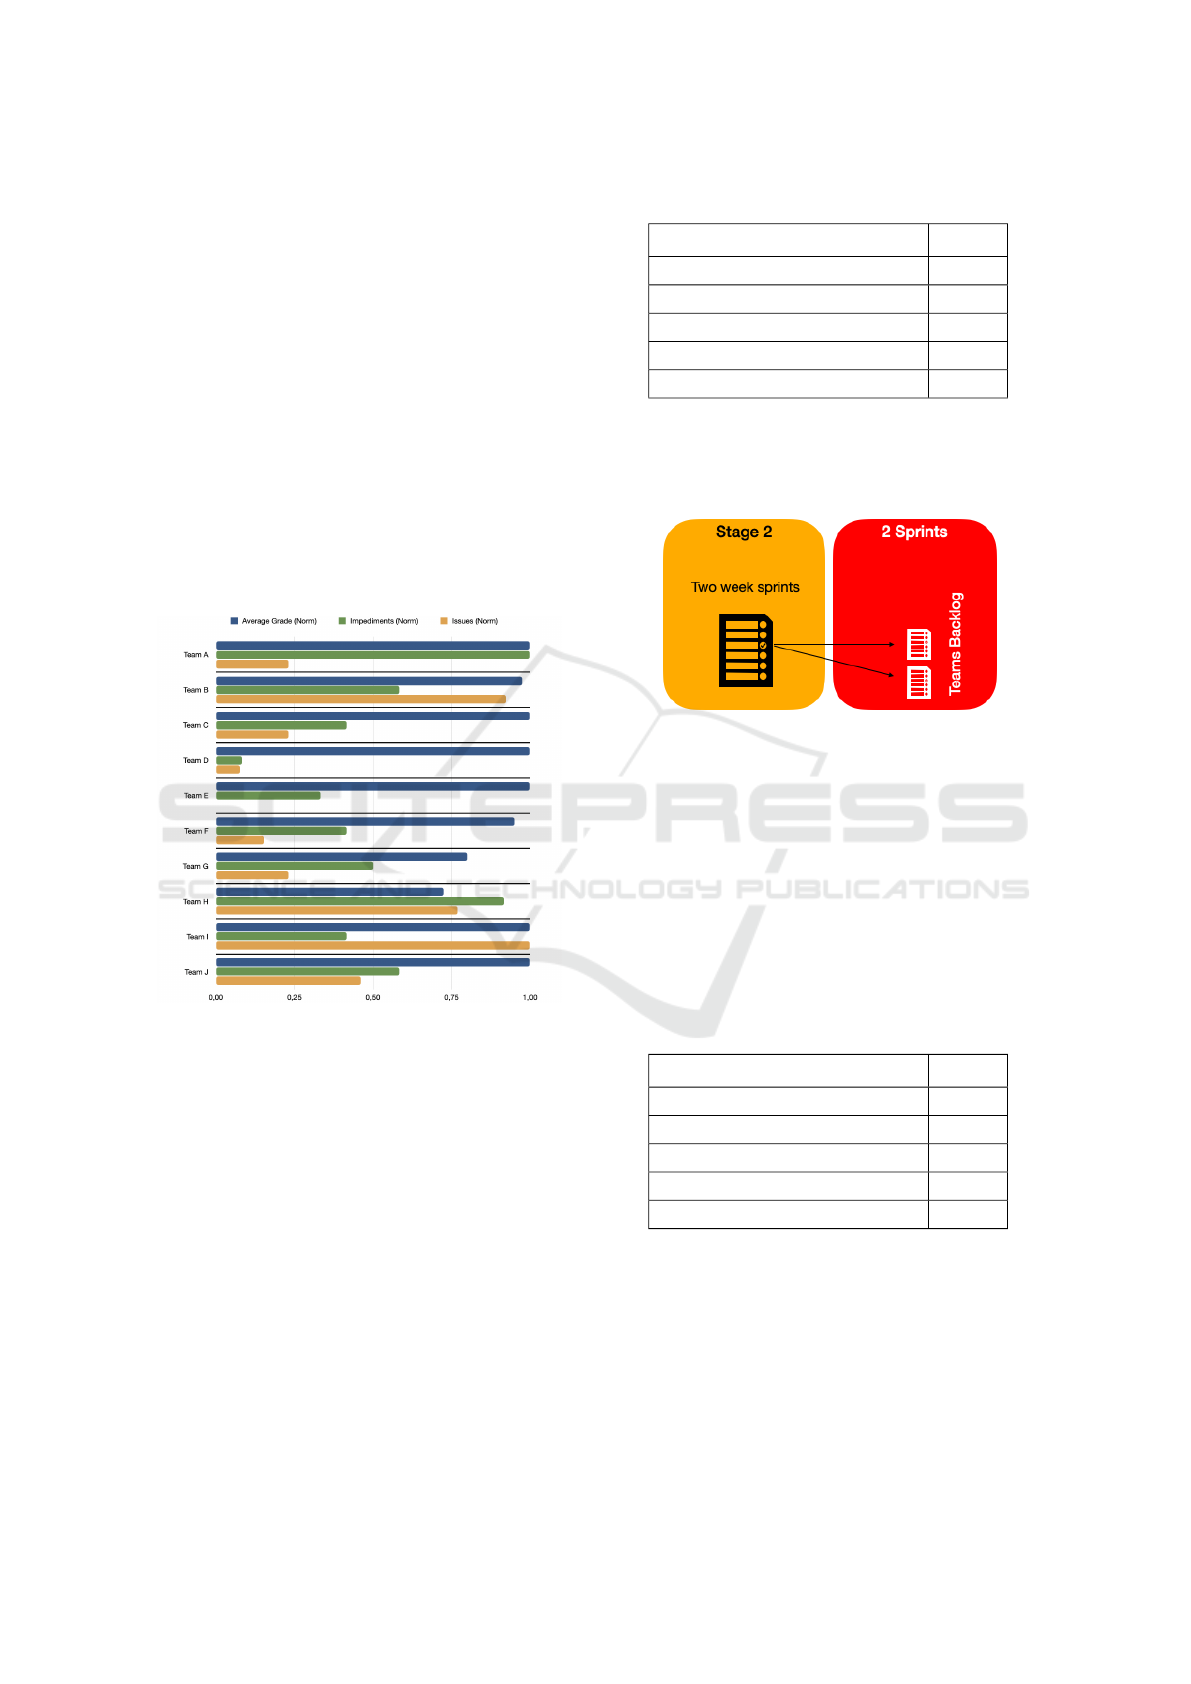
4.2 Stage 2
Figure 4 presents the second stage data, running two
sprints of two weeks length each. In this configura-
tion setting, the majority of teams had a score of more
than four on a scale from 1 (worst) to 5 (best), ex-
cept by two teams (Team G and Team H). Half teams
had more than five impediments, however from these
teams, only one team (Team G) scored less than 4
points out of 5. Table 2 describes the overall Stage
2 results.
Figure 4: Stage 2 Results.
During Stage 2, running two sprints of two weeks
each (Figure 5), we have found on average 1.6 imped-
iments per team per week (not different from Stage 1)
and 1.6 issues per team per week (the double when
compared to Stage 1). Another difference when com-
pared to Stage 1 is the overall average number of im-
pediments (6.3). it has increased by 23%. However,
the sprints length was twice as big (two weeks x one
week).
Two teams (Team A and Team H) had a high num-
ber of impediments (10 impediments each). However,
Team A got the highest score (5 out of 5) and Team H
had an average score (3 out of 5). This score differ-
ence was caused because the number of Team H is-
sues (60% more than team A). Teams with high num-
ber of impediments and high number of issues will not
score as a team with high number of impediments and
Table 2: Stage 2 Data.
Aspect Result
Avg score 4.7
Avg # of impediments 6.3
Avg # of issues 5.3
Avg # of weekly impediments 1.6
Avg # of weekly issues 1.3
low number of issues. The conjunction of the number
of impediments plus the number of issues will deter-
mine a team success on a configuration of two weeks
length sprints.
Figure 5: Stage 2 Setting.
4.3 Stage 3
Figure 6 presents the third and the last stage data, run-
ning two sprints of three weeks length each. On this
configuration setting, 40% of teams had 10 impedi-
ments each, however it had no impact on their score
4+ on a scale from 1 (worst) to 5 (best). Three teams
had 10 issues each, however it also had no impact on
their score 4+ on a scale from 1 (worst) to 5 (best).
Table 3 describe the overall Stage 3 results.
Table 3: Stage 3 Data.
Aspect Result
Avg score 4.6
Avg # of impediments 8.2
Avg # of issues 8.4
Avg # of weekly impediments 1.4
Avg # of weekly issues 1.4
During Stage 3, running two sprints of three
weeks each (Figure 7), the team with the lowest score
(Team I) reported a low number of impediments and
no issues. Similar to what was found on Stage 1, a
team with low number of issues and impediments had
the lowest score. This could indicate that reporting a
low number of impediments could be related to not
perceiving problems during a sprint.
We have not found difference on the average score
ICEIS 2022 - 24th International Conference on Enterprise Information Systems
102
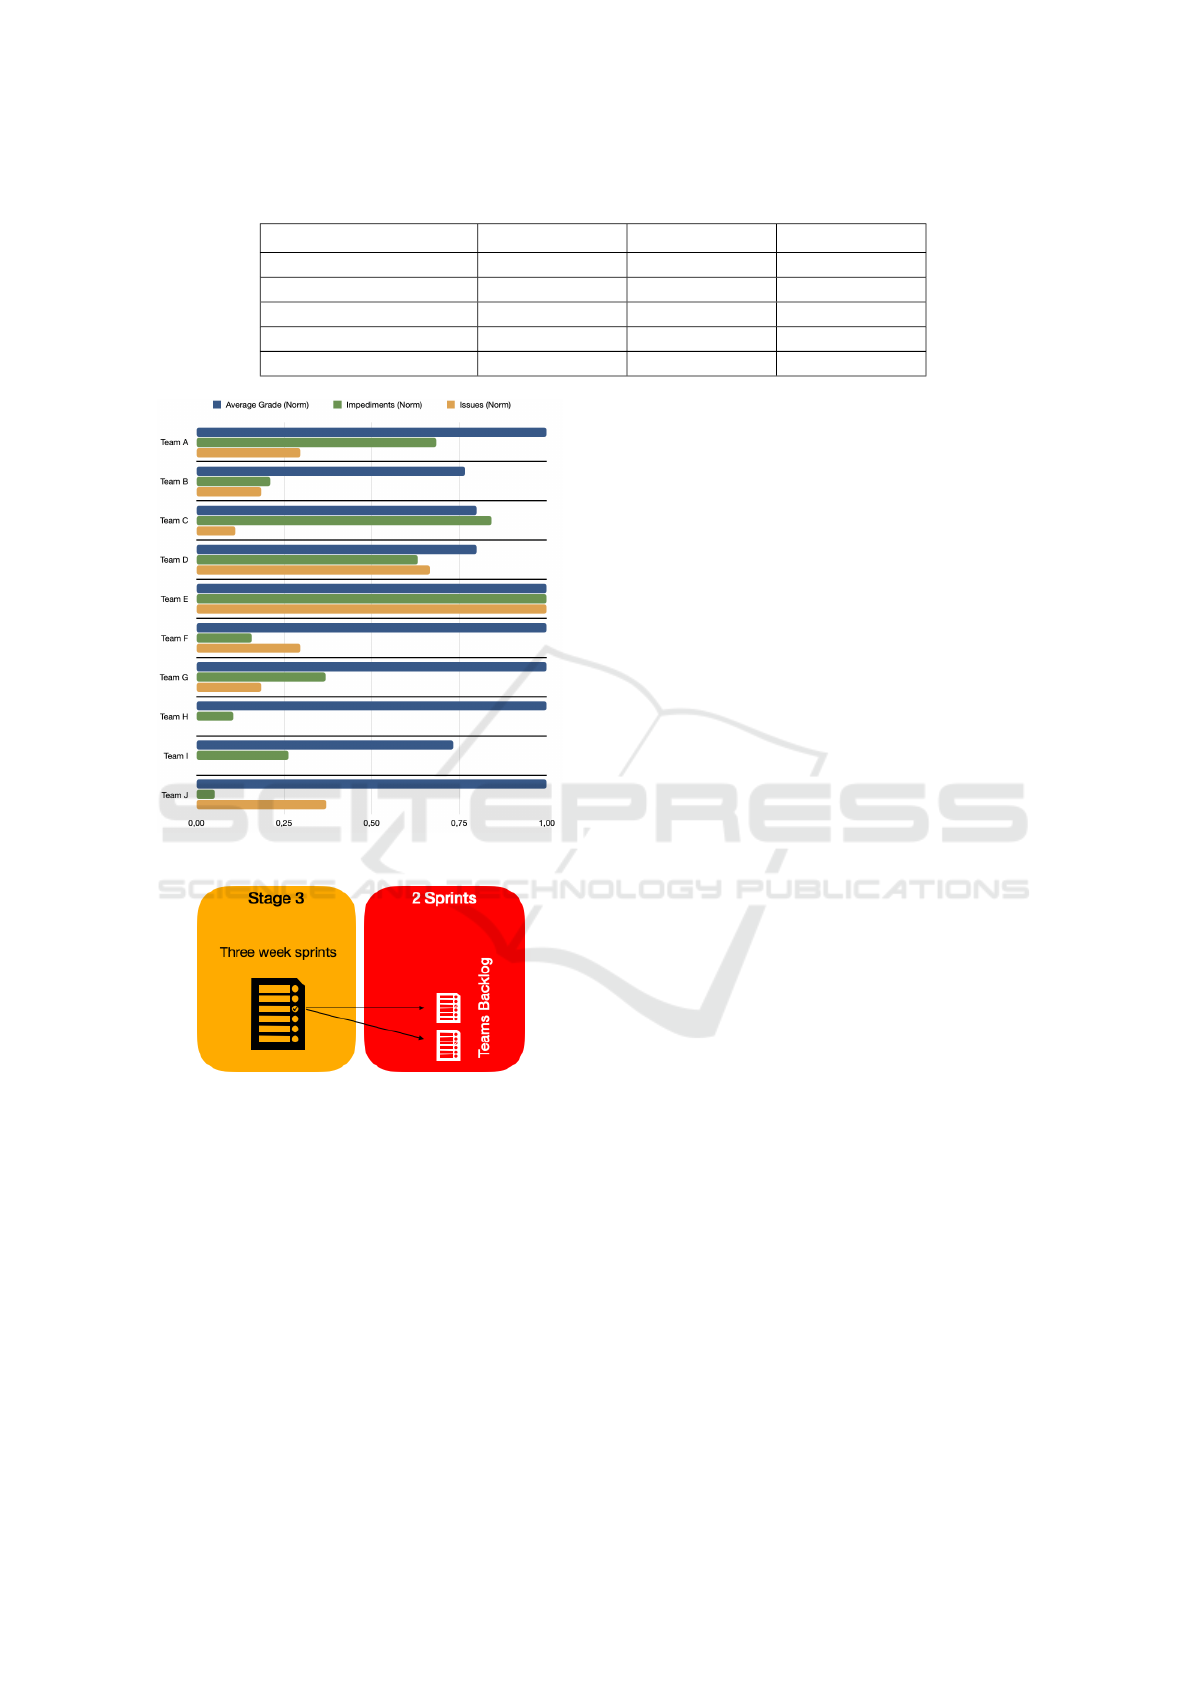
Table 4: Statistics Per Team in Each Stage.
Variable Stage 1 Stage 2 Stage 3
Evaluation score 4.5 ± 1.4 (5) 4.7 ± 1.5 (5) 4.6 ± 1.5 (5)
Impediments 4.8 ± 3.2 (9) 6.3 ± 3.2 (12) 8.2 ± 6.3 (19)
Issues 2.2 ± 2.7 (9) 5.3 ± 4.7 (13) 8.4 ± 8.4 (27)
Weekly impediments 1.6 ± 1.1 (3) 1.6 ± 0.8 (3) 1.4 ± 1.1 (3.17)
Weekly issues 0.7 ± 0.9 (3) 1.3 ± 1.2 (3.25) 1.4 ± 1.4 (4.5)
Figure 6: Stage 3 Results.
Figure 7: Stage 3 Setting.
of 10 different teams in the three different stages.
Regardless of sprint length composition, the average
teams score was almost the same across stages. Be-
sides, no significant difference was found on the aver-
age number of weekly impediments and average num-
ber of weekly issues.
4.4 Combined Results Analysis
Other than the analysis of each stage individually,
statistics regarding all three stages are presented in
Table 4. For each variable in a stage, we present the
average value per team, the standard deviation and the
absolute maximum value.
After running a set of unpaired t tests for each
variable in the different stages, we could not find sig-
nificant statistical difference in the obtained results.
In this context, the differences presented at this first
analysis set can only serve as indicatives for future
studies.
Moreover, we decided to seek correlation between
the evaluation provided by the instructors, weekly
impediments and weekly issues. To achieve this,
we have used Pearson’s correlation coefficient, which
presents the strength and direction of the relationship
between two variables. The results obtained are pre-
sented in Table 5, where we present the r-value ob-
tained and the significance level (p-value).
These results from Table 5 indicate that for
p<0.05, we have had correlations in two stages:
1. Stage 2: A strong correlation between instructors
evaluation and weekly impediments and weekly
issues.
2. Stage 3: A strong correlation between instructors
evaluation and weekly impediments.
All other correlations cannot be guaranteed for
p<0.05 and thus have been considered not statisti-
cally significant.
5 DISCUSSION
Given the results found in the study, we have sought to
answer the proposed research question: “What are the
effects of using different sprint lengths on agile soft-
ware development on project performance, amount of
impediments and amount of issues?”
Our first analysis revolves around the team statis-
tics on each stage. We have observed differences in
some aspects, such as evaluation and weekly imped-
iments. These differences, however, have not been
statistically significant and can only be seen as indica-
tives regarding the impacts of different sprint lengths
in agile teams. Thus, the insights from this data point,
presented in Table 4, indicate that the sprint length
does not impact significantly the evaluation, weekly
issues and weekly impediments in the context under
study.
Is There an Optimal Sprint Length on Agile Software Development Projects?
103

Table 5: Correlation Results.
Evaluation Correlation Weekly impediments Weekly issues
Stage 1 (p-value) -0.0355 (0.923) -0.6079 (0.063)
Stage 2 (p-value) 0.6757 (0.032) 0.6874 (0.028)
Stage 3 (p-value) 0.6364 (0.048) 0.3971 (0.256)
The second analysis focuses on understanding
how correlation between evaluation and both weekly
issues and impediments changes when different sprint
lengths are applied in agile software development. In
this scenario, we have found two interesting correla-
tions. Those happened during Stage 2, between eval-
uation and both weekly impediments and issues, and
during Stage 3, between evaluation and weekly im-
pediments. Although causality can not be assured,
this correlation is an indicative that some influence
could be present.
At Stage 2, results indicate that instructors were
more likely to positively evaluate team which both
had more weekly impediments and issues. In terms
of impediments, this could indicate that, when using
two-week sprints, teams which could identify imple-
mentation problems (and thus reported in the daily
meeting log) were more likely to solve these prob-
lems. It is difficult to assess specifically if this was
the case, but it is a possibility, nonetheless.
Finally, on Stage 3, results indicate a positive cor-
relation with weekly impediments. As this result is
similar to the one found during Stage 2, where a
correlation between evaluation and impediments was
found, it could further connect these two variables.
On this context, this result provides an indicative that
perceiving failure could be crucial to solving it.
6 LIMITATIONS
Our study was conducted with a limited number of
respondents and from the same mobile development
program. In addition, our results are drawn based on
participants generated data points and all inferences
and analysis rely on the validity of these data points.
Therefore, results reported in this study are dependent
on the participants’ honesty, perceptiveness and judg-
ment.
Another limitation of this study could be related
to experience level of participants. As students were
part of a mobile development course, it is expected
that the experience of students could have an impact
their performance.
The translation and coding processes were man-
ually performed. Even ensuring they were correctly
executed, errors could have been made and conse-
quently influenced results. An additional aspect to
consider is that all projects were executed sequen-
tially during the stages and participants were devel-
oping software in an education context. On this con-
text, it is possible that the experience from the pre-
vious projects somehow improved their development
skills, changing their development practices and thus
have influenced the results.
7 CONCLUSION
This paper presented results from a field study con-
ducted during eight months with students from a mo-
bile application development course. It has performed
data collection from 10 different projects at three dif-
ferent research stages on a total of 30 projects.
As results from quantitative analysis, we have
found a strong correlation between instructors eval-
uation and weekly impediments and weekly issues.
Also statistically, we have found a strong correlation
between instructors evaluation and weekly impedi-
ments. These results were analyzed through a quan-
titative perspective and were reinforced by looking at
previous works conducted on similar topics.
Preliminary results present indicatives that sprint
length do not have a direct impact on project evalu-
ation. Generalization of these results would require
more research. In addition, we have also found in-
dicatives that weekly issues and impediments could
be related to projects evaluation outcome.
As a future work, we will conduct this same re-
search in an industry environment with more experi-
enced developers. To achieve this, we intend to run
a qualitative analysis combined with a quantitative
analysis in order to further investigate whether our
findings are concise.
REFERENCES
Anand, R. V. and Dinakaran, M. (2016). Popular agile
methods in software development: Review and analy-
sis. International Journal of Applied Engineering Re-
search, 11(5):3433–3437.
Barry, E. J., Mukhopadhyay, T., and Slaughter, S. A. (2002).
Software project duration and effort: an empirical
ICEIS 2022 - 24th International Conference on Enterprise Information Systems
104

study. Information Technology and Management, 3(1-
2):113–136.
Beck, K. and Andres, C. (2004). Extreme Programming
Explained: Embrace Change (2Nd Edition). Addison-
Wesley Professional.
Beck, K., Beedle, M., Van Bennekum, A., Cockburn, A.,
Cunningham, W., Fowler, M., Grenning, J., High-
smith, J., Hunt, A., Jeffries, R., et al. (2001). Man-
ifesto for agile software development.
Bider, I. and S
¨
oderberg, O. (2016). Becoming agile in a
non-disruptive way-is it possible? In ICEIS (1), pages
294–305.
Bourque, P. and Fairley, R. (2018). SWEBOK v3.0: Guide to
the Software Engineering Body of Knowledge. IEEE
Computer Society Products and Services.
Conboy, K. and Fitzgerald, B. (2010). Method and Devel-
oper Characteristics for Effective Agile Method Tai-
loring: A Study of XP Expert Opinion. ACM Trans-
actions on Software Engineering and Methodology
(TOSEM), 20(1):47–77.
de Alc
ˆ
antara, P. T. R., Canedo, E. D., and da Costa, R. P.
(2018). People management in agile development. In
ICEIS (2), pages 92–103.
de Souza Mariz, L., Franca, and da Silva, F. (2010). An Em-
pirical Study on the Relationship between the Use of
Agile Practices and the Success of Software Projects
that Use Scrum. In Software Engineering (SBES),
2010 Brazilian Symposium on, pages 110–117.
Grabis, J., Meiers, E., Supulniece, I., Berzisa, S., Ozolins,
E., and Svaza, A. (2016). Aligning software design
with development team expertise. In ICEIS (1), pages
560–565.
Hall, R. (2008). Applied Social Research : Planning, De-
signing and Conducting Real-World Research. pal-
gave macmillan.
Hasnain, E. (2010). An Overview of Published Agile Stud-
ies: A Systematic Literature Review. In Proceedings
of the 2010 National Software Engineering Confer-
ence, NSEC ’10, pages 3:1–3:6, Rawalpindi, Pakistan.
ACM.
Macias, F., Holcombe, M., and Gheorghe, M. (2003).
A Formal Experiment Comparing Extreme Program-
ming with Traditional Software Construction. In Pro-
ceedings of the Fourth Mexican International Confer-
ence on Computer Science, pages 73–80.
One, V. (2015). 9th Annual State of Agile Survey. Technical
report, Version One.
Pressman, R. S. (2005). Software engineering: a practi-
tioner’s approach, chapter 3, pages 65–93. Palgrave
Macmillan, New York, NY, USA.
Reichlmayr, T. (2011). Working towards the student Scrum
- Developing Agile Android applications. ASEE An-
nual Conference and Exposition, Conference Pro-
ceedings.
Santos, V., Goldman, A., and Roriz Filho, H. (2013). The
Influence of Practices Adopted by Agile Coaching and
Training to Foster Interaction and Knowledge Sharing
in Organizational Practices. In 46th Hawaii Interna-
tional Conference on System Sciences (HICSS), pages
4852–4861.
Scharff, C. and Verma, R. (2010). Scrum to Support Mo-
bile Application Development Projects in a Just-in-
time Learning Context. Proceedings - International
Conference on Software Engineering, pages 25–31.
Schwaber, K. (2004). Agile Project Management with
Scrum. Microsoft Press, USA, 1st edition.
Schwaber, K. and Sutherland, J. (2011). The scrum guide.
Scrum Alliance, 21.
Tore, D. and Torgeir, D. (2008). Empirical studies of agile
software development: A systematic review. Informa-
tion and Software Technology, 50(9:10):833 – 859.
Is There an Optimal Sprint Length on Agile Software Development Projects?
105
