
Scientific Data Analysis using Neo4j
Victor Chang
1a
, Yeshwanth Kumar Songala
2
, Qianwen Ariel Xu
2b
and Ben Shaw-Ching Liu
3c
1
Department of Operations and Information Management, Aston Business School, Aston University, Birmingham, U.K.
2
Cybersecurity, Information Systems and AI Research Group, School of Computing, Engineering and Digital Technologies,
Teesside University, Middlesbrough, U.K.
3
Department of Marketing, Lender School of Business Center, Quinnipiac University, Hamden, CT 06518 U.S.A.
bsliu@QU.edu
Keywords: Smart Home, Ethics, Internet of Things, Data Analytics.
Abstract: There is new material regarding Neo4j algorithm questions posed in this report as well as where we did our
due diligence research to resolve them. These results often provide details, including inquiries recorded after
each monitoring period. Initially, a literature review supported the development of an initial data modeling,
which was further provided as experimental analysis. By using Neo4j Graph Database, graph analytics can
provide useful analysis.
1 INTRODUCTION
Due to recent innovations in social networks, e-
commerce and website tracking technology, data
collection and management have become a challenge
for data storage and retrieval. Today, we work with
data that cannot be stored in a traditional database
because it has a huge volume. There is no longer a
consensus that Relational Databases (RDBs) are the
best solution to data complexity problems and volume
growth in terms of scale.
Although RDB designs have shown to be flexible
and scalable in complex systems, Graph Databases
(GDBS) can be better in these two aspects (Pokorny,
2016). A GDB makes use of nodes, margins,
attributes, and graphs for data representation and
makes direct use of database objects seem like data
elements. Data may be connected to the other without
using intermediate folders or data views, and it is
possible to retrieve a highly complex query using a
single connection process in certain situations. Neo4j
is open-source and matches a broad adoption of the
ACID (Atomicity, Consistency, Isolation, and
Durability) properties is a highly scalable open-
source graph database with good interest (Neo4j
Graph Database Platform, 2021a). Under the
a
https://orcid.org/0000-0002-8012-5852
b
https://orcid.org/0000-0003-0360-7193
c
https://orcid.org/0000-0002-2950-9607
"network-driven" approach (there are said to be nodes
with associations and resources in the above), a
network with data items is made up of a web of
connections, like those in the latter. Relationships 1)
have an index annotation, which tells you about all
the interactions among the nodes they belong to; and
2) are expressed as items that have indices to their
respective contexts. When working with semi-
structured data, Neo4j performs as well as it is said to
do. Moreover, applications that tend to be hierarchical
fit well the project models.
2 BACKGROUND WORK
Disruptive technology represents an innovative
method that greatly changes how a customer, an
industry, or a company manages. Disruptive
technologies would sweep across the industries or
conventions it takes the place of due to their
demonstrable superiority (Smith, 2020).
Automobiles, electrical services, and consumer
products could represent different types of disruptive
technology in their respective eras. More recently,
disruptive industries consist of the Internet of Things,
cloud computing, fintech, robotics, and artificial
Chang, V., Songala, Y., Xu, Q. and Liu, B.
Scientific Data Analysis using Neo4j.
DOI: 10.5220/0011036700003206
In Proceedings of the 4th International Conference on Finance, Economics, Management and IT Business (FEMIB 2022), pages 75-84
ISBN: 978-989-758-567-8; ISSN: 2184-5891
Copyright
c
2022 by SCITEPRESS – Science and Technology Publications, Lda. All rights reserved
75

intelligence (AI). Neo4j used in this paper is also one
of the disruptive technologies and has become a
leader in its industry.
Neo4j is disruptive in several ways. First of all, it
provides developers and data scientists with state-of-
the-art techniques to establish intelligent applications
and machine learning workflows in modern society,
which turns out available as a completely managed
cloud service or self-hosted (Neo4j, 2021). Second,
Neo4j is a persistent Java engine and an entirely
transactional database, in which structures can be
reserved based on graphs rather than tables. Third,
Neo4j employs native graph reservation, removing
restrictions of administrating and reserving data in a
highly regulated way. It is regarded as one of the most
prevalent and most used graph databases globally,
applied in various fields such as health, government,
automotive production, and military. Lastly, most
databases currently operate based on a server
accessible through a client library. Neo4j can run in
server and embedded modes depending on data
analysis requirements (Fernandes and Bernardino,
2018).
This paper analyses the dataset with numerous
algorithms in neo4j. We can learn how the
implementation and mutation work on large-scale
data set by these algorithms. The objectives of this
paper are as follows:
1) Finding the interconnectivity between nodes
and relationships using the Louvain
Community Detection Algorithm.
2) Finding the similar sets using the Jaccard
Similarity Algorithm.
3) Measuring the nodes and relationships using
Betweenness Algorithm.
4) Ranking the nodes and entities using Page
Ranking Algorithm.
5) Prioritizing the nodes using the Modularity
Detection Algorithm.
6) Node calculations using the Clustering
Coefficient Algorithm.
7) Finding the shortest path using the All-Pair
Shortest Algorithm.
8) Finding the node embeddings using the
Node2Vec Algorithm.
9) Finding the Strongly Connected components
between the nodes and relationships.
3 DATA MODELLING AND
EXTRACTION
The model involves depicting a disconnected network
of entities and their various attributes and
relationships on a general level, allowing users to
define general and complex structures. According to
its rules, a Graph database query is shaped to address
questions about Neo4j is written to meet the needs
and solve commercial and technological challenges in
the context of both technical and organizational issues
(Haojun et al., 2020).
To better understand the process of designing a
graph data model, let us take a small set of data from
the healthcare domain and walk through each step of
creating a graph data model. The data this paper used
is Safeguarding Adults.
Let us extract our graph database schema
visualization. As shown in Figure 1, this schema
contains nodes and relationships directed to each
node, where the region node and council node act as
constraints. The region node is directed to the council
node, which has a relationship of HAS_COUNCIL.
Suppose we want to find out which council in the
database can query between the region and council
nodes to find out the council sub-nodes. Each sub-
node is then followed by the relationship,
respectively.
The file loaded with headers and created nodes
with labels and properties can also create a graph
entity from a map. All the key/value pairs in the map
will be set as properties on the created relationship of
a node.
4 EXPERIMENTAL ANALYSIS
4.1 Louvain Community Detection
The Louvain community detection algorithm was
proposed in 2008 as a tool for communities that sped
up the analysis of complex networks. It has two
distinct stages: Local Moving Nodes and Aggregation
of the network.
The algorithm begins with a network of N nodes
connected by equal-weighted links (Hu et al., 2016).
During the first loop, the algorithm's operations, the
connections to all the networks are each given a group
to reside in their own nodes. Each node looks at the
neighboring nodes and judges if the one to be
"expanded" has a positive or negative effect on the
node-size community by looking for ways to reduce
the size of the existing node connections (Ryu and
FEMIB 2022 - 4th International Conference on Finance, Economics, Management and IT Business
76
Kim, 2016). If the increase in group benefit
outweighs the costs and individual gains, the node
would be added to the community. Otherwise, it will
stay in the same place. Any single instance of this
method is carried out on its own on all nodes before
no more change is observed (Ghosh et al., 2018). The
first iteration of the Louvain algorithm has reached a
local maximum as it finds the global maximum
expansion set of elements. If the initial network has
been created, in the first step, the algorithm expands
it by treating communities in the initial network as
nodes. When the second step is over, the algorithm
can then expand the result of the first phase to the new
network. These procedures are performed several
times before the network has no further connections
and optimum modularity has been achieved.
At the same time, the Louvain algorithm locator
tries to identify groups when expanding. It is most
often used because it is easy to use and fast.
As we stated, the Louvain approach is a
community discovery algorithm that detects
populations in networks. It maximizes each
community's modularity score. In contrast,
modularity quantifies the consistency of a node's
assignment to a group.
The output is visualized in Figure 1 below.
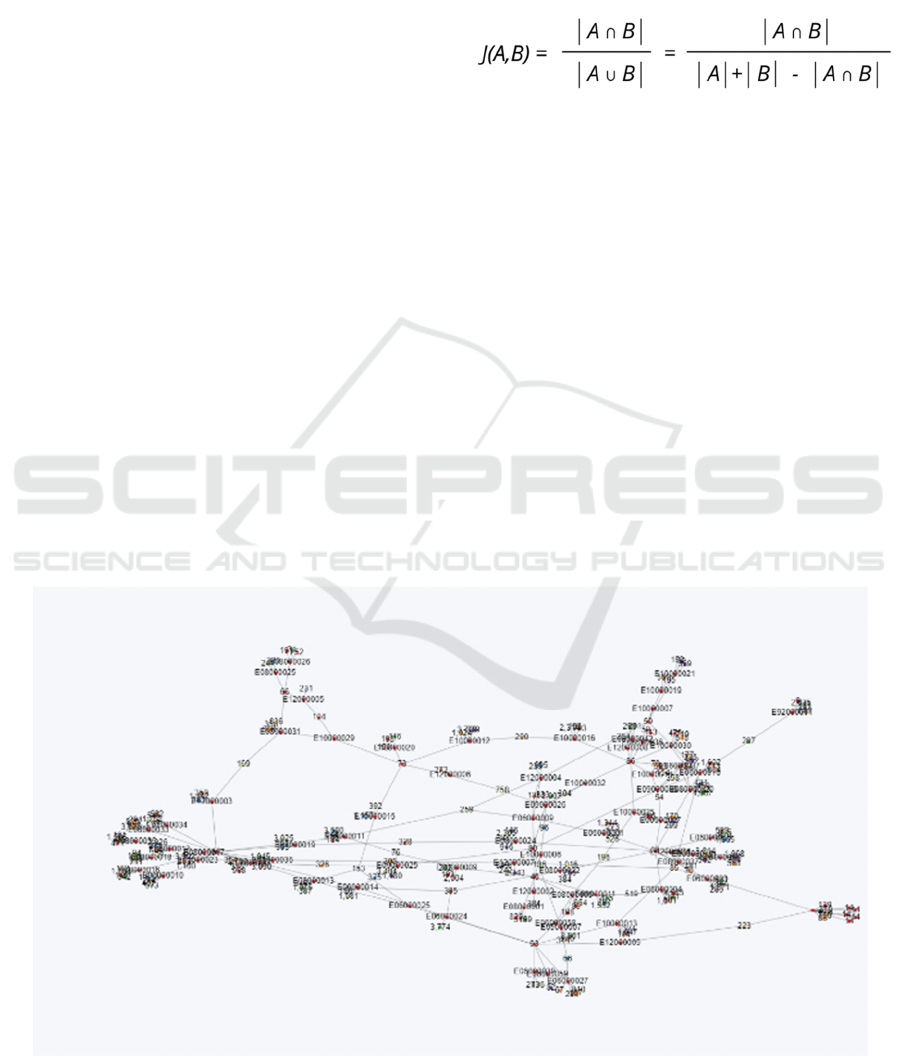
4.2 Jaccard Similarity Algorithm
The Jaccard Similarity, a concept introduced by Paul
Jaccard, refers to the measure of relationships
between sets. The formula for Jaccard similarity is
notated below.
The input for this algorithm is a bipartite,
disconnected graph comprising two disconnected sets
of nodes. Each partnership begins with first node
instances and finishes with instances of second-node
or subtypes.
The Node Similarity algorithm compares each
node that has outgoing relationships with another
node of the same kind (Neo4j Graph Database
Platform, 2021c). We collect the outgoing
neighborhood N(n) of each node n, that is, all nodes
m that have a connection from n to m. The algorithm
computes a similarity for each pair n, m, which is the
Jaccard similarity of N(n) and N(m) (m). The
algorithm strips away ambiguity by ignoring nodes
that are no longer in contact and a function of
numerical difficulty (Bie et al., 2020).
The algorithm generates new relationships
between pairs of the first node-set. Relationship
properties are used to express similarity ratings.
Figure 1: Community Detection graph.
Scientific Data Analysis using Neo4j
77
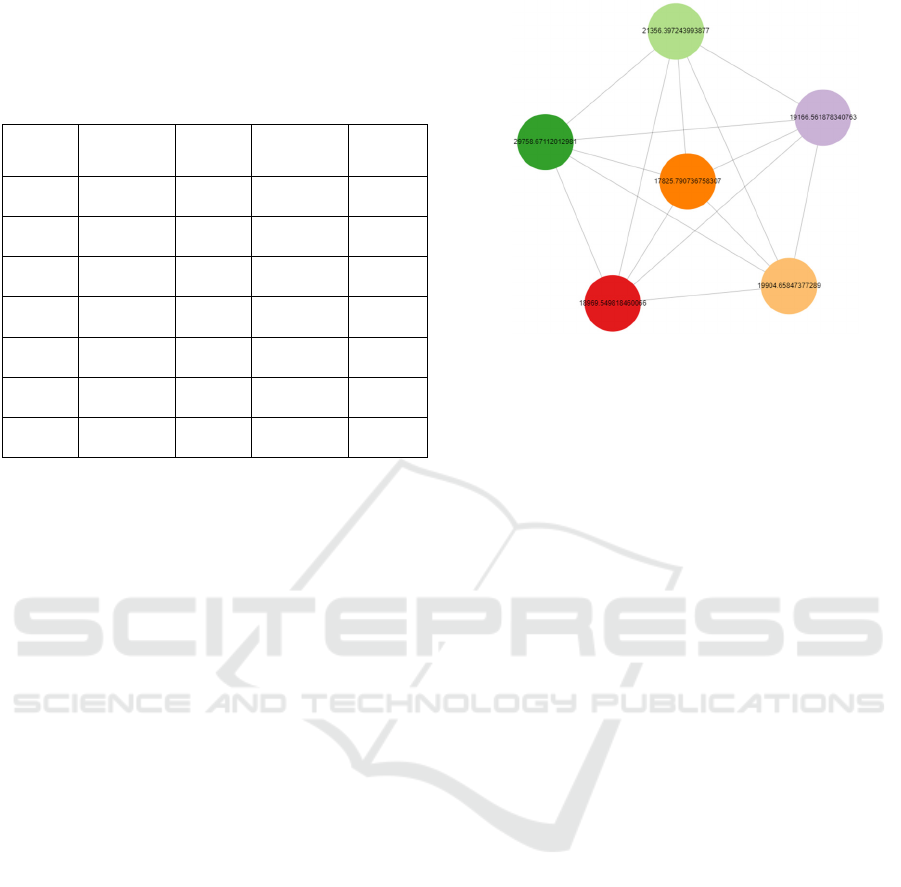
The table below shows the results from two nodes
with properties where each node has a similarity of 0.6.
Table 1: The score of each node respective to their labels
and properties.
From
Labels
From
Properties
To Labels
To
Properties
Similarity
REGION County REGION
Outer
Londo
n
0.6
REGION County REGION
Unitary
Authority
0.6
REGION County REGION
Metropolitan
District
0.6
REGION
Inner
Londo
n
REGION
Outer
Londo
n
0.6
REGION
Metropolitan
District
REGION
Unitary
Authority
0.6
REGION
Outer
Londo
n
REGION
Inner
Londo
n
0.6
REGION
Unitary
Authority
REGION
Metropolitan
District
0.6
4.3 Betweenness Centrality
Betweenness centrality measures how much power a
node has on the flow of knowledge in a graph. It is
often used to locate nodes that link two parts of a
graph (Chen et al., 2017).
Brandes' estimated algorithm for unweighted
graphs serves as the foundation for the GDS
implementation. The algorithm finds the unweighted
shortest path between two nodes in a graph (Vu and
Potika, 2020; Petersen et al., 2016). A score is
assigned to each node depending on the amount of
shortest paths that pass through it. Higher
betweenness centrality scores would be assigned to
nodes that often lie on the shortest paths between
other nodes (Roditty and Shapira, 2011; Jha and
Sunitha, 2017). The implementation takes up O(n +
m) space and runs in O(n * m) time, where n is the
number of nodes in the graph and m is the number of
relationships.
Vertices with a strong betweenness greatly impact
a graph due to their power over transferring
knowledge between multiple vertices (Chehreghani,
2014; Xu et al., 2019). This also suggests that
eliminating them from the network would create the
most disturbance of the network's knowledge flow.
The output is visualized in Figure 2. We can see
the betweenness for each node with a higher rate of
29758.671120 and a lower rate of 17825.790736,
which has multiple connections between every node.
So, the shorted path of the node has a betweenness of
17825.790736.
Figure 2: Betweenness Centrality Graph.
4.4 Page Ranking Algorithm
This post proposes using a random walk algorithm
based on Personalized PageRank (PPR) to
disambiguate NEs. Firstly, a network graph with all
vertices connected was built (Tian, 2010). We run the
PPR algorithm on this graph, with the restriction that
only the highest-scoring candidate should become the
start point of a hop and efficiently filter out potential
noise. Since all candidates but the correct ones are
incorrect and most definitely wrong, limiting the
random walk (Altman and Tennenholtz, 2005).
The following characteristics are shared by our
system: 1) Our solution does not have training model
parameters since it is focused on a random walk
algorithm; 2) our process can better utilize the local
similarities between a region node and a council node,
and we customize the PPR algorithm to only
concentrate on one region node. Each graph node -
(m,c) is a pair of an entity mention m and a candidate
c; each node is given an initial normalized score for
all nodes for the same entity. If the data entry
referring to one of the two nodes includes a path to
the other node, we insert an edge between them.
Assuming that this relationship is bidirectional, we
conclude that this edge is undirected.
PageRank is a more sophisticated method of
calculating the value or significance of nodes than
merely counting the number of relationships that refer
to it (Scarselli et al., 2005). If a backlink comes from
a relevant node, it is assigned a higher weighting than
backlinks from unimportant nodes. A simple relation
from one node to another can be interpreted as a
ballot. However, not only is the number of votes
received by a page deemed significant but so is the
significance or validity of those who cast these votes.
FEMIB 2022 - 4th International Conference on Finance, Economics, Management and IT Business
78
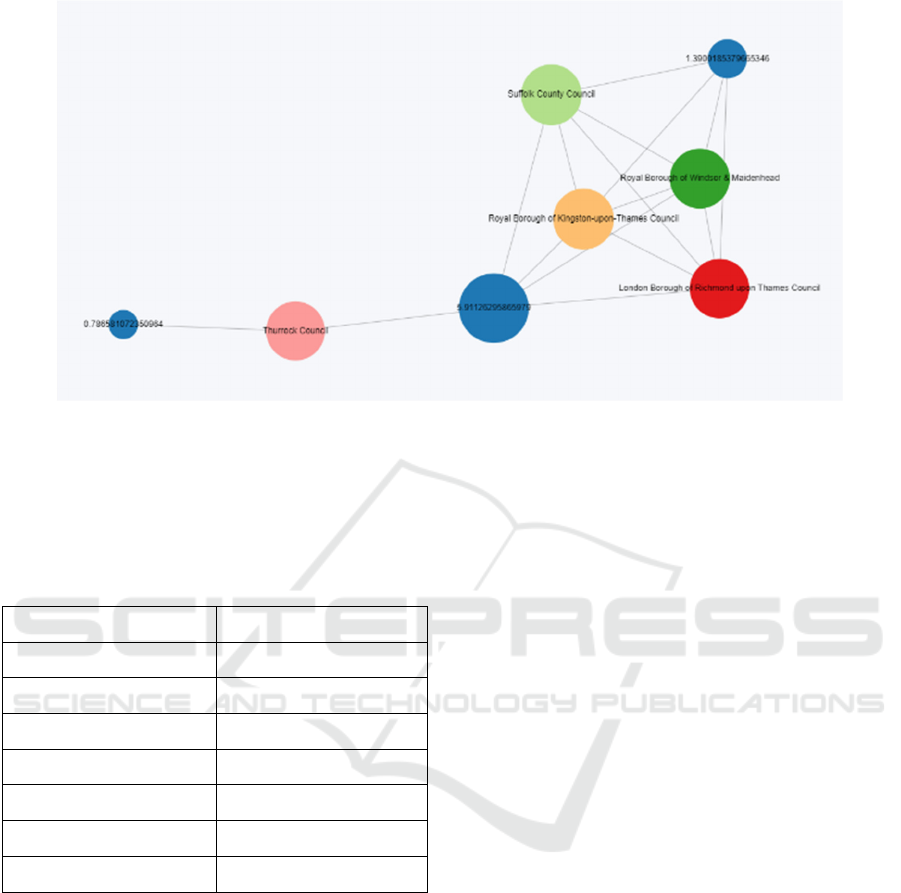
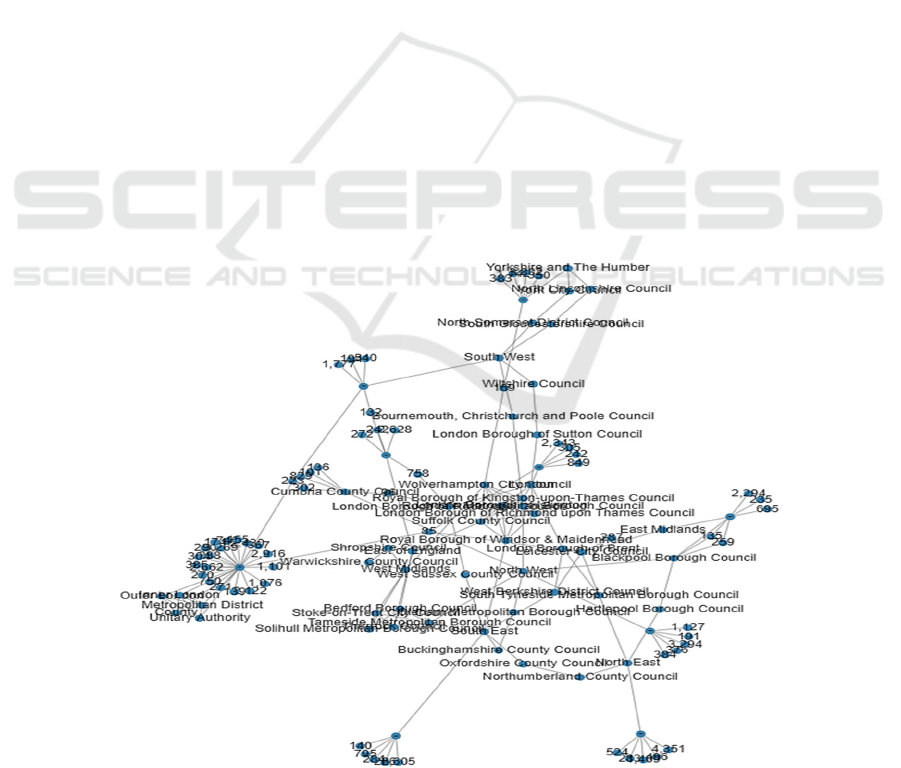
Figure 3: Graph showing the nodes connected with the page ranking.
Table 2 explains the page ranking and score with
the nodes where node(-) with the page rank of 19.633
has the highest score of 0.76244 and the lowest score
of 0.20486 from node 153, page rank of 0.803131.
Table 2: Results showing page ranking on each node.
Node Score
-, 19.633746216818693 0.7624459417182045
5, 1.0142337696277537 0.22313292682520117
76, 0.9820994517707731 0.22233425780285856
15, 1.0167618133593352 0.2222280314700857
85, 1.0115520314662718 0.22214709760622778
10, 0.9114799050759756 0.21350007391301917
153,0.8031313558603869 0.20486719490208813
As shown in Figure 3, the node with a page rank
of 1.390185 is connected to the multiple council
nodes with a higher page rank compared with other
nodes. The edge of the node is the node with a page
rank of 0.7858102, following with the council
Thurrock.
4.5 Modularity Detection Algorithm
When we consider vertices in a neighborhood to be
densely connected, the combination of these vertices
is often referred to as modules or groups. Moreover,
all the members of the same subgroup are like each
other. The challenge of community exploration is to
separate the network into clusters of vertices with
several edges inside clusters and little connections
within them. When evaluating the community
structure of a network, broad usage of modularity is
developed (Sun et al., 2020). This is particularly true
for the connectivity of groups and the extensibility of
modules. Node similarity and community similarity
are used for group identification. Most of the studies
so far are on locating some two connected nodes
based on local knowledge. It means that, while the
similarity of the community’s calculation ignores the
non-to-ness of local structure, it also analyses the
shared components pertinent to global
communication. However, the nature of two nodes'
interconnectedness is a key feature in network
expansion, and the extent of their interconnectedness
should be gauged to make it reliable. Currently, there
is nothing to be found in the literature about such an
approach.
There are also two different approaches to be
considered for finding new similarities between
nodes to expand this capacity to include global and
local communication (Meng et al., 2016). By utilizing
this general networking modularity, the conventional
modularity is established at a hierarchical scale, and
it unrolls each node's network to quantify the degree
of their relationship. Such actions quantify the level
of interconnectedness between the nodes and
subsequently create a group. The proposed similarity-
based generalized modularity measure is simplified to
the traditional one when the similarity matrix is
replaced by an adjacency matrix. It provides a
numerical weight to any partition of a network's
nodes following their communal characteristics. See
Figure 4.
Scientific Data Analysis using Neo4j
79
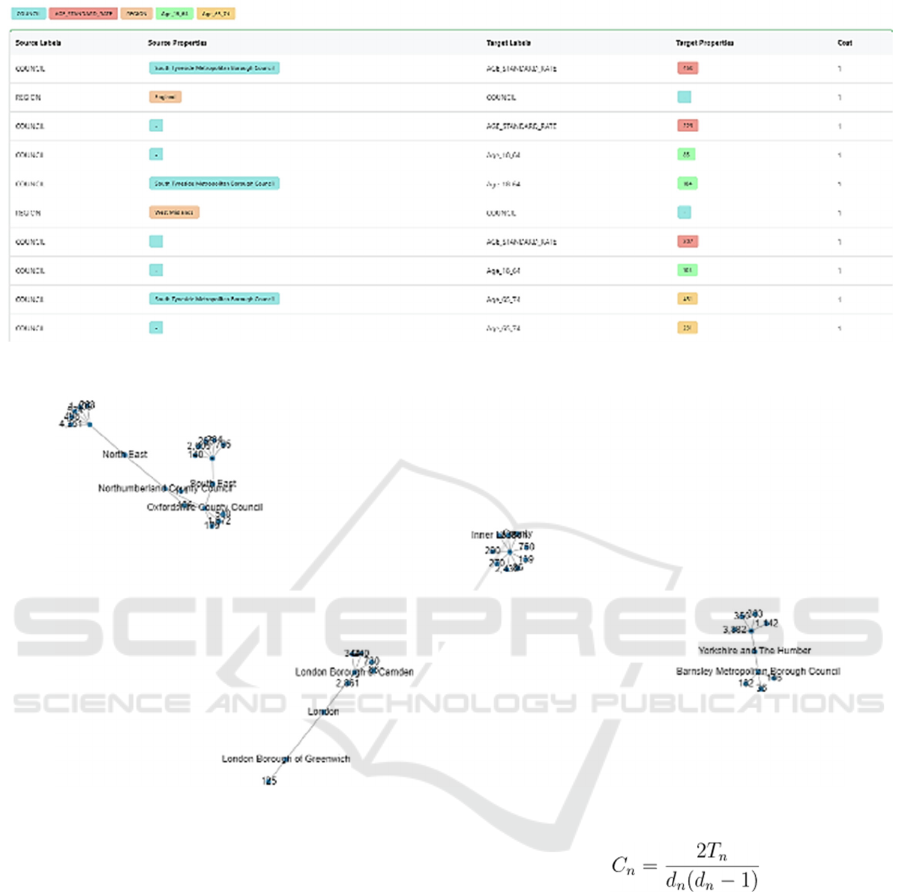
Figure 4: Result showing the modularity optimization on various nodes.
Figure 5: Graph showing the node optimized to respective modularity score.
The above table shows the modularity
optimization of nodes with source labels and
properties targeting other node labels. We can see that
the cost of all nodes was equal to 1. See Figure 5.
4.6 Clustering Coefficient Algorithm
The LCC (or Local Clustering algorithm) computes
the local clustering coefficients for each node in the
graph. The measure of the relatedness between nodes
denoted by the "Cn" of a given node defines the
probability that the nodes' "n" neighbors are also
associated. If we were calculating Cn, we could count
the number of triangles a node is involved in and the
degree of the node, and we have to do n node
calculations. To obtain the local clustering
coefficient, simply calculate the formula for cluster
ID as follows (Liao and Yang, 2017).
Furthermore, the algorithm will obtain the graph's
whole clustering coefficient of magnitude, not just the
isolated values. This is the root mean a square number
of the square of the local coefficients (Zhang et al.,
2014; Wang and Xu, 2019).
This can be done by declaring the gds local
clustering coefficient stream function and
configuring the parameters with node projection and
relationship projection (Qiu et al., 2006; Zhou, 2011).
In the next step, we yield the nodeId as coefficient
with utils of nodeId as node and coefficient ordering
them in the descending order to the integer limit.
FEMIB 2022 - 4th International Conference on Finance, Economics, Management and IT Business
80
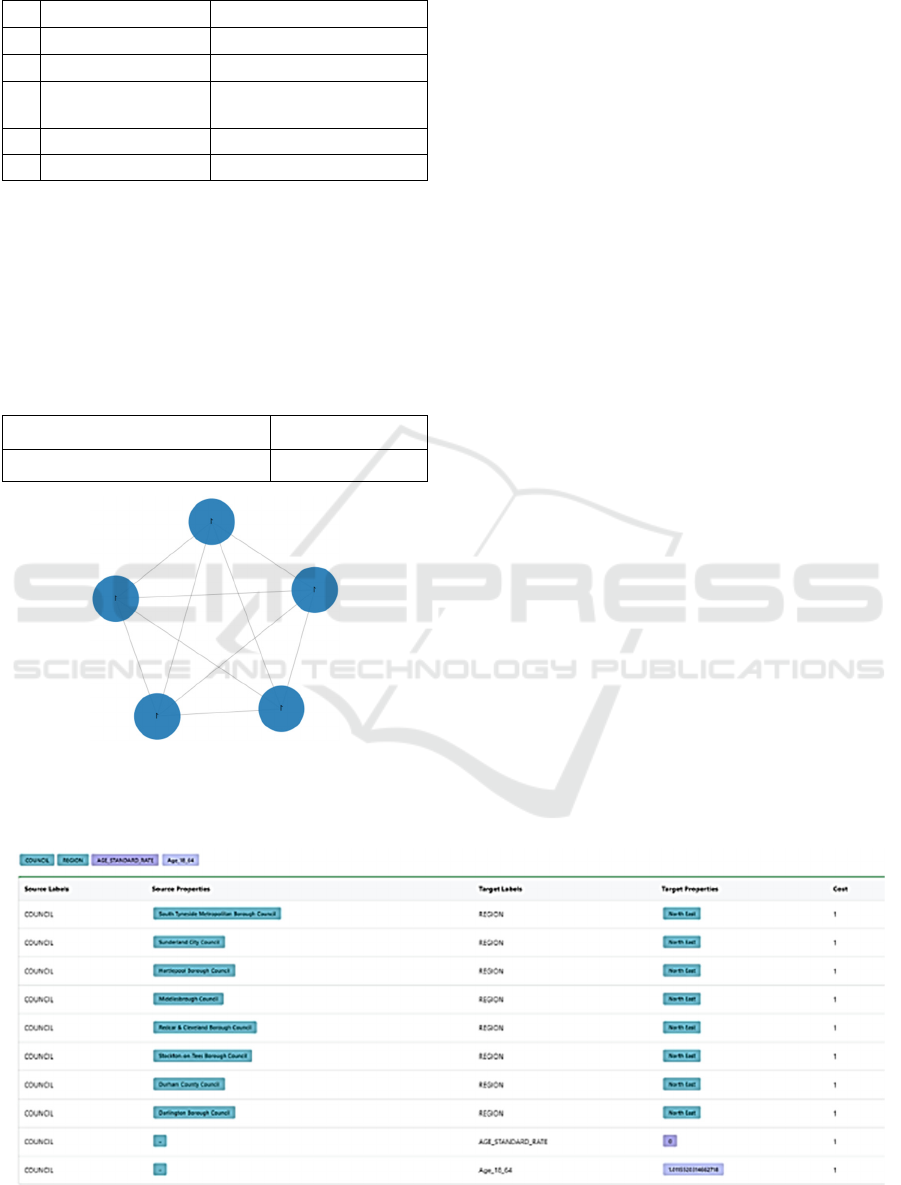
Table 3: Results showing the clustering coefficient.
name localClusteringCoefficient
1 "County" 1.0
2 "Inner London" 1.0
3 "Metropolitan
District"
1.0
4 "Outer London" 1.0
5 "Unitary Authority" 1.0
Now we are finding the average clustering
coefficient and node count by running the stats on
configuration, with the gds local clustering
coefficient function shown in Figure 6.
In the above, we declare the gds local clustering
coefficient function to determine the average
clustering and node count based on the configuration.
Table 4: Showing the average clustering on node count.
averageClusteringCoefficient nodeCount
0.02160838019616753 1408
Figure 6: Results showing the mapping between the
clustering coefficients.
4.7 All Pair Shortest Path
The All-Pairs Shortest Path (APSP) considers all of
the pair weights about the total weight. The runtime
complexity of this algorithm is less than that of using
the Single Source Shortest Path algorithm for a pair
of nodes in the graph (1).
In the scenario, certain nodes are unreachable, and
this means that no shortest path exists between certain
pairs of nodes. Since these nodes represent distinct
natural numbers, the algorithm would return the value
of Infinity, therefore, between them. The expandable
in plain text property does not allow text filtering, so
a value with a word whose text is Infinity (for
example, gds.util.Finite) was implemented to
improve.
Use-cases of All Pair Shortest Path:
1) Usage of the All-Pairs Shortest Path includes
providing services (which also involves
placement of facilities) and certain urban
issues, which would like to identify the
shortest path connecting different locations,
separate sets of locations.
2) Per pair of endpoints in the REWIRE’s
shortest route has an active role in REWIR's
network architecture, resulting in the full
bandwidth and minimum delay network
design.
Using the Neo4j database, we are loading our all-
shortest pair algorithm to configure the data with
node projection and relationship projection. The
parameters are limited to 10 nodes and relation type
with default and orientation directed as Natural. All
the nodes were checked while processing with empty
properties—declaring the start node and end node
null because we must find the shortest distance
between all nodes in the graph in Figure 7.
Figure 7: Results showing the score of the shortest pair with nodes and properties.
Scientific Data Analysis using Neo4j
81
4.8 Node Embeddings / Node2Vec
The graph is modeled using random walks in the
algorithm Node2V, a node embedding method that
computes a vector representation of each node in turn
(Moon et al., 2019). Walking through the community
in an unplanned sequence is conducted to provide
information on the general attributes of the place.
Randomly picking out a large number of
neighborhoods and iterating over their activation
patterns (neighborhood vectors) is used to train a
single hidden layer neural network. To help build a
neural network better understand the probability that
a certain node is walking, they are programmed to
look for the possibility of doing so.
The data set we have taken to produce some
dimensional analysis from node to vector. Scaling a
large amount of data can be done in seconds to
visualize the graph. It is useful to embed the nodes
with weight properties and iterations. For each
iteration, the time complexity may be different from
the result of the graph.
4.9 Strongly Connected Components
The Strongly Linked Components (SCC) algorithm
seeks the maximum number of connected nodes in a
guided network. If there is a guided path between
each pair of nodes in a set, it is called a strongly linked
part. It is often used early in the graph analysis phase
to help us understand how our graph is organized
(Neo4j Graph Database Platform, 2021b).
Tarjan described the first linear-time algorithm in
1972, and SCC is one of the earliest graph algorithms.
The depth-first search algorithm is commonly used to
decompose a guided graph into its closely linked
components (Hong et al., 2013).
In our implementation, we only used dynamic
graph data structures with associated lists for the
adjacency array. The graph generator class ensures
that each vertex is stored in a sequential position in
the adjacency list.
The guided graph interface specifies several
approaches to enforce that each node represents a
special data member of a generic form and two nodes
cannot be connected to the graph if they reflect the
same node (Xie and Beerel, 2000; Li et al., 2017). The
second attempt would simply be overlooked, and
several edges between two nodes are not permitted.
An abstract class node, which often acts as an
interface for the vertex of a guided graph, keeps a
record of its descendants and predecessors.
We need to call the gds scc stream function to
configure the node projections and relationship
projections, and we have to yield the node and
community where we collect all nodes and
community returning with the size and community
node limit. See Figure 8.
Figure 8: Strongly connected components Graph.
FEMIB 2022 - 4th International Conference on Finance, Economics, Management and IT Business
82

5 CONCLUSIONS
Everyone would be able to consider, model, and
forecast complex phenomena such as the distribution
of capital or knowledge, the mechanisms through
which contagions or network failures propagate, and
the impacts on and resiliency of groups using Neo4j
graph algorithms. Since Neo4j combines analytics
and transaction operations in a native graph platform,
you will be able to explore the inner nature of real-
world processes for new discoveries and design and
execute graph-based applications quicker and with
simplified workflows. That is the strength of a well-
planned strategy.
The universe revolves around relationships.
Neo4j graph analytics shows the significance of such
relations using realistic, streamlined graph algorithms
like those described above.
ACKNOWLEDGEMENTS
This work is partly supported by VC Research (VCR
0000153).
REFERENCES
Altman, Alon and Moshe Tennenholtz. (2005). Ranking
systems: the PageRank axioms. In Proceedings of the
6th ACM conference on Electronic commerce (EC '05).
Association for Computing Machinery, New York, NY,
USA, 1–8. DOI:https://doi.org/10.1145/1064009.1064
010
Bie, Zhi, Lufeng Qian, and Jie Ren. (2020). Community
Detection Algorithm based on Node Similarity in
Signed Networks. In 2020 3rd International Conference
on Algorithms, Computing and Artificial Intelligence
(ACAI 2020). Association for Computing Machinery,
New York, NY, USA, Article 52, 1–6. DOI:
https://doi.org/10.1145/3446132.3446184
Chehreghani, M.H. (2014). "An Efficient Algorithm for
Approximate Betweenness Centrality Computation,"
The Computer Journal, vol. 57, no. 9, pp. 1371-1382,
Sept. doi: 10.1093/comjnl/bxu003.
Chen, Dongming, Wei Zhao, Xinyu Huang, Dongqi Wang,
and Yanbin Yan. (2017). Centrality-based bipartite
local community detection algorithm. In Proceedings of
the Second International Conference on Internet of
things, Data and Cloud Computing (ICC '17).
Association for Computing Machinery, New York, NY,
USA, Article 62, 1–8. DOI: https://doi.org/10.1145/
3018896.3018958
Fernandes, D. and J. Bernardino, (2018). “Graph Databases
Comparison: AllegroGraph, ArangoDB, InfiniteGraph,
Neo4J, and OrientDB.” In Proceedings of the 7th
International Conference on Data Science, Technology
and Applications (DATA 2018), pages 373-380, DOI:
10.5220/0006910203730380.
Ghosh, S. et al. (2018)."Distributed Louvain Algorithm for
Graph Community Detection," 2018 IEEE International
Parallel and Distributed Processing Symposium
(IPDPS), pp. 885-895, doi: 10.1109/IPDPS.2018.00
098.
Haojun, F., L. Duan, B. Zhang and L. Jiangzhou, (2020).
"A Collective Entity Linking Method Based on Graph
Embedding Algorithm," 5th International Conference
on Mechanical, Control and Computer Engineering
(ICMCCE), 2020, pp. 1479-1482, doi:
10.1109/ICMCCE51767.2020.00324.
Hong, S., N. C. Rodia and K. Olukotun, (2013). "On fast
parallel detection of strongly connected components
(SCC) in small-world graphs," SC '13: Proceedings of
the International Conference on High Performance
Computing, Networking, Storage and Analysis, pp. 1-
11, doi: 10.1145/2503210.2503246.
Hu, B., Li, W., Huo, X., Ye, L., Minghui, G., & Pei, P.
(2016). Improving Louvain Algorithm for Community
Detection.
Jha, A. K. and N. R. Sunitha,(2017). "Evaluation and
optimization of smart cities using betweenness
centrality," 2017 International Conference on
Algorithms, Methodology, Models and Applications in
Emerging Technologies (ICAMMAET), pp. 1-3, doi:
10.1109/ICAMMAET.2017.8186729.
Li, W. et al., "An expanded distributed algorithm for
dynamic resource allocation over strongly connected
topologies," 2017 3rd IEEE International Conference
on Control Science and Systems Engineering
(ICCSSE), 2017, pp. 500-505, doi:
10.1109/CCSSE.2017.8087983.
Liao, Q and Y. Yang, (2017). "Incremental algorithm based
on wedge sampling for estimating clustering coefficient
with MapReduce," 7 8th IEEE International
Conference on Software Engineering and Service
Science (ICSESS), 2017, pp. 700-703, doi:
10.1109/ICSESS.2017.8343010.
Meng, Xiangfeng, Yunhai Tong, Xinhai Liu, Shuai Zhao,
Xianglin Yang and Shaohua Tan, (2016). "A novel
dynamic community detection algorithm based on
modularity optimization," 7th IEEE International
Conference on Software Engineering and Service
Science (ICSESS), 2016, pp. 72-75, doi:
10.1109/ICSESS.2016.7883018.
Moon, G. E., D. Newman-Griffis, J. Kim, A. Sukumaran-
Rajam, E. Fosler-Lussier and P. Sadayappan, (2019).
"Parallel Data-Local Training for Optimizing
Word2Vec Embeddings for Word and Graph
Embeddings," 2019 IEEE/ACM Workshop on Machine
Learning in High Performance Computing
Environments (MLHPC), pp. 44-55, doi:
10.1109/MLHPC49564.2019.00010.
Neo4j Graph Database Platform. (2021a). Graph Modeling
Guidelines - Developer Guides. [online] Available at:
<https://neo4j.com/developer/guide-data-modeling/>
[Accessed 9 April 2021].
Scientific Data Analysis using Neo4j
83

Neo4j Graph Database Platform. (2021b). Strongly
Connected Components - Neo4j Graph Data Science.
[online] Available at: <https://neo4j.com/docs/graph-
data-science/current/algorithms/strongly-connected-
components/> [Accessed 8 May 2021].
Neo4j Graph Database Platform. (2021c). Node Similarity
- Neo4j Graph Data Science. Retrieved 2 May 2021,
from https://neo4j.com/docs/graph-data-science/
current/algorithms/node-similarity/.
Petersen, P. F., H. Jóhannsson and A. H. Nielsen, (2016).
"Unweighted betweenness centrality for critical fault
detection for cascading outage assessment," IEEE
International Energy Conference (ENERGYCON),
2016, pp. 1-6, doi: 10.1109/ENERGYCON.20
16.7513973.
Pokorny, Jaroslav. (2016). Conceptual and Database
Modelling of Graph Databases. In Proceedings of the
20th International Database Engineering &
Applications Symposium (IDEAS '16). Association for
Computing Machinery, New York, NY, USA, 370–
377. DOI: https://doi.org/10.1145/2938503.2938547.
Qui, Baozhi, Chenke Jia and Junyi Shen, (2006). "Local
Outlier Coefficient-Based Clustering Algorithm," 2006
6th World Congress on Intelligent Control and
Automation, pp. 5859-5862, doi: 10.1109/WCICA.20
06.1714201.
Roditty, Liam and Asaf Shapira. (2011). All-pairs shortest
paths with a sublinear additive error. ACM Trans.
Algorithms 7, 4, Article 45 (September), 12 pages.
DOI: https://doi.org/10.1145/2000807.2000813
Ryu, S. and D. Kim, "Quick Community Detection of Big
Graph Data Using Modified Louvain Algorithm," 2016
IEEE 18th International Conference on High
Performance Computing and Communications; IEEE
14th International Conference on Smart City; IEEE 2nd
International Conference on Data Science and Systems
(HPCC/SmartCity/DSS), 2016, pp. 1442-1445, doi:
10.1109/HPCC-SmartCity-DSS.2016.0205
Scarselli, Franco, Sweah Liang Yong, Marco Gori, Markus
Hagenbuchner, Ah Chung Tsoi, and Marco Maggini.
(2005). Graph Neural Networks for Ranking Web
Pages. In <i>Proceedings of the 2005 IEEE/WIC/ACM
International Conference on Web Intelligence</i>
(<i>WI '05</i>). IEEE Computer Society, USA, 666–
672. DOI:https://doi.org/10.1109/WI.2005.67
Smith, T., (2020). "Disruptive Technology", Online.
Available at: https://www.investopedia.com/terms/d/
disruptive-technology.asp (Accessed 18 September
2021)
Sun, H., W. Jie, Z. Wang, H. Wang and S. Ma, (2020).
"Network Representation Learning Guided by Partial
Community Structure," in IEEE Access, vol. 8, pp.
46665-46681, doi: 10.1109/ACCESS.2020.2978517.
Tian, C. (2010). "A kind of algorithm for page ranking
based on classified tree in search engine," 2010
International Conference on Computer Application and
System Modeling (ICCASM 2010), pp. V13-538-V13-
541, doi: 10.1109/ICCASM.2010.5622891.
Vu, J. and K. Potika, (2020). "Edge Betweenness Centrality
on Trees," 2020 Second International Conference on
Transdisciplinary AI (TransAI), pp. 104-107, doi:
10.1109/TransAI49837.2020.00023.
Wang, M. and Y. Xu, (2019). "Research on Label
Propagation Algorithms Based on Clustering
Coefficient," 2019 IEEE 4th International Conference
on Cloud Computing and Big Data Analysis
(ICCCBDA), pp. 348-352, doi:
10.1109/ICCCBDA.2019.8725739.
Xie, Aiguo and P. A. Beerel, (2000). "Implicit enumeration
of strongly connected components and an application to
formal verification," in IEEE Transactions on
Computer-Aided Design of Integrated Circuits and
Systems, vol. 19, no. 10, pp. 1225-1230, Oct. doi:
10.1109/43.875347.
Xu, Z., J. Wu, S. Zhang and S. Du, (2019). "A
Comprehensive Service Function Chainings Mapping
Algorithm Based on Betweenness Centralities," 18th
International Conference on Optical Communications
and Networks (ICOCN), 2019, pp. 1-3, doi:
10.1109/ICOCN.2019.8934384.
Zhang, Rui, Lei Li, Chongming Bao, Lihua Zhou and Bing
Kong, (2014). "The community detection algorithm
based on the node clustering coefficient and the edge
clustering coefficient," Proceeding of the 11th World
Congress on Intelligent Control and Automation, pp.
3240-3245, doi: 10.1109/WCICA.2014.7053250.
Zhou, Qian, (2011). "A recent-biased clustering algorithm
of data stream," 2011 Second International Conference
on Mechanic Automation and Control Engineering, pp.
3803-3808, doi: 10.1109/MACE.2011.5987826.
FEMIB 2022 - 4th International Conference on Finance, Economics, Management and IT Business
84
