
Process Diagnostics at Coarse-grained Levels
Mahsa Pourbafrani
a
, Firas Gharbi
b
and Wil M. P. van der Aalst
c
Chair of Process and Data Science, RWTH Aachen University, Aachen, Germany
Keywords:
Process Mining, Event Logs, Time Series Analysis, Process Diagnostics, Performance Analysis, Coarse-
Grained Process Logs, Concept Drift.
Abstract:
Process mining enables the discovery of actionable insights from event data of organizations. Process analysis
techniques typically focus on process executions at detailed, i.e., fine-grained levels, which might lead to
missed insights. For instance, the relation between the waiting time of process instances and the current states
of the process including resources workload is hidden at fine-grained level analysis. We propose an approach
for coarse-grained diagnostics of processes while decreasing user dependency and ad hoc decisions compared
to the current approaches. Our approach begins with the analysis of processes at fine-grained levels focusing
on performance and compliance and proceeds with an automated translation of processes to the time series
format, i.e., coarse-grained process logs. We exploit time series analysis techniques to uncover the underlying
patterns and potential causes and effects in processes. The evaluation using real and synthetic event logs
indicates the efficiency of our approach to discover overlooked insights at fine-grained levels.
1 INTRODUCTION
Event data in process mining are presented in the form
of event logs, in which process executions for a pro-
cess instance are captured, such as a sequence of man-
ufacturing steps with respect to time for a product in a
production line. Event logs are the primary means of
performing performance and bottleneck analysis for
enhancing/improving processes (van der Aalst, 2016).
Current performance analyses techniques in process
mining highly rely on event-based data, and they are
mainly in a detailed manner (Leemans et al., 2014;
Mannhardt et al., 2015). For instance, the effects of
resources workload on their speed is not detectable
using fine-grained event logs, i.e., detailed event logs,
and it requires daily performance metrics.
The effectiveness of projecting processes over
time is proven. Consider for example Dotted Charts
(Song and van der Aalst, 2007) that represent the ex-
isting patterns at fine-grained levels inside the pro-
cess over time. Therefore, aggregating processes w.r.t
time is a practical approach for process diagnostics.
For instance, the idea of using the sliding window for
concept drift detection in process mining is proposed
in (Bose et al., 2011). Time-related diagnostics such
a
https://orcid.org/0000-0002-7883-1627
b
https://orcid.org/0000-0001-6849-7939
c
https://orcid.org/0000-0002-0955-6940
as dotted charts or concept drift detection as well as
anomaly detections that use time series analysis are
mainly dependent on the user for defining and extract-
ing the aggregated process variables and analyzing the
results.
In this paper, we introduce a generic framework
that benefits from both fine- and coarse-grained pro-
cess analyses. The fine-grained event logs (steps are
events) are transformed into coarse-grained process
logs, i.e., a collection of measurable aspects of a pro-
cess over steps of time when steps are time windows.
All the aspects are defined and extracted systemati-
cally on top of standard event logs, as explained in
(Pourbafrani and van der Aalst, 2021). For instance,
arrival rate is an aspect that can be measured daily,
and different aspects at every time step are consid-
ered as a process state, e.g., arrival rate, waiting time,
and the number of unique resources in one day. We
define three categories of change points in process as-
pects and a module to indicate potential cause and ef-
fects among process aspects, e.g., detecting the effects
of the number of engaged resources per week on the
idle time of a single resource after three weeks. It
should be noted that throughout the paper, we refer
to event logs and diagnostics techniques utilizing the
standard event logs in which the steps are events as
fine-grained event logs, and diagnostics to stress the
distinctions in the granularity of data and approaches.
484
Pourbafrani, M., Gharbi, F. and van der Aalst, W.
Process Diagnostics at Coarse-grained Levels.
DOI: 10.5220/0011035000003179
In Proceedings of the 24th International Conference on Enterprise Information Systems (ICEIS 2022) - Volume 1, pages 484-491
ISBN: 978-989-758-569-2; ISSN: 2184-4992
Copyright
c
2022 by SCITEPRESS – Science and Technology Publications, Lda. All rights reserved

The designed synthetic event log of an insurance com-
pany (INS) and two public event logs, i.e., BPI Chal-
lenge 2017 (BPIC’17) (van Dongen, B.F., 2017) and
BPI Challenge 2015 (BPIC’15), are used for provid-
ing examples explaining the approach and performing
the evaluation.
We present the related work in Section 2 and Sec-
tion 3 covers the process mining and time series anal-
ysis concepts. We introduce our approach in Section
4 and evaluate it in Section 5. Section 6 concludes
this work with challenges and future work.
2 RELATED WORK
Presenting processes over time will reveal process be-
havior, including compliance and performance prob-
lems. Time perspective is considered for diagnos-
tics at various levels, fine- or coarse-grained lev-
els. General time-related diagnostics such as (Hornix,
2007) are at aggregated levels, where they calculate
a set of predefined KPIs, e.g., average waiting time
in processes, for the whole process. Dotted charts
are fine-grained process diagnostics techniques (Song
and van der Aalst, 2007) that depend on the user to
spot the insights over time. Time series analysis is
used in existing process behavior analysis for a vari-
ety of objectives. In (Pourbafrani et al., 2020a), we
use the time series models such as ARIMA for detect-
ing the best window size to extract process variables
for the purpose of simulation. Concept drift in pro-
cesses, their type, and the use of time series for their
detection are proposed in (Bose et al., 2011). The
concept drift detection in (Bose et al., 2011) is based
on using different periods of time inside processes.
Detecting anomalies in processes is the other pur-
pose of utilizing time series as presented by (Bez-
erra et al., 2009). Moreover, in (Pourbafrani et al.,
2020b), the relations between process aspects are dis-
covered to form a simulation model which (Adams
et al., 2021) used the same idea to detect the cause and
effect relations among process variables. The purpose
is to capture new insights using time series. Authors
in (Yeshchenko et al., 2019) propose to employ the
time series for concept drifts by applying the PELT
algorithm. The results are clustered and are visually
prepared for the user. We refer to (Sato et al., 2021)
as a survey of concept drift detection in process min-
ing. In the causal and relation detection between pro-
cess variables, multiple researchers exploited time se-
ries analyses. In (Hompes et al., 2017), cause and
effect relations between a business process character-
istics and process performance are detected. Authors
in (Adams et al., 2021) employ time series analysis
to determine the potential cause and effects between
process variables. However, similar to previous ap-
proaches, they are rather too much reliant on the user,
or the variables are extracted in an ad hoc manner.
The user domain knowledge is used to define the vari-
able, which makes the approach process specific.
Fine- and coarse-grained analyses are required to
detect process behavior. As a result, there is a gap
in providing an integrated and general framework for
defining and extracting process measurable aspects
while also having a comprehensive approach for ap-
plying time series analysis to processes. By increas-
ing the granularity of process event data, we can rep-
resent a process from various perspectives using its
aspects over time, as presented in (Pourbafrani and
van der Aalst, 2021) and implemented in (Pourbafrani
and van der Aalst, 2020).
3 PRELIMINARIES
In this section, we define coarse-grained process logs
and introduce time series concepts used in our ap-
proach.
Process Mining.
Definition 1 (Event Log). An event e=(c, a, r, t
s
,t
c
),
where c∈C is the case identifier, a∈A is the activ-
ity in e, r∈R is the resource, t
s
∈T is the start time,
and t
c
∈T is the complete time of the event e. ξ=C ×
A × R × T × T is the universe of events. We de-
fine projection functions for e as follows: π
C
: ξ → C ,
π
A
: ξ → A, π
R
: ξ → R , π
T
S
: ξ→T and π
T
C
: ξ→T .
Event log L⊆ξ is a set of events in which events are
unique.
The start and complete timestamps of an event
log L⊆ξ, are obtained using p
s
and p
c
, respec-
tively. p
s
(L)=min
e∈L
π
T
S
(e) and p
c
(L) = max
e∈L
π
T
C
(e).
A sequence of events w.r.t. timestamp with the
same case identifier represents a process instance,
i.e., a trace. In the event log of a production line,
the first event e=(c, a, r,t
s
,t
c
) is for the first item
with c=1, the activity is a=welding which was
started at timestamp t
s
=08:30:25 02.01.2021 by re-
source r=employee1 and was completed at times-
tamp t
c
=10:02:47 02.01.2021.
Coarse-grained Process Logs. Coarse-grained
process logs are the collections of measurable aspects
of a process over a specific time window, e.g., Table 1
shows a sample coarse-grained log. The time window
is δ=1 day. Each column describes the process in a
time step (process state), e.g., 1 day, and each row
Process Diagnostics at Coarse-grained Levels
485
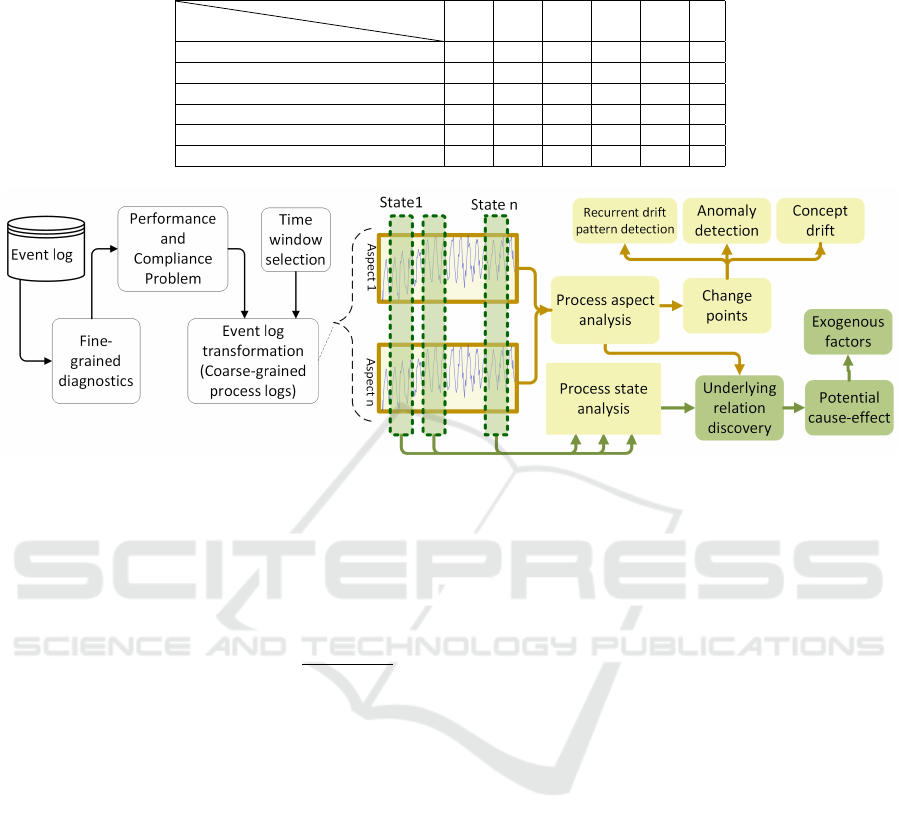
Table 1: A sample coarse-grained process log in which the time window is one day. It includes six process aspects that values
are represented in the cells.
Process aspects
Time window (day)
1 2 3 4 5 6
Arrival rate 180 147 160 116 94 ...
Finish rate 180 147 160 116 94 ...
Num of unique resources 6 6 6 6 6 ...
Avg service time 0.35 0.41 0.40 0.44 0.52 ...
Avg time in process 0.96 0.95 0.99 0.93 0.82 ...
Avg waiting time 0.60 0.54 0.59 0.49 0.32 ...
Figure 1: The proposed coarse-grained process diagnostic framework and the main modules.
is a process aspect. Cells are the values of process
aspects, e.g., at the second time window, the value of
process aspects Arrival rate is 147, which means in
this time window, 147 cases arrived.
Definition 2 (Coarse-Grained Process Log). Let L ⊆
ξ be an event log, V be a set of process aspects, δ∈N
be the selected time window, and k=d
(p
c
(L)−p
s
(L))
δ
e be
the number of time steps in the event log w.r.t. δ.
The coarse-grained process log of given L and δ is
PL
L,δ
:{1, ..., k}×V → R
≥0
, such that PL
L,δ
(i, v) rep-
resents the value of aspect v∈V in the i
th
-time win-
dow (1≤i≤k).
We use PL throughout the paper instead of PL
L,δ
when it is clear from the context. We also de-
fine Π
v
(PL)∈R
∗
to return the sequence of values
hx
1
, ..., x
k
i for aspect v∈V . To access each value of
the process aspect over time, we define π
i
that returns
the i
th
value in a sequence, i.e., π
i
(Π
v
(PL))=x
i
.
Time Series. The analysis of sequences of real val-
ues and/or sequences of tuples of real values is often
referred to as time series analysis (Hamilton, 1994).
Pattern detection, next value prediction, or relation
detection are the examples of time series analysis.
Given a time series σ=hx
1
, ..., x
k
i∈R
∗
with length of
k ∈ N, i.e., |σ|=k, S ∈ R
∗
is a subsequence of con-
tinuous values of σ with lengths m ≤ k. For instance,
S=hx
i
, x
i+1
, ..., x
i+m−1
i is a subsequence of σ where
1 ≤ i ≤ k − m + 1.
Consider the given example in Table 1 as PL,
where Finish rate is process aspect v. Apply-
ing function Π
v
(PL) results in a time series, i.e.,
Π
v
(PL)=h180, 147, 160, 116, ...i where h180, 147i is
a subsequence of that.
4 APPROACH
Figure 1 presents the introduced coarse-grained pro-
cess diagnostics approach. First, in Section 4.1, the
existing process mining techniques are applied to
event logs. Given the results, e.g., a specific activity
or a set of resources, and the time window, coarse-
grained process logs including process aspects and
states are generated, e.g., times series presenting the
process. Afterward, in Section 4.2, we explain the
techniques designed for process diagnostics given the
process logs. Considering multiple aspects in a simi-
lar window of time in relation to each other provides
the process states analysis. Discovering the relation-
ship between different aspects over time is the pur-
pose of process state diagnostics.
4.1 Fine-grained Diagnostics
We defined and implemented the problem detection
techniques w.r.t. deviation and performance, where it
can be considered for activity flow, resources, and or-
ganizations. These problems are identified based on
ICEIS 2022 - 24th International Conference on Enterprise Information Systems
486
Time Window (Day)
Arrival Rate (INS)
Process Aspect
Change Point
Detection
Subsequence
Clustering
Regular Pattern
Anomaly
Concept Drift
Figure 2: The overview of our process aspect analysis for the arrival rate of activity Review request for rejection in the INS
event log.
performance and bottleneck analysis, deviation detec-
tion, or social network analyses. We form the prob-
lematic part of the process in the form of a set of
activities A, resources R, or cases C. Note that or-
ganizations with performance and compliance issues
can be shown as a set of resources. Consider that in
event log L, bottleneck analysis as one of the fine-
grained diagnostics returns activity a as a process bot-
tleneck, i.e., long execution time. Therefore, A = {a},
R = {π
r
(e) ∈ R |e ∈ L}, and C = {π
C
(e) ∈ R |e ∈ L}.
Another example can be the detected role, which is
the set of resources performing activity a as a po-
tential bottleneck in the process using social network
analysis.
In the event log transformation step, in Fig. 1,
event logs are projected using the provided sets of
resources, activities and cases. For instance, for
event log L, the projected event log is L
0
= {e ∈
L|π
A
(e)=a ∧ π
R
(e) ∈ R ∧ π
C
(e) ∈ C}. The coarse-
grained process logs are created for the time window
δ=1 day by using PL
L
0
,δ
in Definition 2. The descrip-
tion of defining and extracting all possible aspects of
the process over time is derived from (Pourbafrani and
van der Aalst, 2021).
4.2 Diagnostics in a Process Aspect
By focusing on a single aspect of a process with
event log L over time in the generated PL, e.g.,
Π
arrival rate
(PL), we are able to identify the existing
change points. Given the fact that we are looking
for the behavior of process aspects over time, there
are three types of change points that we are inter-
ested in discovering: regular patterns (recurrent con-
cept drifts), anomaly behavior, and concept drifts. To
do so, we define the change point detection function
in Definition 3, where the input is a process aspect and
the output is change points in the values over time.
In the implementation, we used Pruned Exact Lin-
ear Time Method (PELT) since it has a linear com-
putational time. PELT detects change points by re-
cursively splitting the time series into subsequences
(Killick et al., 2012).
Definition 3 (Change Point Detection). Function
CPD : R
∗
→ N
∗
such that for σ=hx
1
, x
2
, ..., x
k
i∈R
∗
if CPD(σ)=hτ
1
, ..., τ
m
i∈N
∗
then for all 1 ≤ j ≤ m,
1 < τ
j
< τ
j+1
< k.
Figure 2 depicts the general steps of the process
aspect analysis module in our approach, as exem-
plified by the values of the daily arrival rate for
activity review request for rejection in an insurance
company’s generated synthetic event log (INS). The
activity is identified as a deviation in the fine-grained
diagnostic module, i.e., a low fitness value. Func-
tion CPD(Π
arrival rate
(PL))=h43, 65, ...i, returns 10
change points. Given the detected change points for
process aspects, the corresponding subsequences are
generated. For instance, in Fig. 2, Π
arrival rate
(PL)
is transformed into 11 subsequences, e.g., s
1
=
hπ
1
(Π
arrival rate
(PL)), ..., π
43
(Π
arrival rate
(PL))i, and
s
2
= hπ
44
(Π
arrival rate
(PL)), ..., π
65
(Π
arrival rate
(PL))i.
We refer to the set of corresponding subsequences of
a process aspect as S
(CPD(σ))
.
The ultimate goal in single process aspect analysis
is to discover aspects’ behavior over time. Having the
subsequences of an aspect, we investigate the similar-
ities of these subsequences to find whether there is re-
current concept drift, anomaly, or concept drift in the
process. To do so, we cluster these subsequences us-
ing the defined function in Definition 4. To implement
Process Diagnostics at Coarse-grained Levels
487

the module, our technique is based on (Niennattrakul
and Ratanamahatana, 2007). Since our clustering is
based on k-means, the silhouette metric (Shahapure
and Nicholas, 2020) is used for automatic selection
of k. For other potential clustering techniques of time
series, we refer to (Warren Liao, 2005).
Definition 4 (Subsequence Clustering). Let
σ=hx
1
, x
2
, ..., x
k
i∈R
k
be a time series, CPD(σ)
be the detected change points, and S
CPD(σ)
be the set
of the subsequences of σ w.r.t. change points. We
define function C S(S
CPD(σ)
) ⊆ 2
S
CPD(σ)
such that it
returns the set of clusters including the subsequences
inside.
In Fig. 2, for the set of subsequence
S
CPD(Π
arrival rate
(PL))
, the output of function sub-
sequence clustering CS is presented. There are 3
clusters, where s
4
, s
7
, and s
9
belong to one cluster,
and s
2
belongs to a second cluster. Afterward, the
detected behaviors using the change points and
clustering results are categorized such that:
• Regular Pattern (Recurrent Concept Drift): when
a cluster has at least two subsequences that
are not consecutive, there is a potential for
regular patterns in the aspect. For cluster
C={s
1
=hx
i
, ..x
j
i, s
2
=hx
p
, ..., x
q
i}, and p 6= j + 1,
i.e., s
1
and s
2
are not consecutive. Note that if
there is a period of time between every two sub-
sequences in the cluster that does not match them,
then, there is a regular pattern in the data. For in-
stance, cluster 0 and 1 in Fig. 2 represent regular
patterns that appear over time in the arrival rate.
• Anomaly: when a cluster has only one subse-
quence and the aspect has more than one subse-
quence, the time duration in the cluster is a poten-
tial anomaly. For cluster C = {s
1
=hx
i
, ..x
j
i}, s
1
indicates an anomaly in the period of time steps i
until j. For instance, cluster 2 in Fig. 2 is a de-
tected period of an anomaly.
• Concept Drift: a cluster with consecutive se-
quences is a concept drift. For instance, C =
{s
1
=hx
i
, ..x
j
i, s
2
=hx
j+1
, ..., x
p
i}, then, s
1
and s
2
are matches and directly following each other over
time, therefore, x
i
shows a concept drift at time
step i. Note that an aspect with two subsequences,
i.e., one change point, and two clusters is also con-
sidered as a potential concept drift.
4.3 Diagnostics in Process States
In addition to analyzing the behavior of a single as-
pect of a process, the relationships between process
aspects provide an insight into the states of the pro-
cess through time. Performing diagnostics for process
states among the process aspects is able to reveal the
potential effects of other aspects on the identified be-
havior of a single aspect. The extracted process states
are in the form of Multivariate Time Series, therefore,
techniques such as Multivariate Time Series Analysis
and Granger Causality are applicable.
Analyzing whether the previous/current values
of a variable plays a role in the future values of
other variable is performed using Granger Causality
(Granger, 1988). Considering both linear and non-
linear Granger Causality, we define relation detection
function as Definition 5. The output of this function
only indicates whether there is a relation between the
current/previous values of the first process aspect and
the future values of the second process aspects.
Definition 5 (Cause and Effect Relation). Let
σ
1
, σ
2
∈ R
k
, and k ∈ N, function GC : R
k
× R
k
→
{R
k
× R
k
× N, 0}. For two time series, the func-
tion returns whether one of the time series causes
on the other one with the shift in time, i.e.,
GC(σ
1
, σ
2
)=(σ
2
, σ
1
, 2) represents that the values of
aspect σ
2
in each time window has effects on the next
value of σ
1
in the next two time windows.
For a detected bottleneck in WValidateApplica-
tion in BPI Challenge 2017 (L) with δ=1 week,
process aspects including the number of cases in
process per week (v
1
), and the number of unique
engaged resources (v
2
) per week are extracted.
GC(Π
v
1
(PL), Π
v
2
(PL))=(Π
v
2
(PL), Π
v
1
(PL), 1) indi-
cates that the change in the number of cases in the
process per week causes a drift in the number of en-
gaged resources per week within 1 time step as pre-
sented in Fig. 3.
4.3.1 Exogenous Aspects
The developed cause and effect module determines
the potential effects of aspects on the value of each
other over time. We refer to the process aspects
that are not affected by any of the aspects as exoge-
nous aspects. Consider v=arrival rate, we identify it
as an exogenous aspect if ∀v
i
∈ V , Corr(v
i
, v)=0 ∧
GC(v
i
, v)=0, where Corr is the correlation among
two aspects, and GC is the cause and effect function.
In processes, the exogenous factors are generally ig-
nored. The influence of the environment and aspects
that can (or cannot) be adjusted during the process is
a determining factor in process improvement and pre-
dictive process monitoring.
ICEIS 2022 - 24th International Conference on Enterprise Information Systems
488
Time Window (Week)Time Window (Week)
Number of Cases in the Process (BPIC’17) Number of Engaged Resources (BPIC’17)
Figure 3: The change point in the number of engaged resources for activity WValidateApplication in BPIC’17 depends on the
anomaly in the number of cases in process, i.e., after one week.
Figure 4: Two aspects for activity WValidateApplication as a detected bottleneck in BPIC’17.
Avg
Duration
(Week)
Num of Engaged Resources (Week)
Figure 5: Revealed relations Fig. 4 using shifted time win-
dow of two aspects.
5 EVALUATION
To assess our approach, we used real and public event
logs such as BPI Challenge 2017 (BPIC’17), BPI
Challenge 2015 (BPIC’15), and a synthetic event log
of an insurance company (INS) generated using the
simulation tool in (Pouarbafrani et al., 2021). We be-
gin by identifying and applying performance, com-
pliance, and social network techniques to event logs.
The results show that the approach is able to identify
the patterns inside processes including the potential
cause and effect relations among process aspects with
time lags and without the user domain knowledge.
Activity WValidateApplication in BPIC’17 is detected
as a bottleneck, hence we extracted all the process as-
pects w.r.t. that activity. As shown in Fig. 4, no re-
lation can be found at the same time window. How-
ever, using our approach, we find the potential cause
and effect relations between the number of unique re-
sources per week and the average duration of the ac-
tivity with a shifted time window automatically, i.e.,
after 4 weeks, see, Fig. 5.
It should be noted that the size of the time win-
dow used to extract values of process aspects is criti-
cal in detecting process behavior. Given that we apply
a time window selection module presented in (Pour-
bafrani et al., 2020a), the approach may determine the
time window size in which the aspects have more sta-
ble behavior, such as stationary time series. However,
this does not imply that other window sizes do not
provide insights and information. For example, there
could be a pattern in the process daily arrival rate as
well as different patterns in the weekly arrival rate.
As a result, these various insights resulting from the
different time windows should be taken into account.
Process Diagnostics at Coarse-grained Levels
489

Time Window (Day)Time Window (Week)
Number of Cases in the Process (BPIC’15)
Figure 6: The number of cases in the process per day (right), and week (left) for BPIC’15. The detected patterns, change
points and general behavior of event logs are affected by the size of time window to generate coarse-grained process logs.
We take the BPIC’15 event log as an example, where
different patterns in weekly and daily values of pro-
cess aspect the number of cases in the process can be
seen. The different insights include different change
points followed by different detected behavior, as pre-
sented in Fig. 6.
All the steps including the fine-grained process
diagnostics, coarse-grained process logs generation,
and coarse-grained analysis are integrated into one
publicly available tool
1
. We also provided the used
data sets, techniques, and evaluation results.
6 CONCLUSION
One of the primary goals of process mining is to pro-
vide process diagnostics that can be used to enhance
processes. We designed a new and generic diagnos-
tic approach in this paper. The approach unifies fine-
and coarse-grained analysis by increasing the time
granularity of event logs. Our approach overcomes
the limitation of current techniques in extracting pro-
cess variables from event logs, as well as selecting the
time window for analysis, such as concept drift detec-
tion. We detect change points in process aspects and
propose the potential causes. Process state analysis
includes relation detection between process aspects
across time. Distinguishing between the types of con-
cept drifts, e.g., sudden drift or gradual drift, is one
of the challenges and open problems for future work.
Furthermore, the discovered insights in the proposed
framework allow for future analysis, e.g., prediction
and what-if analysis.
1
https://github.com/mbafrani/PMSD
ACKNOWLEDGEMENTS
Funded by the Deutsche Forschungsgemeinschaft
(DFG, German Research Foundation) under Ger-
many’s Excellence Strategy-EXC-2023 Internet of
Production-390621612. We also thank the Alexan-
der von Humboldt (AvH) Stiftung for supporting our
research.
REFERENCES
Adams, J. N., van Zelst, S. J., Quack, L., Hausmann, K.,
van der Aalst, W. M. P., and Rose, T. (2021). A frame-
work for explainable concept drift detection in process
mining. In Business Process Management, pages 400–
416.
Bezerra, F., Wainer, J., and van der Aalst, W. M. P. (2009).
Anomaly detection using process mining. volume 29
LNBIP of Lecture Notes in Business Information Pro-
cessing, pages 149–161.
Bose, R. P. J. C., van der Aalst, W. M. P.,
ˇ
Zliobait
˙
e, I.,
and Pechenizkiy, M. (2011). Handling concept drift
in process mining. In Mouratidis, H. and Rolland, C.,
editors, Advanced Information Systems Engineering,
pages 391–405.
Granger, C. (1988). Some recent development in a concept
of causality. Journal of Econometrics, 39(1):199–211.
Hamilton, J. D. (1994). Time series analysis, volume 2.
Princeton New Jersey.
Hompes, B. F., Maaradji, A., La Rosa, M., Dumas, M.,
Buijs, J. C., and van der Aalst, W. M. P. (2017). Dis-
covering causal factors explaining business process
performance variation. In CAISE, pages 177–192.
Springer.
Hornix, P. T. (2007). Performance analysis of business pro-
cesses through process mining.
Killick, R., Fearnhead, P., and Eckley, I. A. (2012). Optimal
detection of changepoints with a linear computational
ICEIS 2022 - 24th International Conference on Enterprise Information Systems
490

cost. Journal of the American Statistical Association,
107(500):1590–1598.
Leemans, S. J. J., Fahland, D., and van der Aalst, W. M. P.
(2014). Process and deviation exploration with induc-
tive visual miner. In Proceedings of the BPM Demo
Sessions 2014 Co-located with the 12th International
Conference on Business Process Management (BPM
2014),, page 46.
Mannhardt, F., de Leoni, M., and Reijers, H. A. (2015). The
multi-perspective process explorer. In Proceedings of
the BPM Demo Session 2015, pages 130–134.
Niennattrakul, V. and Ratanamahatana, C. (2007). On clus-
tering multimedia time series data using k-means and
dynamic time warping. pages 733–738.
Pouarbafrani, M., Balyan, S., Ahmed, M., Chugh, S., and
van der Aalst, W. M. (2021). Gencpn:automatic cpn
model generation of processes. In 3rd International
Conference ICPM 2021, Proceedings (Demo Track).
Pourbafrani, M. and van der Aalst, W. M. P. (2020). PMSD:
data-driven simulation using system dynamics and
process mining. In BPM Demo, pages 77–81.
Pourbafrani, M. and van der Aalst, W. M. P. (2021). Extract-
ing process features from event logs to learn coarse-
grained simulation models. In CAiSE, volume 12751
of Lecture Notes in Computer Science, pages 125–
140. Springer.
Pourbafrani, M., van Zelst, S. J., and van der Aalst, W. M. P.
(2020a). Semi-automated time-granularity detection
for data-driven simulation using process mining and
system dynamics. In ER, pages 77–91.
Pourbafrani, M., van Zelst, S. J., and van der Aalst, W.
M. P. (2020b). Supporting automatic system dynam-
ics model generation for simulation in the context of
process mining. In BIS, pages 249–263.
Sato, D. M. V., De Freitas, S. C., Barddal, J. P., and Scal-
abrin, E. E. (2021). A survey on concept drift in
process mining. ACM Computing Surveys (CSUR),
54(9):1–38.
Shahapure, K. R. and Nicholas, C. (2020). Cluster quality
analysis using silhouette score. In DSAA, pages 747–
748. IEEE.
Song, M. and van der Aalst, W. M. P. (2007). Support-
ing process mining by showing events at a glance. In
WITS 2007, pages 139–145.
van der Aalst, W. M. P. (2016). Process Mining - Data
Science in Action, Second Edition. Springer.
van Dongen, B.F. (2017). BPIC 2017. Eindhoven Univer-
sity of Technology.
Warren Liao, T. (2005). Clustering of time series data—a
survey. Pattern Recognition, 38(11):1857–1874.
Yeshchenko, A., Di Ciccio, C., Mendling, J., and
Polyvyanyy, A. (2019). Comprehensive process drift
detection with visual analytics. In ER, pages 119–135.
Springer.
Process Diagnostics at Coarse-grained Levels
491
