
Beyond Viewing Counts, Likes & Co: An Analysis of Instructional
Videos on Youtube
Miriam Mulders and Johannes Wendt
Learning Lab, Universit
¨
at Duisburg-Essen, Essen, Germany
Keywords:
Instructional Video, Explanatory Video, Youtube, Learning Analytics.
Abstract:
The aim of this study is to open up criteria of instructional videos through a search of the scientific literature.
Shoufan (2019) tested the Video Cognitive Value (VCV) of instructional videos as a function of cognitive and
other characteristics. Here, the VCV is formed from the likes and viewing counts. Based on Shoufan’s results,
the present study aims to answer the following two research questions: 1. Can comparable correlations be
reproduced for instructional videos from another subject area? 2. Can the correlations be further explained
by criteria regarding the instructional design? For this purpose, 100 videos using the YouTube API were
collected. Multiple linear regression analyses were performed. However, only 9% could be explained by
cognitive characteristics and 5% by instructional design criteria of the total variance in VCV. The recent study
could not reproduce Shoufan’s results and supplementary criteria could not explain further data variance.
With regard to the literature, criteria such as likes and viewing counts cannot describe the instructional quality
ratings of instructional videos. More promising approaches to evaluate quality perception of instructional
videos (e.g., comments) are mentioned.
1 INTRODUCTION
YouTube, Vimeo, and Dailymotion are online video
repositories in which videos are made available.
Users can view, review and share video clips on an
extensive variety of content which includes film clips,
television shows, music, instructional videos, vlogs
or videoblogs, as well as amateur videos. The in-
structional potential of video technology is promis-
ing. Sundar Pichar reported that in 2020 77% used
YouTube to learn a new skill (Alphabet Investor Re-
lations, 2021). It is, therefore, crucial to ask which
evaluation criteria can help to characterize a ”good”
instructional video. This is challenging due to the
fact, that every subscribed member can upload videos.
This feature has led to an apparent redundancy in
content as well as significant quality differences be-
tween videos. Thus, finding a high-quality instruc-
tional video can be challenging. Both, the available
filters that can be applied while searching for a video
and the offered sorting criteria seem to be less helpful
in finding instructional videos with the desired qual-
ity. Research regarding the quality ratings of instruc-
tional videos is still missing. In contrast to other so-
cial media technologies, such as Facebook, Youtube
seems to be an under-researched platform in research
on educational technologies (Khan, 20217).
A recent study by Shoufan (2019) investigated
105 YouTube videos using Learning Analytics (Long
and Siemens, 2011) related to computer science ed-
ucation and the topic of digital logic design. In this
study, the author tries to analyze possible correla-
tions between descriptive (e.g., likes, dislikes, view-
ing counts) and contentwise (e.g., production style)
characteristics. In doing so, Shoufan relies on the cog-
nitive theory of multimedia learning (Mayer, 2005) to
derive factors that favor a positive perception of an
instructional video. The present study addresses to
1. reproduce and test Shoufan’s model within another
subject area (public health instead of digital logic de-
sign), 2. derive further factors that explain a certain
amount of the total variance of instructional video
quality, and 3. critically review the current state of
methodology research regarding the quality percep-
tion of instructional videos.
2 RELATED WORK
It is crucial to identify and specify the factors that
contribute to the quality perception of instructional
videos. Determining such factors is the first step to-
236
Mulders, M. and Wendt, J.
Beyond Viewing Counts, Likes Co: An Analysis of Instructional Videos on Youtube.
DOI: 10.5220/0011032800003182
In Proceedings of the 14th International Conference on Computer Supported Education (CSEDU 2022) - Volume 1, pages 236-241
ISBN: 978-989-758-562-3; ISSN: 2184-5026
Copyright
c
2022 by SCITEPRESS – Science and Technology Publications, Lda. All rights reserved

wards an aware production or selection of videos that
support learning. Concerning this matter, Papamit-
siou and Economides (2014) identified the organiza-
tion and recommendation of educational resources as
one of the significant, yet not sufficiently handled is-
sues in the learning analytics and educational data
mining research. This, specifying the quality fea-
tures of instructional videos is an urgent requirement
to support video producers, platform providers, and
instructors.
Shoufan (2019) investigated the relationship be-
tween the quality of an instructional video and how
many likes, dislikes, and views the video received.
Therefore, Shoufan developed a formula for the qual-
ity rating of an instructional video based on the num-
ber of likes, dislikes, and views. Shoufan calls this
function the Video Cognitive Value (VCV). Shoufan
identified ten different cognitive features proposed in
the cognitive theory of multimedia learning (Mayer,
2005) to significantly explain the variance of the VCV
(e.g., principles of modality, pretraining, signaling,
embodiment). Only four features (e.g., modality, spa-
tial contiguity) were significant, even if the regres-
sion model was generally suitable to predict the VCV
with an adjusted R-square value of 63%. Moreover,
Shoufan found general features regarding production
style (e.g., slide presentation style, talking speed)
to affect the VCV. These results suggest that cogni-
tive features are highly important for the VCV. How-
ever, more research is required to identify and specify
other cognitive and non-cognitive features that affect
VCV and improve the predictive models. Therefore,
the authors add instructional features. Kulgemeyer
(2018) formulates 13 criteria of successful instruc-
tional videos. These include coherence, adaption to
prior knowledge, prompts, summaries, learning tasks,
and examples.
Shoufan mentioned the limitations of his chosen
subject area: ”This raises the question whether the re-
sults can be applied to other subjects. Future stud-
ies should answer this question.” (Shoufan, 2019, p.
457). Therefore, the present study aim to verify his
results within an own investigation. The following re-
search question arises here:
RQ1: Can the relationships observed by Shoufan
(2019) between VCV and cognitive features also be
confirmed within instructional videos from another
subject area (public health)?
A second comment by Shoufan was that ”The
study of instructional explanations can be of high
relevance to the analytics of educational video be-
cause the explanation is typically the sole instruc-
tional method in such videos.” (Shoufan, 2019, p.
458). For this purpose, the guidelines by Kulge-
meyer (2018) were added, which has already been
used to examine the explanatory quality of instruc-
tional videos for physics classes.
RQ2: Is it possible to find correlations between
the features of instructional design of instructional
videos and the data variance of the VCV?
3 MATERIAL AND METHODS
The procedure of the study up to the final evaluation
can be divided into four sub-steps: pre-selection, col-
lection, assessment, and evaluation.
For the pre-selection of the videos, a catalogue of
search terms related to topics from public health was
created. For this purpose, a topic overview of public
health was collected (Schwartz et al., 2012; Leopold-
ina et al., 2015; Kahane et al., 2021; Thurston, 2014)
and compared with the GEDA study of the Robert
Koch Institute (Heidemann et al., 2021) for typical
disease patterns in Germany. Added to this, list-
ings, such as those of the health insurance companies
(Czysz, 2021), and supplementary figures (Bernickel,
2020) were used to generate a random sample of typi-
cal disease patterns in Germany. Based on these stud-
ies, the authors focused on 1. non-communicable dis-
ease types regarding mind, disorders, digestion, mus-
culature, and skeleton, and 2. communicable dis-
eases, for which respiratory diseases were selected as
a sample. An exception are the search queries on ”as-
sisted suicide” and ”loneliness”, which are exemplary
for current (Wojtek, 2020) and future tasks (Giffey,
2021) of public health policy. Table 1 shows the final
topics and video numbers of the research sample.
Table 1: Selected topics and their frequency.
Subject area of the instructional videos Count
Depression 7
Diabetes 21
Loneliness 3
Joint and back pain 12
Healthy diet 11
Influenza 11
Psychosis 16
Stroke 15
Assisted suicide 4
The technical basis of the survey uses the
YouTube Data API to search for videos with defined
parameters and listing the metadata of the videos
searched for. Python was used as the programming
language for the query and the initial processing of
the data. The code was written in such a way that one
search query resulted in up to 50 videos, preferably in
Beyond Viewing Counts, Likes Co: An Analysis of Instructional Videos on Youtube
237

German language. The video lists collected this way
were transferred as entries to a dictionary (video title,
video ID, channel title, and video category). For each
of the videos, the required metadata was queried in a
loop with its specific VideoID, i.e., number of views,
(dis)likes, number of comments, and duration. With
the help of the module Pandas, a data frame was gen-
erated as well as sorted, the numerical entries were
converted, and the empty columns with the categories
and a clickable link to the video were added. Follow-
ing this, the data frame was exported as a spreadsheet
ready for the video rating.
1
For the video evaluation, only videos between one
and 60 minutes were examined, only videos in Ger-
man language were included and the format had to be
a strictly instructional video. The survey and evalu-
ation took place between August and October 2021.
The videos were viewed individually and the charac-
teristics were checked to see if they applied. For this
purpose, a guideline of the criteria was created as de-
scribed by Shoufan (2019) and Kulgemeyer (2018).
The automatically generated transcripts were used to
calculate the words per minute. If none were avail-
able, a transcript was created for a one-minute section
and extrapolated to the total duration. All inputs were
recorded in the table. The rated videos were merged
after a target sample of 100 was reached. For evalua-
tion, the table was then processed with SPSS and the
results were analysed.
4 RESULTS
In the survey, a total of 100 videos with a total dura-
tion of over 15 hours (15:05:43) were evaluated. All
videos analysed were in German language and cov-
ered nine topics, e.g., diabetes (highest sample N =
21) or loneliness (lowest sample N = 3). Follow-
ing Shoufan’s methodology, the videos were divided
into different production styles. The most common
style was talking head (N = 48) and mixed styles
(N = 25), mostly supplementing slides or animations.
Khan style videos were not represented at all. The
average video length was about nine minutes, which
is also close to the results of other studies (Erdem
and Sisik, 2018; Cetin, 2021) For the topics surveyed
here, the total of all video views is 21,409,114, the
likes 474,254 and the dislikes 9,958.
Shoufan (2019) generated the Video Cognitive
Value (VCV) from the number of Likes (N
L
) with his
defined coefficient Cognitive Weight of Likes (W
L
) and
1
The code and the searchstring will be made available
on request.
the number of views (N
V
). The formula is:
VCV =
W
L
∗ N
L
N
V
∗ 10
4
Including the dislikes was dropped due to the asym-
metrical distribution of likes to dislikes. For this pur-
pose, a so-called engagement ratio of likes and dis-
likes was calculated by dividing each by the sum of
all views. The average engagement ratio for likes was
E
L
= 0.02215, for dislikes E
D
= 0.00047. The fac-
tor discernible from this for the asymmetry in likes
and dislikes described by (Shoufan, 2019) was there-
fore A =
E
L
E
D
=
∑
N
L
∑
N
D
. The present study gained values
from A = 47.127 to 47.625, thus corresponds to a fac-
tor for asymmetric commitment of ”A > 47” which
is significantly higher than the factor observed by
Shoufan (A > 20). Shoufan states that further research
is needed on this aspect in order to include the ”hidden
likers and dislikers” in the calculation and to improve
the assessment of these. Nevertheless, the Cognitive
Weight of Likes (W
L
= 0.733) is used as a coefficient
for the formula. Unfortunately, the exact derivation of
the value is not made clear, just that it is based on a
survey Shoufan conducted. For the present study, the
value was therefore applied exactly.
In order to follow up on the observations made
by Shoufan (2019), the videos selected in the present
study were analysed in five tests, adding the criteria
by Kulgemeyer (2018).
In the first test, the ten cognitive traits mentioned
by Shoufan (2019) were examined. This multiple lin-
ear regression analysis revealed that only 10% (ad-
justed R-Square = .099) of the data variance of the
VCV could be explained. In contrast, Shoufan (2019)
was able to explain 63% of the data variance by cog-
nitive traits. In the present study, personalization
(t = 2.403, p > .01), signalling (t = −1.699, p < .10),
and embodiment (t = 1.686, p < .10) proved to be
significant, even if only slightly.
In the second test, we examined production styles.
Only 5% (adjusted R-Square = .055) of the data
variance could be explained. None of the produc-
tion styles proved to be significant. Shoufan (2019),
on the other hand, was able to explain 56% of
the VCV, mainly through the production styles pa-
per/whiteboard, slides, and Khan.
In the third test, the four additional character-
istics, i.e., video length, speaking rate, gender and
mother tongue were tested. The authros found that
17% (adjusted R-Square = .170) of the data vari-
ance could be explained. The significant values were
gender (t = −2.685, p < .01). and mother tongue
(t = −3.861, p < .001). Shoufan (2019) reached to
59% and was able to significantly explain this value
CSEDU 2022 - 14th International Conference on Computer Supported Education
238
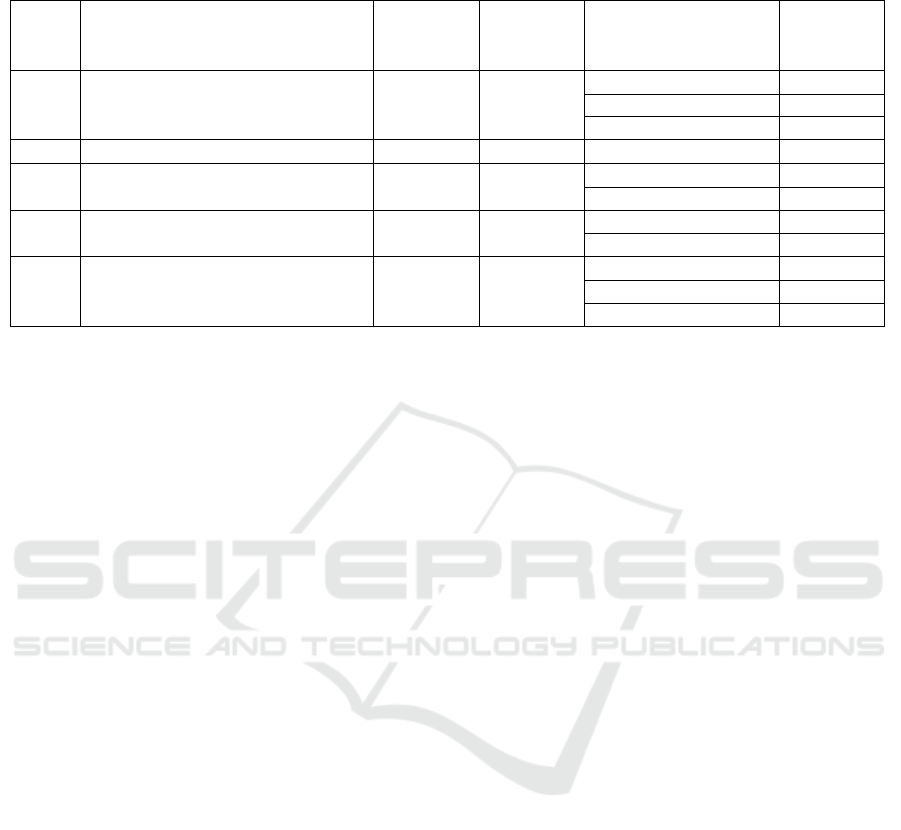
Table 2: Results of the regression analyses: VCV as a function of cognitive features and criteria of effective instructional
videos.
Test Predictor Variables
Adjusted
R-Square
Standard
Error of
Estimates
Significant Variables
Regression
Coeffi-
cients
1 Cognitive features 9.9% 97.9
Person*** 73.6
Signal* -62.4
Embodiment* 68.7
2 Video production style 5.5% 100.2 - -
3
Video length and speed, speaker
gender and native language
17% 94.0
Gender*** -60.2
Native***** -169.4
4
Effective explanation videos
features
5.6% 100.3
DirectAd** 55.1
Prompts** 41.6
5
All significant features from
previous tests
21.6% 91.3
Gender** -50.8
Native***** -142.5
Prompts** 44.7
∗
: p-value < 0.1,
∗∗
: p-value < 0.05,
∗∗∗
: p-value < 0.01,
∗∗∗∗
: p-value < 0.005,
∗∗∗∗∗
: p-value < 0.001
Note. DirectAd = Direct Adressing of Learners.
by the characteristics of speech tempo and mother
tongue.
In the fourth test, which is complementary to the
study by Shoufan (2019), the 14 criteria of effective
explanation videos by Kulgemeyer (2018) were anal-
ysed. As a result, the authors obtained an adjusted
R-Square of .056, i.e., more than 5%. The criteria
with low significance were addressing the addressee
directly (t = 2.377, p < .05) and giving prompts on
relevant content (t = 2.282, p < .05).
In the final test, the authors integrated all signifi-
cant values. It could explain more than 21% (adjusted
R-Square = .216) of the data scatter for the VCV. The
significant criteria were gender (t = −2.267, p < .05),
mother tongue (t = −3.182, p < .005) and prompts
(t = 2.282, p < .05). Table 2 provides an overview of
the results.
5 DISCUSSION
The present study failed to find the correlations be-
tween the cognitive traits proposed in the cognitive
theory of multimedia learning (Mayer, 2005) and
VCV postulated by Shoufan (2019). While up to
63% of the data variance of VCV was explained in
Shoufan (2019), the regression analyses of the present
study yielded few to barely significant results. Less
the cognitive traits, but other characteristics such as
gender and native language could significantly reveal
variance. Formal differences between the studied sub-
ject areas could be responsible for this. The topic of
public health addresses a different target group with
different characteristics (e.g., prior knowledge, mo-
tives), which significantly influences rating behavior
and thus VCV.
The authors also failed to use instructional param-
eters (Kulgemeyer, 2018) to explain more variance in
VCV. The 13 criteria together could only explain 5%
of the data variance of the VCV. The only significant
two values include direct addressing and prompts to
relevant content.
Regarding both research questions, the authors
missed detecting significant correlations. The five re-
gression analyses could not explain the data variance
of VCV significantly, whether these with cognitive
features (Shoufan, 2019) nor those with criteria for
good instructional videos (Kulgemeyer, 2018). The
authors conclude, to assess the subjective cognitive
value of an instructional video, the VCV as a value is
to be questioned. First, the range of VCV (13-443) is
extremely wide, which makes it difficult to assess the
significance of individual values. Second, the VCV is
composed of the numbers of likes and views. How-
ever, these numbers are more meaningful in terms of
the popularity of a video, rather than its perceived
quality (Welbourne and Grant, 2016). Wolf and Kul-
gemeyer (2016) have also described that it is not only
the perceived quality of the explanations in instruc-
tional videos that are rated, but also the perceived lik-
ing towards the instructor in the video and the use of
impressive media.
This work aimed to investigate instructional
videos, to research them using a given methodology,
to extend this methodology and to critically question
its practicability. The VCV has not been shown to
Beyond Viewing Counts, Likes Co: An Analysis of Instructional Videos on Youtube
239

be an appropriate measurement to describe the qual-
ity ratings of instructional videos. Other investigated
methods are still missing. Currently, however, eval-
uating a video’s quality is still best carried out by
hand and with various measurement tools that target
the content of the instructional video. It is, therefore,
necessary to take into account the content orientation
of the instructional video. For this purpose, there are
already various evaluation approaches from profes-
sional disciplines (Hartung, 2020; Kulgemeyer, 2020;
Okagbue et al., 2020; Uebing, 2019). The question is
whether it would be possible to develop a framework
that is either so modular that it can be adapted depend-
ing on the subject area or so abstract that different
subject areas are thereby taken into account. How-
ever, what features reliably make up a good instruc-
tional video remains to be examined. Many things
can be studied for this purpose (e.g., eye tracking).
Moreover, the click behavior when searching for and
watching the videos (Fyfield et al., 2021) could be in-
vestigated. One of the most promising approaches
seems to be comments. In this regard, Kulgemeyer
and Peters (2016) already noted connections between
physical instructional videos found to be good and the
number of content-related comments.
In general, a current development is important to
note. Youtube recently abolished the possibility to see
the number of dislikes for a video. This means that
further research on possible influences of dislikes for
the quality perception of instructional videos can no
longer be conducted directly. In principle, however,
there is a great need for research in order to be able to
describe the quality perception of instructional videos
in more detail.
REFERENCES
Alphabet Investor Relations. Alphabet q1 2021 earnings
call.
Bernickel, R. Mobilit
¨
at - Arbeit - Gesundheit: Zahlen,
Daten, Fakten [Mobility - Work - Health: Fig-
ures, Data, Facts]. Number 2020 in BKK Gesund-
heitsreport. Medizinisch Wissenschaftliche Verlags-
gesellschaft.
Cetin, A. Evaluation of YouTube video content related to
the management of hypoglycemia. 13(1):7.
Czysz, A. Zahl der arztbesuche und h
¨
aufigste krankheiten
in deutschland [number of doctor visits and most com-
mon diseases in germany].
Erdem, H. and Sisik, A. The reliability of bariatric surgery
videos in YouTube platform. 28(3):712–716.
Fyfield, M., Henderson, M., and Phillips, M. Navigating
four billion videos: teacher search strategies and the
YouTube algorithm. 46(1):47–59. Publisher: Taylor
& Francis.
Giffey, F. BMFSFJ - Ministerin Giffey: Einsamkeit ernst
nehmen [Minister Giffey: Taking loneliness seri-
ously].
Hartung, T. Geschichtsdarstellungen auf YouTube –
geschichtsdidaktische Prinzipien f
¨
ur die Beurteilung
von Erkl
¨
arvideos [Representations of history on
YouTube - historical didactic principles for the assess-
ment of explainer videos]. page 99.
Heidemann, C., Scheidt-Nave, C., Beyer, A.-K., Baumert,
J., Thamm, R., Maier, B., Neuhauser, H., Fuchs, J.,
Kuhnert, R., and Hapke, U. Gesundheitliche lage
von erwachsenen in deutschland – ergebnisse zu aus-
gew
¨
ahlten indikatoren der studie GEDA 2019/2020-
EHIS [health situation of adults in germany - results
on selected indicators of the study GEDA 2019/2020-
EHIS].
Kahane, K., Sherman, J., and Patella, S. Public health’s call
to the people: Media misinformation matters. (28).
Khan, M. L. Social media engagement: What motivates
user participation and consumption on YouTube?
66:236–247.
Kulgemeyer, C. Erkl
¨
aren im physikunterricht [explaining
in physics classes]. In Kircher, E., Girwidz, R., and
Fischer, H. E., editors, Physikdidaktik | Grundlagen,
pages 403–426. Springer.
Kulgemeyer, C. A framework of effective science explana-
tion videos informed by criteria for instructional ex-
planations. 50(6):2441–2462.
Kulgemeyer, C. and Peters, C. Exploring the explaining
quality of physics online explanatory videos. 37:1–
14.
Leopoldina, acatech – Deutsche Akademie der Technik-
wissenschaften, and Union der deutschen Akademien
der Wissenschaften. Public health in deutschland
– strukturen, entwicklungen und globale heraus-
forderungen [Public Health in Germany - Structures,
Developments and Global Challenges].
Long, P. and Siemens, G. Penetrating the fog: Analytics in
learning and education.
Mayer, R. The Cambridge Handbook of Multimedia Learn-
ing. Cambridge University Press. Google-Books-ID:
SSLdo1MLIywC.
Okagbue, H., Oguntunde, P. E., Bishop, S., Obasi, E. C. M.,
Opanuga, A., and Ogundile, O. P. Review on the reli-
ability of medical contents on YouTube.
Papamitsiou, Z. and Economides, A. A. Learning analytics
and educational data mining in practice: A systematic
literature review of empirical evidence. 17(4):49–64.
Publisher: International Forum of Educational Tech-
nology & Society.
Schwartz, F., Walter, U., Johannes, S., Kolip, P., Leidl, R.,
Dierks, M.-L., Busse, R., Schneider, and Nils (2012).
Public Health: Gesundheit und Gesundheitswesen
[Public health : Health and health care].
Shoufan, A. Estimating the cognitive value of YouTube’s
educational videos: A learning analytics approach.
92:450–458.
Thurston, M. Key Themes in Public Health. Routledge.
Uebing, J. Geschichte in 10 Minuten – Wie geht das? Ein
Vorschlag zur Analyse von historischen Erkl
¨
arvideos
CSEDU 2022 - 14th International Conference on Computer Supported Education
240

auf der Plattform YouTube [History in 10 minutes -
How does it work? A proposal for the analysis of his-
torical explanatory videos on the platform YouTube].
De Gruyter Oldenbourg. Pages: 71-94 Publication Ti-
tle: Geschichte auf YouTube Section: Geschichte auf
YouTube.
Welbourne, D. J. and Grant, W. J. Science communication
on YouTube: Factors that affect channel and video
popularity. 25(6):706–718. Publisher: SAGE Pub-
lications Ltd.
Wojtek. Regelung zu sterbehilfe.
Wolf, K. and Kulgemeyer, C. Lernen mit Videos?
Erkl
¨
arvideos im Physikunterricht [Learning with
videos? Explainer videos in physics education].
27:36–41.
Beyond Viewing Counts, Likes Co: An Analysis of Instructional Videos on Youtube
241
