
Solution to CAD Designer Effort Estimation based on Analogy with
Software Development Metrics
Oksana Ņikiforova
1,2 a
, Vitaly Zabiniako
2b
, Jurijs Kornienko
2c
, Pāvels Garkalns
1,2
,
Ruslan Rizhko
3
and Madara Gasparoviča-Asīte
2d
1
Faculty of Computer Science and Information Technology, Riga Technical University, Riga, Latvia
2
Departments of Research and Development, Microsoft Solutions, User Support, “ABC software” Ltd., Riga, Latvia
3
Department of CAD and DMS, “Olimps” Ltd., Riga, Latvia
pavels.garkalns@edu.rtu.lv, Ruslan_rizhko@olimps.lv, madara.gasparovica-asite@abcsoftware.lv
Keywords: Effort Estimation, Efficiency Metrics, CAD Designing, Agile Software Development.
Abstract: Although the CAD designer’s work has been automated with CASE tools for more than 30 years, the field of
effort estimation methods for measuring the efficiency of a CAD designer has not been developed. In the field
of software development, where the specifics of work are similar to the specifics of CAD designer’s work
(participation in projects with certain tasks and defined work results), the methods and metrics for evaluating
work efficiency have stabilised to some extent over the past 30 years. The focus of the article is to establish
analogies in efficiency metrics of software developer’s work and that of CAD designer’s work and to propose
a tool prototype – a supported approach for CAD designer’s work efficiency estimation.
1 INTRODUCTION
The problem environment of the present article is
related to the work activities of modern engineering
system designers and the fact that there is a distinct
lack of methods for formalised and automated
estimation of their work. This refers to the quality of
the designing process itself, project properties and its
characteristics. This issue is especially topical
nowadays, performing the work remotely and onsite
(Nikiforova et al., 2021a).
Taking into account that engineering designer’s
work is a process, aspects of which are similar to
software development, the aim of the present study is
to find analogies with existing software development
and its estimation methods. This will allow adapting
these methods for the assessment of engineering
designer’s work. Consequently, the following tasks
are set: to develop a prototype tool, which will
demonstrate implementation of work estimation, and
to define formal input data for this tool.
a
https://orcid.org/0000-0001-7983-3088
b
https://orcid.org/0000-0002-1307-1815
c
https://orcid.org/0000-0002-2845-9820
d
https://orcid.org/0000-0002-0007-9295
The study is intended to provide a set of metrics
for effort estimation of engineering system designer
based on the analysis of methods, practices, tools
used for work and effort estimation in software
development. The authors attempt to establish
analogies between software development artefacts
and similar artefacts in engineering system design and
perform mapping between identified corresponding
item pairs.
The article is structured as follows: Section 2
outlines specifics of CAD designer’s work, its
estimation, and similarities identified with software
development process. Section 3 provides an overview
of efficiency metrics used in software development,
which is analogical and applicable to the same
metrics for system engineering design. Section 4
demonstrates a prototype tool and the resulting
screenshots. Section 5 summarises work related to
engineering designer’s efficiency estimation. Finally,
conclusions are made, which summarise the
advantages of the proposed approach.
292
N
,
ikiforova, O., Zabiniako, V., Kornienko, J., Garkalns, P., Rizhko, R. and Gasparovi
ˇ
ca-As
¯
ıte, M.
Solution to CAD Designer Effort Estimation based on Analogy with Software Development Metrics.
DOI: 10.5220/0011032700003176
In Proceedings of the 17th International Conference on Evaluation of Novel Approaches to Software Engineering (ENASE 2022), pages 292-300
ISBN: 978-989-758-568-5; ISSN: 2184-4895
Copyright
c
2022 by SCITEPRESS – Science and Technology Publications, Lda. All rights reserved

2 SPECIFICS OF CAD
DESIGNER’S WORK AND ITS
ESTIMATION
While examining the literature on measuring work
efficiency, it has been found that there are no ready-
made methods for solving the problem of efficiency
monitoring. In addition, there is little research on the
work of an engineering system designer and
AutoCAD (AutoCAD 2010) designers as specialists
in their profession. The global classification of Key
Performance Indicators (KPI, 2021) implies that the
work of an engineering system designer meets the
category of research and development engineering
and stops at the second level of division of this
category with the general definition of engineering
efficiency. At the first level, engineering efforts can
be divided into software engineering, research and
development engineering, consulting engineering,
manufactory and lean engineering, as well as
financial evaluation for engineering industry.
The work of an engineering system designer falls
into the category of development engineering. Thus,
from the point of view of performance evaluation,
engineering works can be divided into respective
subgroups. At the second level, there is performance
in the field of research and development engineering.
If this type of engineering is further divided into
subgroups, then we come to the engineering
efficiency. One can expect that at a deeper level we
receive the criteria for assessing the productivity of a
designer’s work, but, unfortunately, again we are
faced with a lack of research in this area.
If we set the task to determine a list of criteria for
evaluating the work of a designer, we should look for
information that contains the following items:
AutoCAD designer’s job description;
Designer in AutoCAD occupational standard;
AutoCAD Design Guidelines;
Designer in AutoCAD work productivity;
Designer in AutoCAD work efficiency;
AutoCAD quality criteria assessment.
According to the definition, an engineering
system designer is a person who specialises in design
of different kinds of sketches, networks, electrical
schemas and other engineering projects. Additional
information can be found in occupational standards,
job descriptions, different types of guidelines, but the
information on work efficiency is quite fragmented.
Summarising the standard job descriptions, it can be
concluded that in several cases the following
requirements are set: drawing document processing;
execution of drawings of design documentation in
accordance with the issued work orders; development
of design solutions; drawing design and textual
support; development and improvement of
technological solutions. The research of
corresponding information items allows dividing the
engineering system designer’s work into three
categories of activities in terms of working time:
Doing – modelling activities, such as element
layout, placement, sizing, moving, etc. (where
metrics can be established based on the same
principles used in modelling, especially, in
business process modelling);
Thinking – construction activities, such as
element creation, connection of elements,
setting parameters (where specific metrics can
be established related to the performance of
AutoCAD commands);
Administrative burden – task tracking, time
reporting, etc. (where metrics used in software
development projects can serve as a basis for
definition of metrics for administrative work
specifics in engineering system design).
The basics of engineering system designer’s
work, in general, is to create and modify drawings,
which is the same as to create the content of elements
in some file. Thus, it is possible to consider
similarities between engineering designer’s work and
software developer’s (e.g., programmer’s) work due
to the fact that both activities imply working on
engineering projects, which have common
measurable properties, such as work amount, time,
velocity, characteristics of the work result (e.g.,
functional quality), etc. The next section presents the
results of mapping of software development work
estimation methods and metrics into CAD designer’s
work evaluation abilities.
3 MAPPING OF SOFTWARE
DEVELOPMENT TO
ENGINEERING SYSTEM
DESIGN
By comparing measurements established in software
development to specific artefacts of engineering
system designer’s work, a logical analogy can be
deduced. Table 1 presents the comparison of the
results of software development metrics to that of
CAD designer’s work as a mapping of both field
artefacts with comments on the identified analogy.
Solution to CAD Designer Effort Estimation based on Analogy with Software Development Metrics
293

Table 1: Mapping of software development metrics for effort estimation to engineering system designer’s artefacts.
Methods/metrics in software development projects Analogy explanation
Methods/metrics for CAD
desi
g
ner’s work estimation
The ABSDEE approach estimates the cost of a new project
based on the cost of a similar project developed previously.
The entire ABSDEE process runs as follows: 1) it compares
new projects with past projects and finds similarities with
past projects; 2) it estimates a new project using the effort of
the most similar previous projects
(Gautam, & Singh, 2017).
True S accepts input in the form of SLOe measures,
performance and complexity factors, integration parameters
and design percentage. This allows specifying the application
type. The other sections are platforms that describe
operational, structural, and reliability requirements (Tanveer,
Guzmán, & Engel, 2016).
ANGEL – an automated environment that collects, stores,
and identifies most similar projects to estimate effort for a
new project (Tanveer, Guzmán, & Engel, 2016).
Data Smoothing for Software Effort Estimation – the
proposed method modifies the labour values (person-months
or person-hours) of the dataset to meet this assumption.
Therefore, all outliers become non-outliers without reducing
the data points (Korenaga, Monden, & Yücel, 2019).
Re-immersion time – it is a measure of the impact of work
interruption. Re-immersion time is an extra effort to complete
the task after interruption (Baião, Revo
r
edo, & Silveira, 2014).
In the context of these
methods, a software
development project is
like the project of CAD
design and it is possible to
borrow the practice of
using historical data about
activities and time needed
for a specific project in the
current project estimation.
Moreover, as far as CAD
designer’s work is more
homogenous than
software development
process, we can expect
higher precision of the
application of historical
data.
Likewise in software
development projects, CAD
designers participate in
drawing development,
communication with cus-
tomers and other activities.
CAD designers work with
different drawing files under
different projects. Different
activities in drawing files can
be estimated with different
coefficients of complexity, can
have different nature (thinking/
doing/ adminis-trative burden).
The activities carried out
within particular drawing can
be automatically collected.
Likewise in software develop-
ment, the historical data can be
applied for the current project
estimation, comparing
designer’s work to individual
or peer performance.
Line of code (LOC) – all lines of text in the code that are not
comments or blank lines, the number of statements or
statement fragments per line (Boehm, 1981).
KESLOC – product size in thousands of equivalent lines of
code (Software Development Cost Estimating Handbook, 2008).
Features – a functional unit of a software system that meets
requirements, represents a design solution, and provides
potential configuration options (Rubin, 2012).
Number of elements (NEL) – the amount of individual
additional information generated by a BPM project, usually in
relation to the project goals, which determines what
information should be modelled (Cappelli, Santoro, Nunes, &
Barros, 2010).
Object points – a method of estimating the scope of work, like
original lines of code (SLOC). It is not necessarily related to
objects in object-oriented programming, and the mentioned
objects include screens, reports, and language modules
(Usman, & Britto, 2016).
Software Size – a measure of software functionality provided
or expected to be provided by the software. Software size is a
numerical measure of a software requirement that is
qualitatively defined by the user, most often – in a text
document
(
Shah, Pa
p
atheocharous, & N
y
f
j
ord, 2015
)
.
In software development
project, the valuable result
of developer’s work is the
LOC metrics. By analogy,
in the engineering system
design, the valuable result
of designer’s work is the
content of drawings,
which is potentially
measurable.
The content of drawings and
the amount of content are
obtained automatically using
the plug-in developed for
auditing content created in
CAD drawing at a particular
period of time. To calculate
the amount of the content,
the delta between content in
initial check time and
content in the following
check time is taken into
consideration. As the content
of engineering system
drawing, the classification of
objects is used (AutoCAD,
2010).
Effort-Time – an absolute estimate, time that humans use as a
systematic measure (Arifin, Daengdej, & Khanh, 2017).
Time spent using IDE is
like the time spent in the
CAD environment.
Effort-Time is borrowed
directly.
Project effort – cumulative time spent on the project by the
entire project team. Effort is usually measured in man-hours,
man-months, or man-days, but since other units require
conversion from hours to days or months, man-hours is the
most appropriate and unambiguous unit (Treude, Filho, &
Kulesza, 2015).
In system engineering
design projects, the project
effort is defined the same
as in software
development projects.
Project effort is borrowed
directly.
ENASE 2022 - 17th International Conference on Evaluation of Novel Approaches to Software Engineering
294

Table 1: Mapping of software development metrics for effort estimation to engineering system designer’s artefacts(Cont.).
Methods/metrics in software development projects Analogy explanation
Methods/metrics for CAD
desi
g
ner’s work estimation
Function Point (FP) – a method for measuring the Effort
Estimation (EE) that has been used to measure the value of
functionality in software development. The use of FP for EE
aimed to gather of how long and how many resources would
take to accomplish a software project (Shah,
Papatheocharous, & Nyfjord, 2015).
Use Case Point (UCP) – an approach on how to develop
derivatives or adaptations of the FPA method. The aim of this
method is to provide a simple estimation method suitable for
the orientation of objects in a software project (Subriadi,
Sholiq, Lukitosari, & Permatasari, 2018). In Structured
Scenarios, each use case is weighted by the number of
identified scenarios and the weighted sum is used to calculate
the total Unadjusted Early Use Case Weight (UEUCW) (Qi,
Boehm, 2017).
The method of Extended Use Case Points (EXUCP) – it
uses the number of domain elements and User Interface
elements that each identified transaction interacts with, to
reflect its internal complexity (Qi, Boehm, 2017).
Story points – a unit that represents an estimate of the overall
effort required to fully implement an item of backlog or other
work item (Rubin, 2012).
Sprint-Point Based Estimation Technique in Scrum – the
algorithmic effort estimation method takes into account
various factors, thus estimating the release date, cost, effort
and duration of the project more specific to Scrum (Rubin,
2012).
Planning poker – a consensus-based, gamified method for
estimating, mainly used for timeboxing in Agile principles
(
Rubin, 2012
)
.
In the context of CAD
design, the functional
requirement / use case /
user story can be
expressed as a set of
commands performed in
one session and can be
evaluated in a similar way
with the points assigned.
By analogy, a CAD
project is not developed
continuously, it can be
interrupted in time;
moreover, the breaks
between continuous
workflows can serve as
metrics for work
estimation.
The CAD designer’s
workflow can be defined as a
continuous set of actions
performed in AutoCAD tool,
which is identified by a set of
registered commands
performed in a drawing file.
Story points are defined as
weights of commands
performed by CAD
designers on the drawing and
a set of command points
collected during one
workflow can be considered
the analogous metrics as
story points or functional
points applied in software
development projects.
Velocity is calculated by
multiplying commands
performed during one
workflow with command’s
weight. Planning poker can
be used in the same manner
as in software development
projects, where CAD
designers meet and vote for
the weight of particular work
amount.
Two composite models, namely, the RCA PRICE S model
(Basili, 1980) and Putnam’s SLIM model (Putnam 1978) are
widely used in software development (Pillai, Sukumaran
Nair, 1997). Software Lifecycle Model (SLIM) is used to
determine the Productivity Index (PI).
Productivity can be defined as the effort required to provide
the size of a software module. This helps project managers
anticipate the overall effort required to complete the project.
Productivity depends on team skills or experience with
similar skills. If development team worked on similar
technologies before, it would be more productive (PMBOK,
2021
)
,
(
Wa
g
ner, Deissenboeck, 2019
)
.
In system engineering
design projects, the
productivity is defined the
same as in the software
development projects.
Productivity is calculated as
a sum of commands
performed during the
workflow multiplied with
their weights per workflow
time expressed in hours.
Percentwise, it is calculated
in accordance with
designer’s productivity
maximum.
The System Evaluation and Estimation Resources-
Software Estimate Model (SEER-SEM) – this approach
incorporates a long list of environmental parameters, such as
complexity, employee capabilities and experience,
development needs, etc. Based on these data, this method can
predict effort, schedule, staff and handicap (Galorath, Evans,
2006).
The following attributes
from the parameters of
SEER-SEM methodology
are applicable to CAD
designers by analogy with
software developers:
personnel capabilities,
experience capabilities,
and develo
p
ment needs.
The metrics is to be
expressed as profiles
identified for groups of CAD
designers defined by domain
experts. According to the
group percent, working/
doing /administrative work
amount will be predefined
for each desi
g
ner.
We can compare software metrics used in
software development (such as average number of
unadjusted function points / unit of time, lines of code
/ hour, artefact count, tasks closed/opened,
complexity, features, story points, scrum metrics, pull
requests, stories, comments, releases, reviews; plan
fulfilment: estimate / reality, goals, expectation /
reality, deadlines, time spent, etc.) with designer’s
Solution to CAD Designer Effort Estimation based on Analogy with Software Development Metrics
295

work result, content and amount. We can also
compare elements of software functional point
analysis to the velocity of commands used by
designer during work sessions.
This allows considering a multiplication of a sum
of commands per day by velocities of these as the
point equivalent of CAD designer’s productivity. As
for the time characteristic of the engineering
designer’s project, it fully matches the same property
of a software project.
The first column in Table 1 lists methods /metrics
used in software development, which are grouped by
their characteristic features. The second column of
Table 1 explains the analogy between software
developer’s and CAD designer’s work in the context
of their potential for work estimation. The third
column defines the method/metrics, which can be
borrowed for CAD designer’s work estimation.
Table 1 provides a list of methods and metrics
applicable to mapping of software development
means into engineering system design, whereas a
wide spectrum of other methodologies and
characteristics also exist in the area of software
development effort estimation. Despite being
introduced in the 1980s, they are still widely used in
large software development projects, such as
Constructive Cost Model (COCOMO) (Boehm,
1981), Formal Method Knowledge Capability
(FMKC) (Sharma, Tomar, Patni, & Dumka, 2016),
etc. These methodologies are also applicable to CAD
designer’s work, and the most useful characteristics
are already covered by the artefacts listed in Table 1.
The authors of the present paper are more inclined to
Agile software development metrics and
measurements, because CAD designer’s work and
task sharing process are closer to agile project
organisation rather than to classical huge waterfalls.
So far, the set of metrics defined for work
estimation of engineering system designer has been
defined as follows:
Time spent for Drawing Development. It is
Possible to define continuous workflows of the
commands performed, expressed in terms of
hours. It is possible to analyse breaks and their
durations.
Content. It is possible to fix the content of
different objects composing the drawing and to
summarise the different deltas between content
of a particular drawing at different time
moments.
Command Points. It is possible to assign the
weight to command according to the profit for
content of the drawing, which this command
performance gives to the resulting file.
Velocity. It is calculated as a sum of all
commands performed during the workflow
multiplying them by their weights. It shows the
amount of work performed during the workflow
time.
Productivity. It is calculated by dividing the
velocity of the workflow by the time spent for
this workflow.
Project Time. It is possible to compare the
working time registered by some project
management tool to the time audited by the plug-
in collecting all the operations performed in
AutoCAD.
Set of Commands Performed by a Particular
Designer. It is possible to analyse a sequence of
commands performed, duplicates of commands,
most/less popular commands used, unused
commands, patterns, etc.
4 A TOOL PROTOTYPE TO
SUPPORT METRICS
ACQUISITION AND
PRESENTATION
To be able to somehow retrieve and interpret the
characteristics of engineering designer’s work, an
appropriate tool support is proposed within the
framework of the research. Assuming that AutoCAD
project data are a common example of this type, let us
consider the process of data acquisition for the further
analysis. In AutoCAD system, the engineering
system activities can be viewed in the built-in default
designer activity audit logs available as separate .log
files. Such sources contain data about the user and
their activities, but information about the execution
time of these activities is missing. To obtain the
required data set, a custom plug-in is needed, which
would be able to register the content of AutoCAD
project workflow in detail (Nikiforova et al., 2021b).
Such a plug-in has been developed within the
framework of the present research, and the data
obtained from AutoCAD by using this plug-in cover
all the data requirements for the metrics defined in the
previous section. The tool prototype was applied for
the analysis of the working activities of several
designers in a testing environment for a period of four
months in different data recording modes. The right
part of Fig. 1 presents the data on hours spent by
different designers during a day in a form of calendar,
where dark green, green, yellow, orange and red dates
of the calendar show different % of hours worked to
8 hours. For example, days, where the registered
ENASE 2022 - 17th International Conference on Evaluation of Novel Approaches to Software Engineering
296
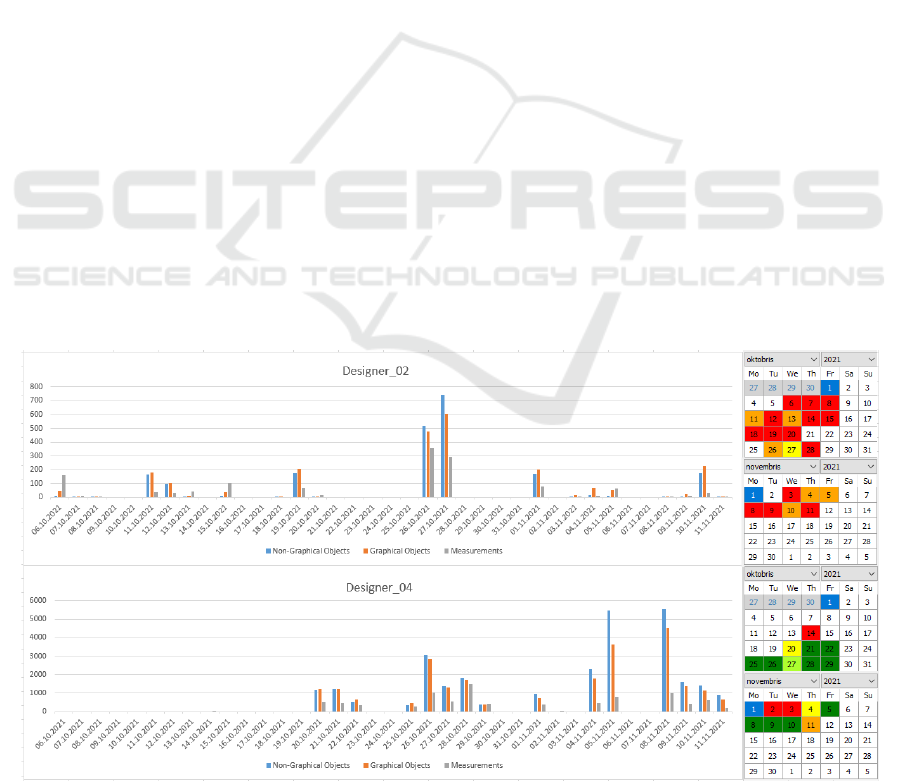
working hours are less than 1.5 hours are highlighted
as red; days with less than 3 registered working hours
are highlighted as orange; days with 6–8 registered
working hours are highlighted as dark green. The left
part of Fig. 1 presents the data about the content of
drawings on the example of designer_02 and
designer_04 and all files they have been working for
the period from 6 October to 11 November. The
specifics of CAD designer’s work is that the drawing
is not created from zero, but some previously created
sketch is taken as a basis and is modified by
adding/removing the required parts of a project. That
is why there is no meaning in comparison of the initial
start state of the project file with its result. Therefore,
it is not correctly to calculate the delta between initial
“zero” content of the drawing objects and the
complete file. In some cases, the content of the
complete file will be even less than an initial file. The
only viable solution would be to gather the content
data of workflow dynamically summarising “deltas”
of work content appearing each 5 minutes (the time
received empirically), taking into consideration both
adding and removing elements of an engineering
project file as an absolute value of content difference
at the end of 5 minute period and its start. The authors
propose the solution for this specific kind of content
registration and calculation by the same plug-in,
which registers commands performed in the file.
Thus, the content amount is also related to a designer,
drawing file and project, and can be analysed in the
context of time worked out versus the content
obtained. Therefore, it is possible to oppose content
gain bars on the particular days to information of
work hours presented in a monthly calendar shown in
Fig. 1 and to investigate uncommon cases, where
during “red” days we can see a huge content gain or
otherwise during “dark green” days we see a drop of
content gain bars.
Direct relationship between the content obtained
and hours worked out is easily perceived on the
diagrams (see Fig. 1). For example, the calendar of
designer_02 is full of red and orange days (less than
3 working hours per day) and the corresponding
content bars are in between 2–800 objects, whereas
the calendar of designer_04 is full of dark green days
(6–8 hours worked per day) and the corresponding
content is 200–6000 objects per day. In any case, the
authors do not draw any conclusions about the
effectiveness of the work amount and just provide this
information to a domain specialist for deeper
expertise. Figure 1 shows the fragment of such
content progress for three groups of objects, given by
the domain experts. These objects provide a valuable
gain for the drawing content and are divided into
graphical objects, non-graphical objects, and
measurements. Detailed information about the
amount of work per day is presented in Figure 2 using
a week view. It is possible to see breaks in day work
and command points and productivity of the
workflow.
Workflows for different projects are highlighted
by different colours. The names of projects and files
are blurred because this information is confidential. It
is also possible to compare time, velocity and
productivity for a particular designer or among all
designers as shown in Figure 3.
Figure 1: Content progress presentation diagrams.
Solution to CAD Designer Effort Estimation based on Analogy with Software Development Metrics
297
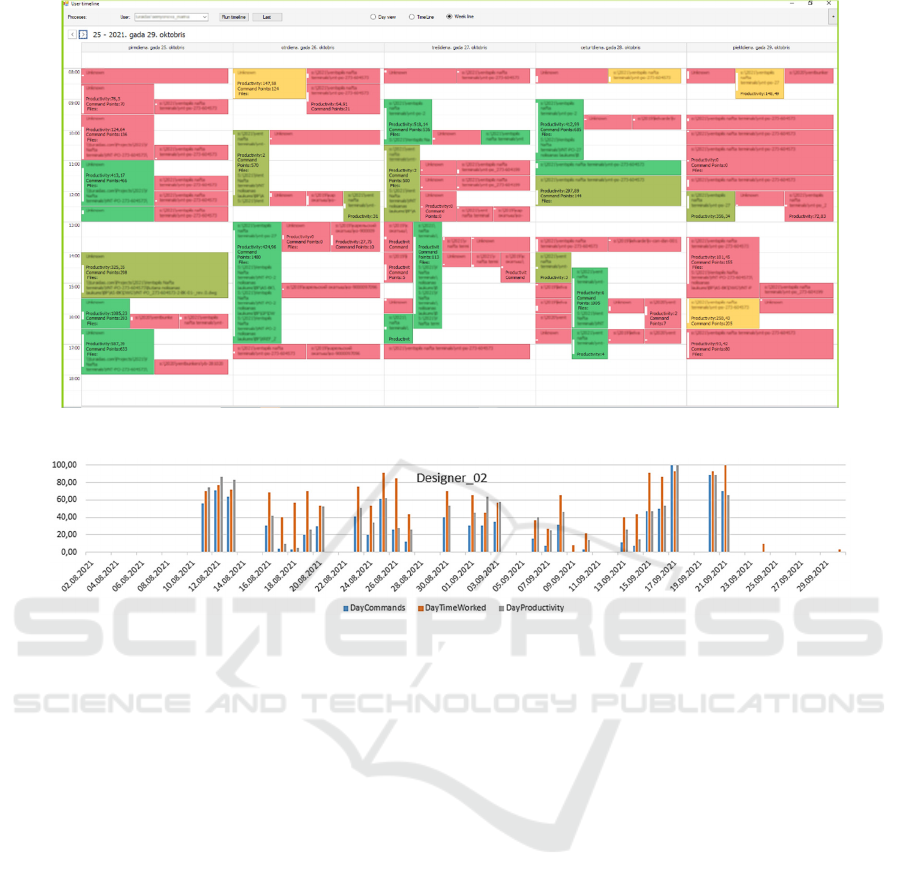
Figure 2: Workflows for different drawing development under different projects by a weekly calendar view.
Figure 3: Day commands, day time worked and day productivity of the designer for two months.
As mentioned above, another important project
property is the time characteristic of the engineering
designer’s project. Different solutions are used for
administrative time tracking and planning purposes of
engineering projects, such as Jira, Team Foundation
Server, etc. It is possible to compare working time
fixed in such a tool to the time registered by
AutoCAD plug-in for a particular user and to find
cases when the time of real work is more or less than
the time registered.
To monitor the set of commands performed by a
particular designer it is possible to find several
metrics for analysis (such as patterns, anti-patterns,
duplicates, opening/closing files without any
command performance in between, which is not a
good practice, etc.), which can be valuable for
designer’s learning purposes. Due to volume
limitation of the paper, this aspect is not covered in
detail in the paper.
5 RELATED WORK
Several engineering productivity measurements have
been used in existing research. For example, Thomas
(1999) performed engineering productivity
measurement by using hours per drawing, while
Song, Allouche, AbouRizk (2003) used hours per
designed element (a beam or column) for measuring
engineering productivity. The Construction Industry
Institute (2001) used hours per engineering quantity
(e.g., linear foot of pipe, or ton of steel) to measure
engineering productivity and researched the influence
factors, such as engineering input complexity and
quality. Such analyses were based only on piping
engineering due to a lack of other data.
The absence of specific methods for assessing the
productivity of designer’s work is confirmed by
research that reviews a variety of metrics (KPIs) and
states what a KPI itself is (KPI, 2021). Under the
taxonomy of areas and KPIs for measuring
productivity, the work of an engineering system
designer falls into the category of Research and
Development Engineering. Thus, from the point of
view of performance evaluation, engineering work
can be evaluated as follows: how much the
engineering team costs relative to the number of
products sold (or the number of projects they
support). If this type of engineering is further divided
into subtypes, one will expect that at a deeper level
ENASE 2022 - 17th International Conference on Evaluation of Novel Approaches to Software Engineering
298

we should receive criteria for assessing the
productivity of the work of a designer, but
unfortunately, we will face a lack of research in this
area. Thus, it can be concluded that specific methods
for assessing the designer’s work are not described in
the scientific literature and, if such monitoring exists,
it is guided by a set of intuitive techniques, methods,
and metrics. Some mentions of personal experience
of such assessments exist in several blogs of
professionals, but they are all vague.
To sum up, the obvious lack of methods for the
estimation of an engineering system designer’s work
efficiency provides a well-based reason for creation
of a new method. It can be safely assumed that the
methods that are used in related field, i.e., software
engineering, could be useful in such a new context.
Moreover, the approach proposed in the paper is
supported by the desktop application, which ensures
the following data collection and automated analysis
capabilities:
An ability to automate registration of commands
and to use these data in a form of audit records.
An ability to automate collection of deltas
(changes) in the content and to analyse it.
An ability to transfer the collected input data into
expected output data, which serves as a basis for
different work efficiency estimation metrics.
An ability to collect data in any design
environment with the requirement that the access
to the activity logs is allowed.
6 CONCLUSIONS
A majority of industrial companies are facing the
difficulties caused by today’s situation with COVID-
19 when employees are forced to work remotely. The
main complexity in this situation is an inability to
monitor continuity and efficiency of the working
process. The paper has proposed the approach to
discretely collect data about working activities
performed during the working day and the content of
the working result. The approach is adjusted for the
work of system engineering designer using
AutoCAD. It provides a tool for automatic input data
collection and monitors the expected output data
presented as different metrics for work estimation. As
far as such metrics does not exist in the domain of
system engineering designer’s work, the authors
propose to borrow the metrics from the software
development area.
By comparing software development
measurement procedures to engineering designer’s
work, we have identified a set of similarities, which,
in turn, have allowed us to propose customised tool-
supported solutions for effective evaluation of
engineering designer’s work. They are both
“traditional” properties, such as project time,
commands number and velocity, and advanced
attributes, such as the content itself, individual
commands, set of commands and their patterns.
The approach offered and the tool proposed could
be of interest to companies working on engineering
system design with AutoCAD. The approach is
effortlessly convertible for usage with another tool for
engineering system design. The only requirement for
the tool used is the ability to set up the record of
commands performed and the content of the drawing
files. An additional feedback in terms of the usage of
the proposed approach can be obtained if some
project management tool is involved in the
administration of project files, tasks and hours
registered as spent on exact task performance. In this
case, the monitoring of work efficiency metrics is
refined with an ability to monitor project efforts.
The fact that engineering system designers spend
their time not only to work in AutoCAD, but also to
communicate with customers, participate in
meetings, send e-mails, look for information on the
Internet provides a basis for further research areas.
The authors plan to expand the variety of activities
collected currently only as commands performed in
AutoCAD with activities performed also in other
tools and information systems used during the
working day, thus combining all work hours and
results into integrated collection of time, activities,
content and set of commands, and to monitor changes
in work efficiency metrics, in general.
ACKNOWLEDGEMENTS
The research leading to these results has received
funding from the research project “Competence Centre
of Information and Communication Technologies” of
EU Structural funds, contract No. 1.2.1.1/18/A/003
signed between IT Competence Centre and Central
Finance and Contracting Agency, Research No. 1.14
“Method Development for Construction of Unified
Behaviour Model of Users Working in Engineering
IT Systems, Using AI/ML Algorithms”.
The research has been supported by the Doctoral
Grant programme of Riga Technical University.
REFERENCES
Arifin, H. H., Daengdej, J., Khanh, N. T. (2017). An
Empirical Study of Effort-Size and Effort-Time in
Solution to CAD Designer Effort Estimation based on Analogy with Software Development Metrics
299

Expert-Based Estimations. 2017 8th International
Workshop on Empirical Software Engineering in
Practice (IWESEP), pp. 35-40
AutoCAD (2010) AutoCAD Architecture: User's Guide.
Retrieved from: https://images.autodesk.com/
Baião, F. A., Revoredo K., Silveira, B. (2014). Effort
Estimation of Business Process Modeling through
Clustering Techniques. iSys - Brazilian Journal of
Information Systems, 10, pp. 34-47.
Basili, V.R. (1980) Qualitative Software Complexity
Models: A Summary. In: Tutorial on Models and
Methods for Software Management and Engineering,
IEEE Computer Society Press, Los Alamitos.
Boehm, B. (1981). Software Engineering Economics.
Prentice-Hall. Prentice Hall PTR, Upper Saddle River,
NJ, United States. ISBN 0-13-822122-7.
Cappelli, C., Santoro, F. M., Nunes, V. T., Barros. O. M.
(2010). An Estimation Procedure to Determine the
Effort Required to Model Business Processes. In
Proceedings of the 12th International Conference on
Enterprise Information Systems, 3, pp. 178-184.
Construction Industry Institute. (2001). Engineering
productivity measurement. RR156-11, Construction
Industry Institute, The University of Texas at Austin,
Austin, TX.
Galorath, D., Evans M. (2006) Software Sizing, Estimation,
and Risk Management, Auerbach Publications, USA.
Gautam, S. S., Singh, V. (2017). A comparative study of
hybrid models of selective classification and dynamic
selection of analogies for software development effort
estimation. 2017 IEEE International Conference on
Industrial and Information Systems (ICIIS), pp. 1-6
Jorgensen, M., Shepperd, M. (2007). A Systematic Review
of Software Development Cost Estimation Studies.
IEEE Transactions on Software Engineering, vol.33,
no.1, pp. 33-53
Korenaga, K., Monden, A., Yücel, Z. (2019). Data
Smoothing for Software Effort Estimation. 2019 20th
IEEE/ACIS International Conference on Software
Engineering, Artificial Intelligence, Networking and
Parallel/Distributed Computing (SNPD), pp. 501-506.
KPI.org. (2021) What is a Key Performance Indicator
(KPI)? Retrieved from: https://kpi.org/KPI-Basics
Nikiforova, O., Zabiniako, V., Kornienko, J., Rizhko, R.,
Babris, K., Nikulsins, V., Garkalns, P., Gasparoviča-
Asīte, M. (2021a) Solution to On-line vs On-site Work
Efficiency Analysis on the Example of Engineering
System Designer Work, Applied Computer Systems,
vol.26, no.2, pp. 87-95
Nikiforova, O., Zabiniako, V., Kornienko, J., Rizhko, R.,
Babris, K., Gasparoviča-Asīte, M. (2021b) Efficiency
Monitoring of Engineering System Designer Work
Based on Multi-System User Behavior Analysis with
AI/ML Algorithms, IEEE 62nd International Scientific
Conference on Power and Electrical Engineering of
Riga Technical University, IEEE, 1.-6.lpp.
Pillai, K., Sukumaran Nair, V. S., A model for software
development effort and cost estimation, In: IEEE
Transactions on Software Engineering, vol. 23, no. 8,
pp. 485-497, Aug. 1997.
PMBOK (2021) A Guide to the Project Management Body
of Knowledge (PMBOK Guide)
. Project Management
Institute. ISBN 978-1935589679.
Putnam, L.H. (1978) A General Empirical Solution to the
Macro Software Sizing and Estimation Problem, In:
IEEE Trans. Software Eng., pp. 345-361, July 1978.
Qi, K., Boehm, B. W. (2017). A light-weight incremental
effort estimation model for use case driven projects.
2017 IEEE 28th Annual Software Technology
Conference (STC), pp. 1-8.
Rubin, K. (2012) Essential Scrum: A Practical Guide to the
Most Popular Agile Process (Addison-Wesley
Signature Series (Cohn)) 1st Edition. Addison-Wesley
Professional. ISBN 978-0137043293.
Shah, S. M. A., Papatheocharous, E., & Nyfjord, J. (2015).
Measuring Productivity in Agile Software
Development Process: A Scoping Study. In Procs of the
2015 International Conference on Software and System
Process (ICSSP 2015), pp. 102-106.
Sharma, H. K., Tomar, R., Patni, J. C., Dumka, A. (2016).
E-COCOMO An effort estimation model for cleanroom
software development approach. 2016 2nd
International Conference on Next Generation
Computing Technologies (NGCT).
Software Technology Support Center. (2008) Software
Development Cost Estimating Handbook. Retrieved
from: https://www.dau.edu/
Song L., Allouche M., AbouRizk S. (2003). Measuring and
Estimating Steel Drafting Productivity. Construction
Research Congress: Wind of Change: Integration and
Innovation, pp. 1-9, 2003.
Subriadi, A.P., Sholiq, Lukitosari, V., Permatasari, R.
(2018). The Comparison Analysis of Estimation Effort
Among Software Development Using Function Point
Method. 2018 International Seminar on Research of
Information Technology and Intelligent Systems
(ISRITI), pp. 204-209.
Tanveer, B., Guzmán, L., Engel, U.M. (2016).
Understanding and Improving Effort Estimation in
Agile Software Development—An Industrial Case
Study. 2016 IEEE/ACM International Conference on
Software and System Processes (ICSSP), pp. 41-50.
Thomas, R. (1999). Conceptual model for measuring
productivity of design and engineering. Journal of Cons-
truction Engineering and Management, 5(1), pp.1-7.
Treude, C., Filho, F.M., Kulesza, U. (2015). Summarizing
and measuring development activity. Proceedings of
the 2015 10th Joint Meeting on Foundations of
Software Engineering, pp. 625–636.
Usman, M., Britto, R. (2016). Effort Estimation in Co-
located and Globally Distributed Agile Software
Development: A Comparative Study. 2016 Joint
Conference of the International Workshop on Software
Measurement and the International Conference on
Software Process and Product Measurement (IWSM-
MENSURA), pp. 219-224.
Wagner S., Deissenboeck F. (2019) Defining Productivity
in Software Engineering. In: Sadowski C., Zimmermann
T. (eds) Rethinking Productivity in Software
Engineering. Apress, Berkeley, CA.
ENASE 2022 - 17th International Conference on Evaluation of Novel Approaches to Software Engineering
300
