
An In-house, Self-developed Low-cost WebGIS Relying on Open-source
and Self-made Tools to Show the Active Deformation Areas across
Europe
Jos
´
e A. Navarro
a
, Danielly Garc
´
ıa
b
and Michele Crosetto
c
Centre Tecnol
`
ogic de Telecomunicacions de Catalunya (CTTC/CERCA),
Av. Carl Friedrich Gauss 7, 08860 Castelldefels, Spain
Keywords:
Active Deformation Areas, Geoprocessing, Land Subsidence, Open-source, WebGIS.
Abstract:
This paper describes the steps already taken to implement an in-house WebGIS system targeted at displaying
Active Deformation Areas for all Europe. The high volume of Persistent Scatterers data (provided by the
European Ground Motion Service) to process and afterwards store, together with the economic consequences
that such a big volume of information implies were the reasons to prefer an in-house solution instead of using
the available, well-stablished cloud-based ones. The architecture of the system as well as the open-source
components required to set up a capable server sustaining the said architecture are described in this work,
together with the self-developed tools used to implement a production workflow to generate the data (Active
Deformation Areas) that will feed such system. Promising preliminary performance figures are also given.
1 INTRODUCTION
This paper is focused on Interferometric SAR (In-
SAR) -based land deformation products. In partic-
ular, it is focused on wide-area coverage datasets,
like those generated by the European Ground Motion
Service (Crosetto et al., 2020). This Service is go-
ing to cover all Europe with billions of measurement
points, each point containing a time series of defor-
mations. Such a huge dataset calls for appropriate
tools to exploit is. The tools described in this pa-
per are focused on the so-called Active Deformation
Areas (ADA), which represent an attempt to concen-
trate the most valuable part of a given InSAR dataset,
i.e. the clusters of active deformation InSAR mea-
surement points, in a much smaller and manageable
dataset. The paper describes an ongoing research ac-
tivity to visualize and manage large sets of ADAs in a
WebGIS environment. The paper starts with a system
overview. This is followed by some design consid-
erations. The data production workflow and the pro-
posed tools are then described. The last part discusses
the preliminary tests run to check the performance of
the proposed system. Some conclusions follow.
a
https://orcid.org/0000-0001-7877-1516
b
https://orcid.org/0000-0002-8191-3308
c
https://orcid.org/0000-0001-8545-5490
2 SYSTEM OVERVIEW
Several considerations were taken into account when
devising the overall architecture of the system. The
most important from the end-user standpoint were
performance and ergonomics; on the other side, and
from the developers’ point of view, cost and ease of
exploitation —keeping the probability of errors as low
as possible— were strong arguments leading the de-
sign process.
The volume of data to process and display was an
important factor modulating how the aforesaid factors
influenced in the decisions shaping the architecture of
the system. In other words, the conclusions drawn
about performance when small data sets are to be con-
sidered substantially differs from those obtained when
such data sets may become huge. At the time of writ-
ing the actual volume of information to handle is still
unknown, but it is foreseen that maybe hundreds of
thousands of ADAs will have to be dealt with. More-
over, every single ADA is a rather big entity by itself;
the attributes defining an active deformation area are
just twelve, but one of them, the deformation time se-
ries may amount to literally hundreds of values.
Under the light of such considerations, a cloud-
based solution was thought as appropriate—which,
indeed, it is. The two factors that advised to adopt
such an approach were escalability—from the volume
Navarro, J., García, D. and Crosetto, M.
An In-house, Self-developed Low-cost WebGIS Relying on Open-source and Self-made Tools to Show the Active Deformation Areas across Europe.
DOI: 10.5220/0011026400003185
In Proceedings of the 8th International Conference on Geographical Information Systems Theory, Applications and Management (GISTAM 2022), pages 99-106
ISBN: 978-989-758-571-5; ISSN: 2184-500X
Copyright
c
2022 by SCITEPRESS – Science and Technology Publications, Lda. All rights reserved
99
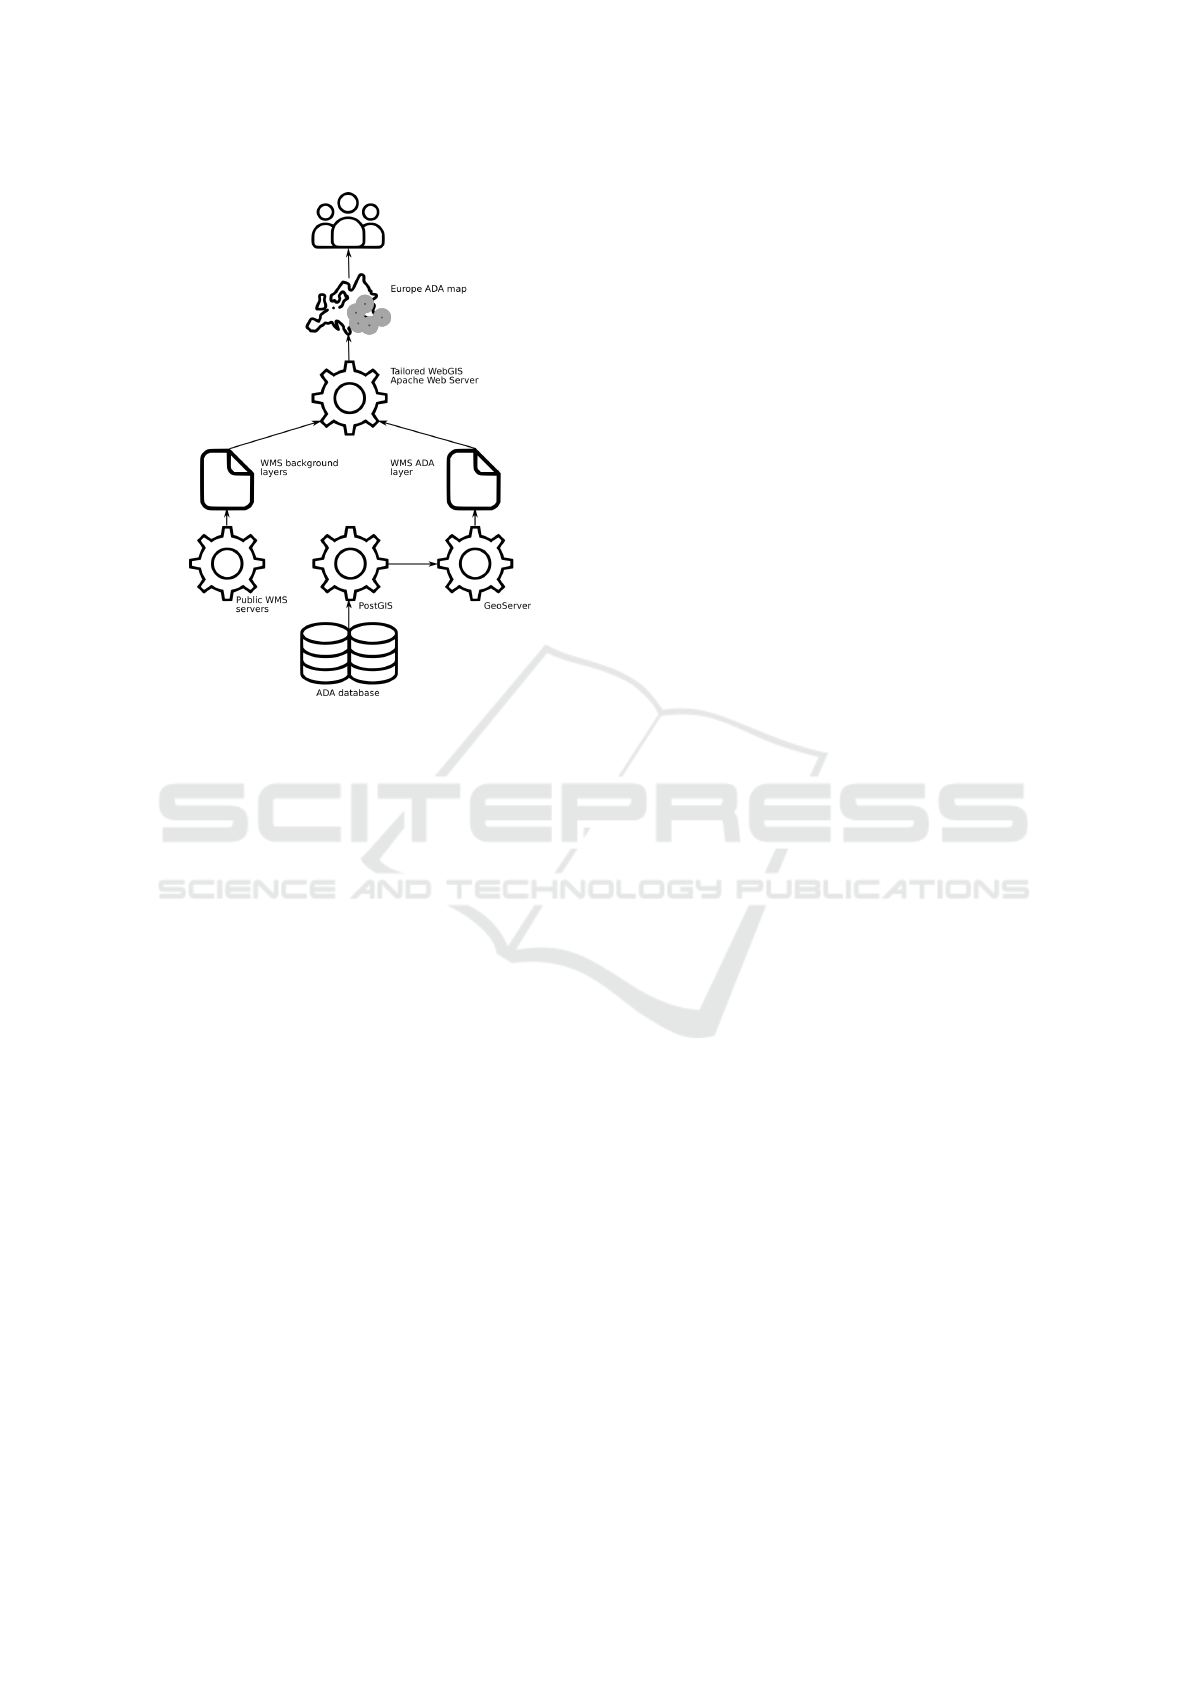
Figure 1: Overview of the system architecture.
of information to store point of view—and data secu-
rity (backup). Therefore, the market was investigated
looking for companies offering a service compatible
with the needs of the project. Unfortunately, the cost
of hosting the solution externally amounted to thou-
sands of euro per year, something that was absolutely
unattainable and out of consideration.
The decision to implement an in-house solution
was therefore taken. The immediate implications of
such line of action were the need to acquire the hard-
ware platform to host the solution and the selection
of the—preferably, open-source and free—software
tools required to implement it.
The panoply of tools selected is composed of
two kind of these. First, the self-developed ones,
either already available or in the process of ac-
tive development; these are ADAfinder—producing
the ADAs themselves—, ADA2PGIS—responsible
for post-processing the ADAs and storing these in
the database selected for the project—as well as an
HTML + JavaScript WebGIS—taking care of the vi-
sualization of data. On the other side, the open-
source tools selected were PostgreSQL including the
PostGIS spatial extension—to store the ADAs—,
GeoServer—to make these ADAs available as a Web
Map Service (WMS)—and Apache (to host the Web-
GIS application).
All these tools are described in section 5. Figure 1
depicts the architecture of the system, showing very
schematically how the components interact.
On the other side, a workflow targeted at produc-
ing the information that will be stored in the sys-
tem has also been designed. It takes as input the
Persistent Scatterers (PS) provided by the EGMS
(European Environment Agency, 2021) and produces
the ADA that will be displayed thanks to the We-
bGIS. This workflow is in the process of actual
implementation—by developing some of the inter-
vening tools—and will be highly automated to re-
duce to a minimum the need of human intervention
and therefore making errors less likely. section 4 de-
scribes the workflow in detail.
At the time of writing this paper the hardware re-
quired to run the aforementioned components is in the
process of being acquired. Note that server, however,
will only host the components shown in Figure 1, that
is, PostgreSQL + PostGIS, GeoServer and Apache
(including the WebGIS). Nonetheless, and to facilitate
the development and testing of the system, these are
already installed in regular development computers.
The tools used to produce and store the data (namely
ADAfinder and ADA2PGIS) will run in one or more
personal computers.
3 SOME DESIGN
CONSIDERATIONS
Due to the extent of the area covered by the project,
several important considerations arose when design-
ing the system. These were:
1. The structure of the PostgreSQL – PostGIS
database’s table storing the ADA data,
2. the coordinate reference system to use to store and
visualize them and
3. the number of ADA layers shown in the WebGIS.
Regarding the database, the issue was related to the
variability of the averaged time series included with
every ADA; more specifically, the set of value pairs
(dates, deformation) in these time series is not uni-
form for the PS over all Europe. This is so due to
the heterogeneous availability of Sentinel images for
different areas, which, consequently, imply different
time series for the said PS.
Tables in relational databases—such as Post-
greSQL + PostGIS—must have a predefined, fixed
structure; thus, having variable time series is a prob-
lem going directly against this principle. The issue
has been solved creating a table able to store the
longest possible time series (covering every date for
which images exist). Allowing null values for the
date(s) not available in a specific time series makes
possible the handling of apparently heterogeneous
GISTAM 2022 - 8th International Conference on Geographical Information Systems Theory, Applications and Management
100
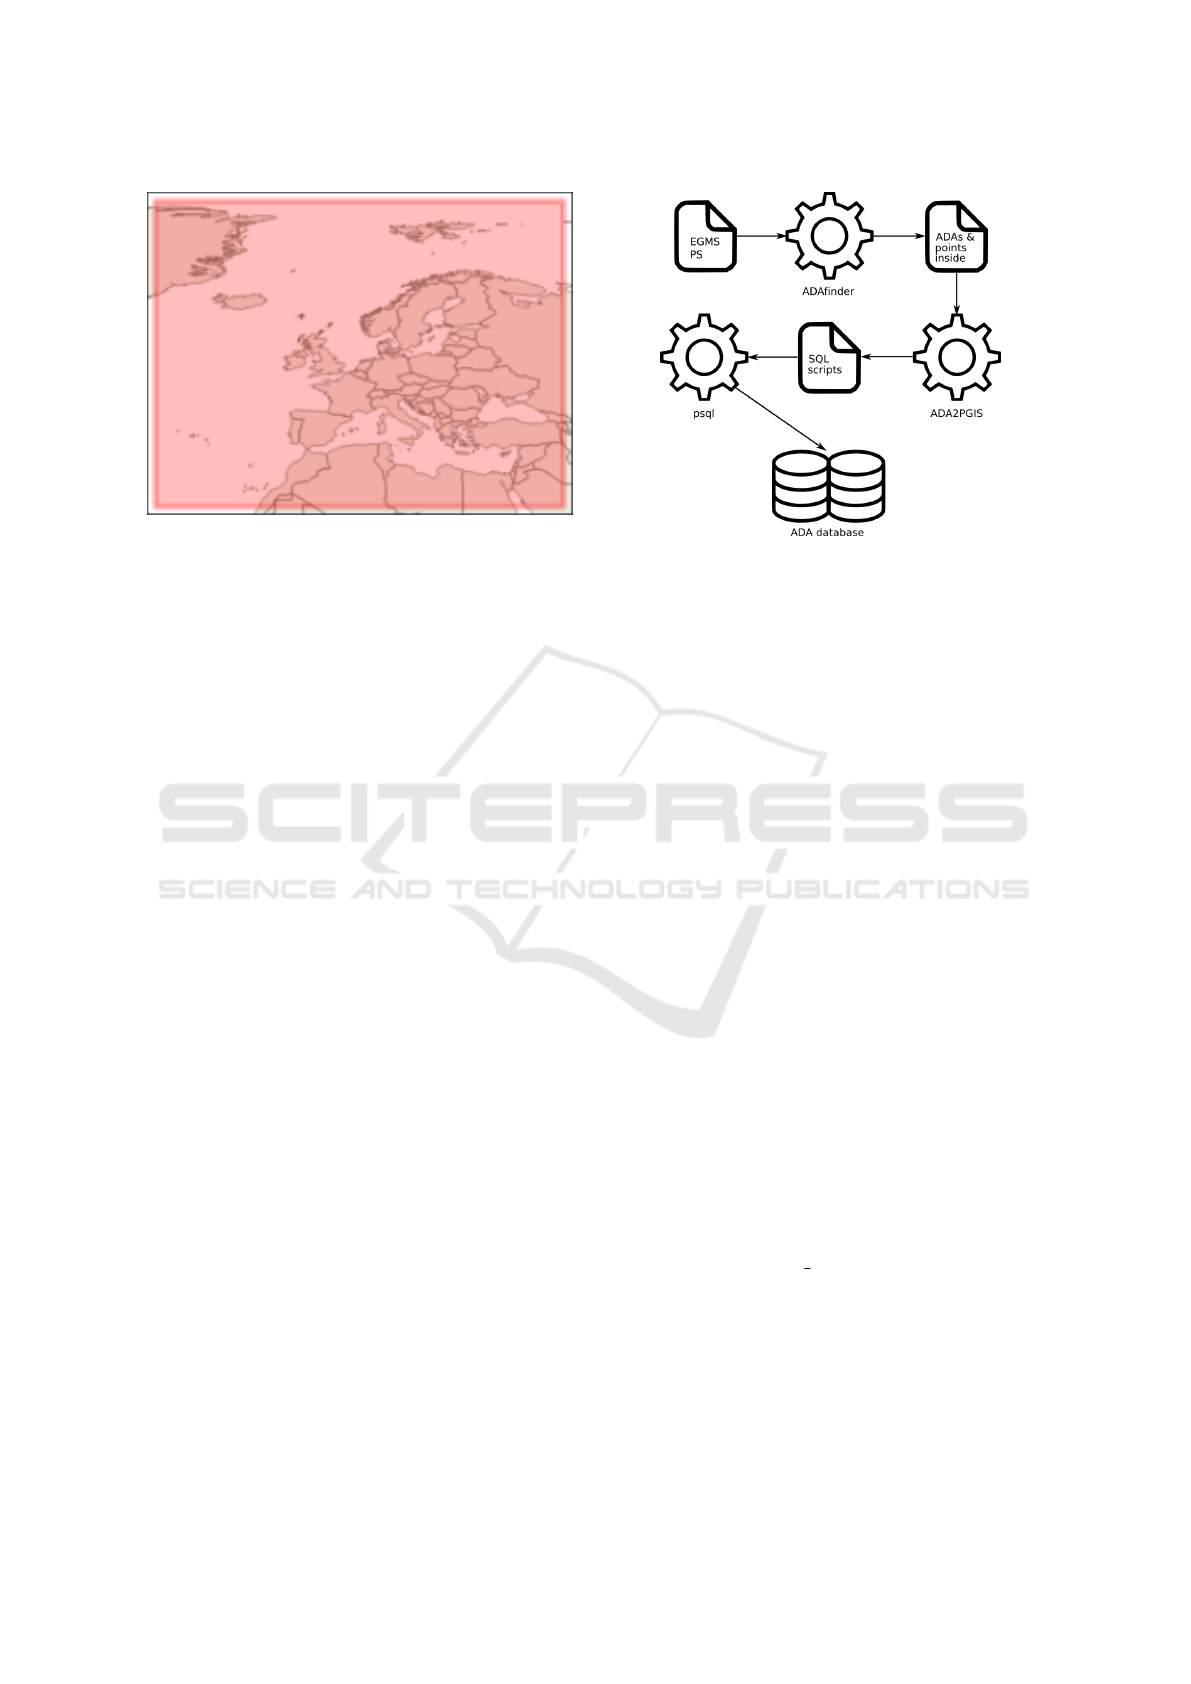
Figure 2: Coverage of the ETRS89–LAEA coordinate ref-
erence system (source: QGIS screenshot).
sets of these. In other words, an assuming that the
maximum length of all time series is n, it would be
possible to insert records in the database with only
m < n values, providing than the remaining n−m ones
are set to null.
The ETRS89-LAEA is the coordinate reference
system (CRS) used to represent the ADA. It is valid
for all Europe (see Figure 2) and it is the one used
by the EGMS to deliver the files with the PS. Using
a CRS covering the whole extent of the work area is
very important, since it makes possible the use of a
single ADA layer in the WebGIS without needing to
resort, for instance, to converting all data to WGS84.
Note that having just one layer for ADAs in the Web-
GIS is not only convenient but also, it could be said,
a must, in order to avoid a cluttered interface. In
short, the final user will not be forced to select among
a (probably very) long list of layers to visualize the
area of his/her interest. With just a single layer, only
zooming or panning operations will be required to
display such area(s).
4 THE DATA PRODUCTION
WORKFLOW
The goal of the so-called “data production work-
flow” is creating the ADA covering Europe and then
store this information in the ADA database man-
aged by PostgreSQL–PostGIS, so it becomes imme-
diately available to the general public by means of the
GeoServer → Apache → WebGIS channel (see Fig-
ure 1 for details). Due to the extent of the work area,
this is a workflow that will be applied routinely to pro-
cess zones whose extent will be determined by that of
the PS products delivered by the EGMS.
Figure 3: The data production workflow.
These are the steps making the data production
workflow:
1. Generation of the ADAs. Its inputs are the raw
PS data provided by the EGMS. The output con-
sists of the ADAs detected in the area as well as
the points that fall inside these. This step is the
responsibility of the already mature ADAfinder
tool. Section 5.1 discusses ADAfinder in deeper
detail.
2. The ADAs thus produced must be post-processed
in order to (a) incorporate some extra information
not directly generated by ADAfinder and then (b)
create a series of SQL script files containing the
necessary instructions to insert such data into the
PostgreSQL–PostGIS database. This is the task
of a new software application, ADA2PGIS, still
under development at the moment of writing this
paper (see section 5.2 for more information about
ADA2PGIS).
3. Actual data insertion. The PostgreSQL command
line tool “psql” is then used to process the SQL
script files just generated; at this point, the ADA
created by ADAfinder are actually inserted in the
database and become automatically available for
their visualization using the WebGIS.
4. Backup. The integrity of the information thus
produced is guaranteed by regular backups using
the PostgreSQL pg dump built-in tool. For this,
the data servers already available in the company
where the authors of this article work will be used.
The ”automatic availability” mentioned in Step 3
above is achieved thanks to GeoServer. A one-time
configuration step in this tool makes possible to link
the contents of the PostgreSQL–PostGIS table with
the ADA to a WMS layer publicly available. This
An In-house, Self-developed Low-cost WebGIS Relying on Open-source and Self-made Tools to Show the Active Deformation Areas across
Europe
101

layer, when first configured, covers the whole extent
of the work area, so no manual, human intervention
is required to keep it up to date; consequently, data
becomes ready for their use as soon as it is inserted in
step 3 above.
It is worth to remark that there is a minimum of
human interaction in the whole process. Step 1 is
the one requiring more attention on the side of the
expert, since a series of sensible parameters must be
provided; nonetheless, these are stored in options files
that may be written once and reused many times for
all the PS belonging to close areas.
5 THE TOOLS
The subsections below describe the tools used to set
up the system and to implement the data produc-
tion workflow. The self-developed tools (ADAfinder,
ADA2GIS and the WebGIS) are explained in some
more depth, since information about the open-source
tools is publicly available on the Internet.
5.1 ADAfinder
ADAfinder is one of the application included in the
so-called ADAtools, a suite of tools targeted at the
identification and classification of active deformation
areas.
ADAfinder is the implementation of the method-
ology explained in (Barra et al., 2017). It is used
to identify the main areas where a displacement has
been measured by the Persistent Scatterers Interfer-
ometry (PSI) processing, relying on the informa-
tion contained in the input deformation map and as-
sessing the quality of the time series information
(i.e., spatial-temporal noise) of each ADA. Addition-
ally, ADAfinder includes the option to filter the in-
put displacement map from the isolated or potential
outlier PS. This tool allows the amount of data to be
managed in terms of both hardware space and com-
putational time to be reduced.
As inputs, ADAfinder takes either an ESRI shape-
file or a comma-separated values (CSV) text file con-
taining the deformation map—which amounts, for
each PS, for the coordinates of the point, its aver-
age velocity and the related deformation time series
measuring the movement it underwent. Addition-
ally, a series of key parameters controlling how the
detection process takes place must be provided (see
again (Barra et al., 2017) for details on such parame-
ters).
The outputs are two: on one hand the definition of
the ADAs detected by the algorithm—including the
coordinates of the contour of the area—and on the
other hand a set of PS.
The output ADAs (always in ESRI shapefile for-
mat) include, among its attributes, the results of the
quality assessment of the PS displacement time se-
ries in terms of both spatial and temporal noise, based
on simple statistical analysis of the series within each
ADA (Crosetto et al., 2020). Such assessment is rep-
resented by a four-level classification of time series
reliability of the extracted ADA, where 1 means “very
reliable”, 2 means “reliable” but an analysis of the
time series is suggested, 3 means “not so reliable”,
i.e., a deeper analysis of the said time series is neces-
sary, and 4 means “not reliable”.
For what concerns the PS output, ADAfinder al-
lows choosing between two different options, depend-
ing on the user necessities. The output can include all
the filtered PS of the area of interest or only the ones
strictly inside the ADA (the last one, being the option
used for this system). It is worth remarking that each
of the output PS keep their original deformation time
series, since these will be later used by ADA2PGIS
(see section 5.2) to compute the averaged time series
for each ADA. Points may be saved either as ESRI
shapefiles or CSV text files.
For a detailed description of the ADAfinder appli-
cation as well as of the whole set of ADAtools, please
refer to (Navarro et al., 2020). Finally,(Tom
´
as et al.,
2019) presents two use cases where ADAfinder was
used to identify active deformation areas.
5.2 ADA2PGIS
ADA2PGIS, a tool still being built by the authors of
this paper, is the second step of the data production
workflow described in section 4.
Its input are the outputs of ADAfinder, that is,
the ADA and the filtered PS located inside them.
ADA2PGIS computes, for each ADA in the input
file, the average of the deformation time series of the
points located inside them. This average becomes a
new attribute of the ADA, which, together with those
already produced by ADAfinder, constitute the in-
formation that will be inserted in the PostgreSQL-
PostGIS database.
The handling of the insertion process just men-
tioned is the second task ADA2PGIS is in charge of.
There are several ways to accomplish it, but the one
adopted by this tool is probably the simplest: writing
a series of (plain text) script files containing Standard
Query Language (SQL) instructions that will be used
as input by the PostgreSQL “psql” command line tool
to perform the actual insertion. Figure 4 depicts an
actual although mutilated SQL INSERT sentence.
GISTAM 2022 - 8th International Conference on Geographical Information Systems Theory, Applications and Management
102

INSERT INTO public.adas(
contour, n_ps, x_mean, y_mean, v_min,
v_mean, v_max, area, def_acc,
temp_class, spat_class, qi_class,
d20151117, d20151129, d20151211, ...)
VALUES(ST_GeometryFromText(
’POLYGON((429383.7500 4066977.7100,
...))’), 20, 429460.9806, 4067066.0609,
0.00, 3.68, 13.10, ...);
Figure 4: An (incomplete) example of an SQL INSERT sen-
tence.
psql --host=192.168.1.33 --port=5432
--dbname=spatialdb --username=dbins
--file=go2postgis_1.sql
Figure 5: Calling psql from a batch file.
Since each of the INSERT sentences may become
very long (the contours of the ADA may require from
a few points to scores or even hundreds of these, the
deformation time series may include more than 300
values) the size of the script files may grow very
quickly, being even impossible for the psql tool to
handle them, thus jeopardizing the actual insertion
process. To avoid this problem, ADA2PGIS creates
a variable number of output script files containing a
limited number of these sentences, a limit that may
be set by the user itself.
Finally, and to automate the process as much
as possible—thus trying to minimize the possibility
of human errors—ADA2PGIS writes a single batch
(shell) file invoking the psql tool and feeding it with
the various said SQL script files. In this way, and once
ADA2PGIS has finished, the user only needs to start
this batch job to insert the data in the database. Fig-
ure 5 depicts a single line invoking psql in the afore-
said batch file. The number of lines like this present
in the batch file will equal the number of script files
written by ADA2PGIS.
5.3 PostgreSQL and PostGIS
In (The PostgreSQL Global Development Group,
2021), PostgreSQL is defined as a powerful, open
source object-relational database system with over
30 years of active development that has earned it a
strong reputation for reliability, feature robustness,
and performance. Although not said here, Post-
greSQL is also free of charge, and it is available for
all the major operating systems (Linux, MacOS and
Windows) as well as for BSD and Solaris.
However, PostgreSQL alone does not provide
the features required to manage geographic ob-
jects nor to issue queries based on their prop-
erties, such as their location or inclusion in
some given (geographic) area. Installing the
PostGIS (PostGIS Project Steering Committee, 2021)
along with PostgreSQL not only removes these lim-
itations but also include very interesting features as
the ability to import, export or render data in a wide
range of (popular) data formats. Last, but not least,
PostGIS supports several mapping standards defined
by the OpenGIS consortium (OGC) on which many
map servers—such as GeoServer—rely; among these,
WMS and Web Feature Service (WFS), both required
by the WebGIS application (see section 5.6).
As already stated in previous sections of this pa-
per, the mission of the tandem PostgreSQL–PostGIS
is to store and deliver the information related to the
ADAs.
5.4 GeoServer
GeoServer (OSGEO, 2021) is an open-source, free
tool written in Java—therefore, available in wide vari-
ety of platforms—targeted at sharing geospatial data.
Its ability to implement standard protocols such as
WFS and WMS—among others— and to interface
with several standard data formats—among which
PostGIS is included—as well as the fact of being one
of the projects of the Open Source Geospatial Foun-
dation (OSGEO) made GeoServer the tool of choice
to work as a bridge between data (ADA stored in Post-
GIS) and the Internet (a WMS layer).
GeoServer is thus used to make ADA data stored
in the PostgreSQL–PostGIS database publicly avail-
able as a WMS layer. The symbology used to display
the ADA is defined in GeoServer too, using an SLD
style—based on the mean velocity of each ADA.
Note that the ADA layer managed by GeoServer
may be accessed by any application—such as
QGIS—implementing the WMS protocol just by con-
necting via the layer’s URL.
5.5 Apache and Tomcat
Apache (The Apache Software Foundation, 2021b) is
a seasoned, free and open-source web HTTP server
that delivers contents through the Internet. It is a
mature tool well known by its robustness and per-
formance. Since the WebGIS (see section 5.6), is an
HTML + JavaScript application that must be executed
by a web server, Apache was selected for this purpose.
Furthermore. it may be extended to run appli-
cation relying on different technologies / program-
ming languages. In this case, the application server
Tomcat (The Apache Software Foundation, 2021a) is
used—and installed as a component of Apache—due
An In-house, Self-developed Low-cost WebGIS Relying on Open-source and Self-made Tools to Show the Active Deformation Areas across
Europe
103
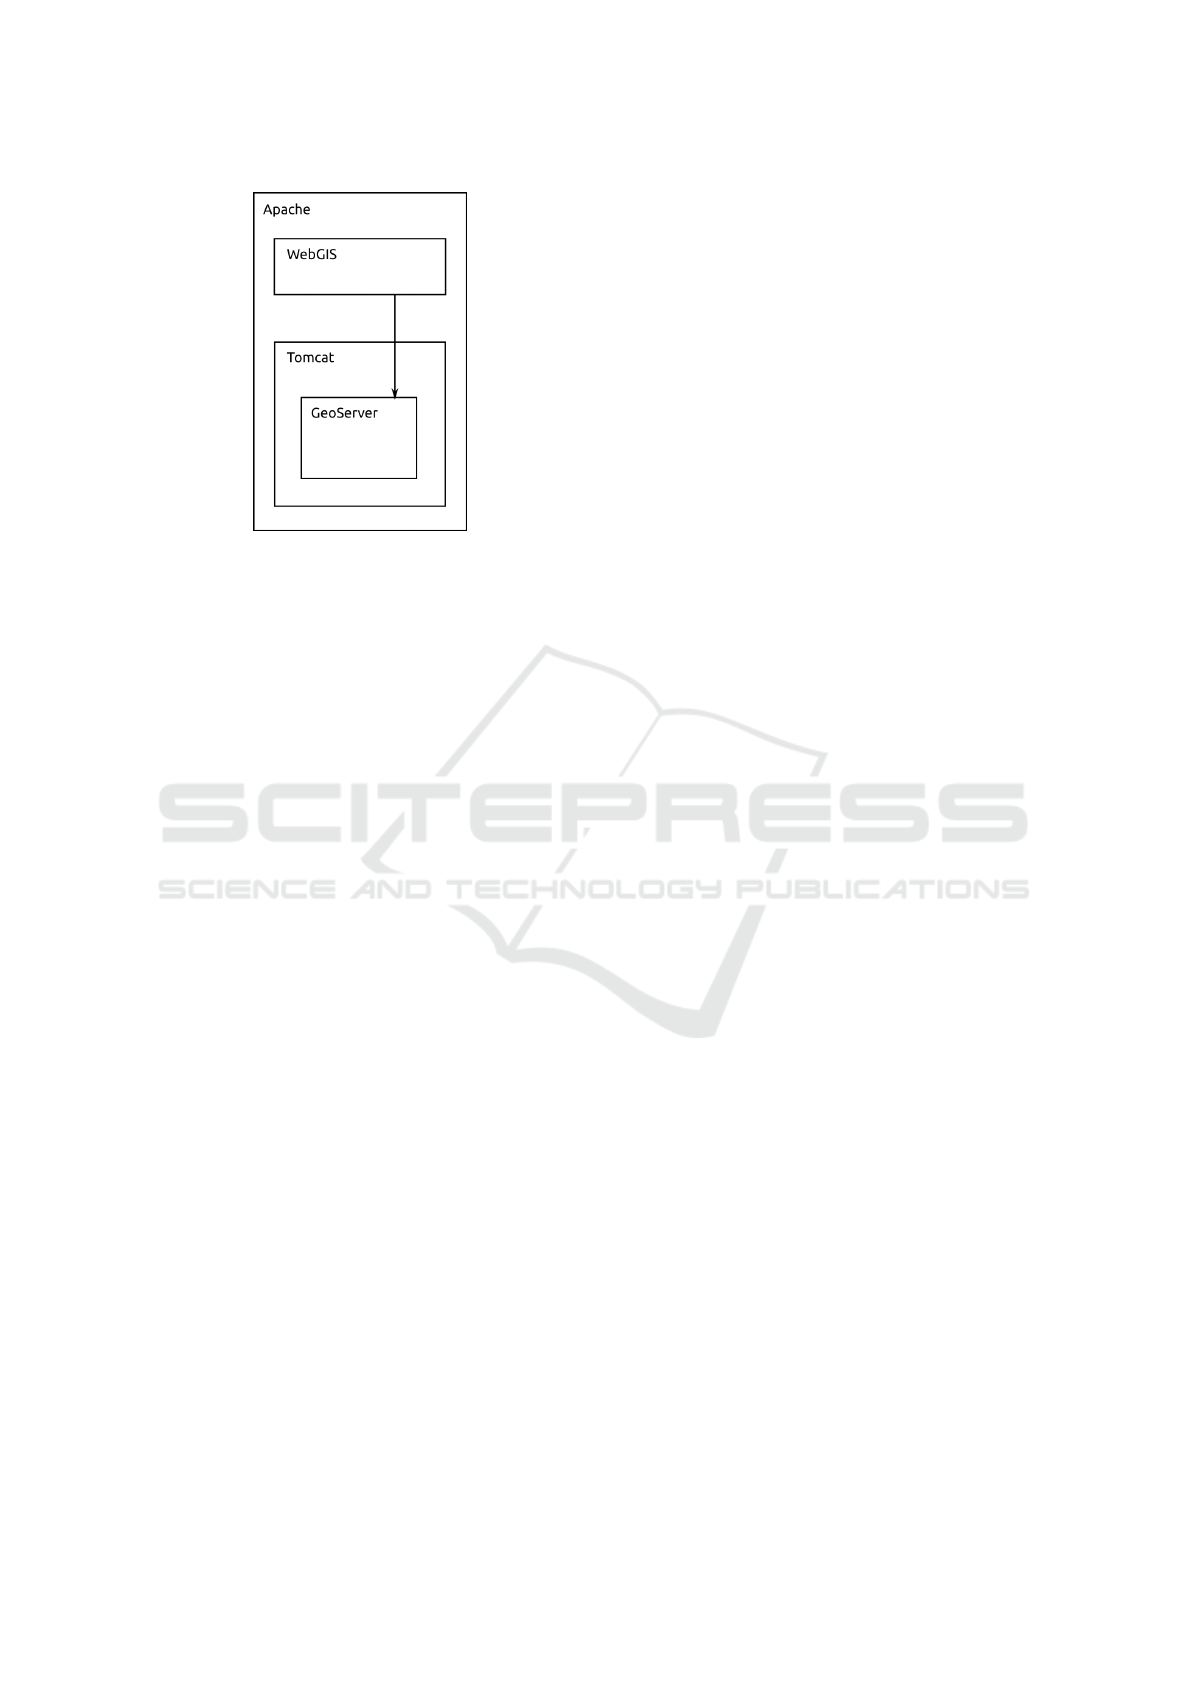
Figure 6: The data production workflow.
to its ability to run applications written in the Java
programming language—such as GeoServer.
Therefore, the goal of the Apache–Tomcat tan-
dem is twofold: executing (1) the WebGIS and (2)
GeoServer applications. Figure 6 depicts this setup.
5.6 The WebGIS (The Viewer)
The WebGIS developed for this project allows the
user to visualize and analyse ADA data from all over
Europe in an interactive environment. Access is quick
and easy using just a web browser.
For the creation of this WebGIS, the standards and
concepts of the Spatial Data Infrastructure (SDI) were
taken into account, which is a framework of poli-
cies, institutional arrangements, technologies, data,
and people that enable the sharing and effective usage
of geographic information by standardizing formats
and protocols for access and interoperability (Janssen
and Dumortier, 2007).
The visualization of the data through the WebGIS
relies on two pillars. The first is the preparation of
the data and the implementation of the WMS service
to publish them; these steps have been described in
section 4, 5.3 and 5.4. The second pillar is the devel-
opment of a web application to create the web envi-
ronment and to link it to the WMS data layers.
The following programming languages were used
to create the WebGIS: Hyper Text Markup Language
(HTML), Cascading Styles Sheets (CSS), JavaScript
and the OpenLayers library. The structure of the
viewer and the link to an external CSS style file were
created in HTML. The JavaScript code was embed-
ded into the HTML document, allowing, on the one
hand, the definition of functions that help improve the
user interface and, on the other hand, the use of the
open-source Openlayers library, whose functions al-
const osm = new ol.layer.Tile({
title: ’Open Street Map’,
type: ’base’,
visible: true,
source: new ol.source.OSM()
})
const ada = new ol.layer.Image({
title: "ADA",
visible: true,
source: new ol.source.ImageWMS({
url: ’http://localhost:8080/geoserver/ADA/wms?’,
params: {’LAYERS’: ’ada’}
})
})
Figure 7: Code for the representation of WMS services.
low visualization of interactive maps on web pages.
Two kinds of WMS layers are managed: base
maps and the ADA all over Europe. To handle their
inclusion in the WebGIS, the parameters defined in
the standards of the OGC WMS services were used.
Figure 7 shows an example depicting the code to use
the Open Street Map base map, active by default, as
well as the code to handle the ADA layer available via
GeoServer.
The WebGIS interface, see Figure 8, includes the
following basic elements: zoom (A), scale bar (B),
the map itself (C), cursor coordinates (D) and leg-
end (E). User interaction is implemented by means
of a drop-down button to choose the layers to be dis-
played, a button to download the current map view, a
box showing the attributes for the currently selected
ADA, and several filter fields to select the subset of
ADA to show.
At the time of writing this article, the WebGIS is
still under development and the authors are working
on the implementation of a chart depicting the cur-
rently selected ADA’s deformation time series.
6 PRELIMINARY BENCHMARKS
A battery of tests was run to check the performance of
ADA2PGIS and the PostgreSQL + PostGIS database
as separate components, as well as for the system as a
whole.
All tests were performed using a regular develop-
ment computer (Intel Core i7, 8 Mb RAM, 512 Mb
SSD) where all components have been installed—that
is, starting with the database manager and ending with
the WebGIS tool—which is not precisely the best con-
figuration, since a single computer is responsible of
the full workload.
Concerning ADA2PGIS, processing a set of about
456000 points (a typical data set to process at once) to
GISTAM 2022 - 8th International Conference on Geographical Information Systems Theory, Applications and Management
104
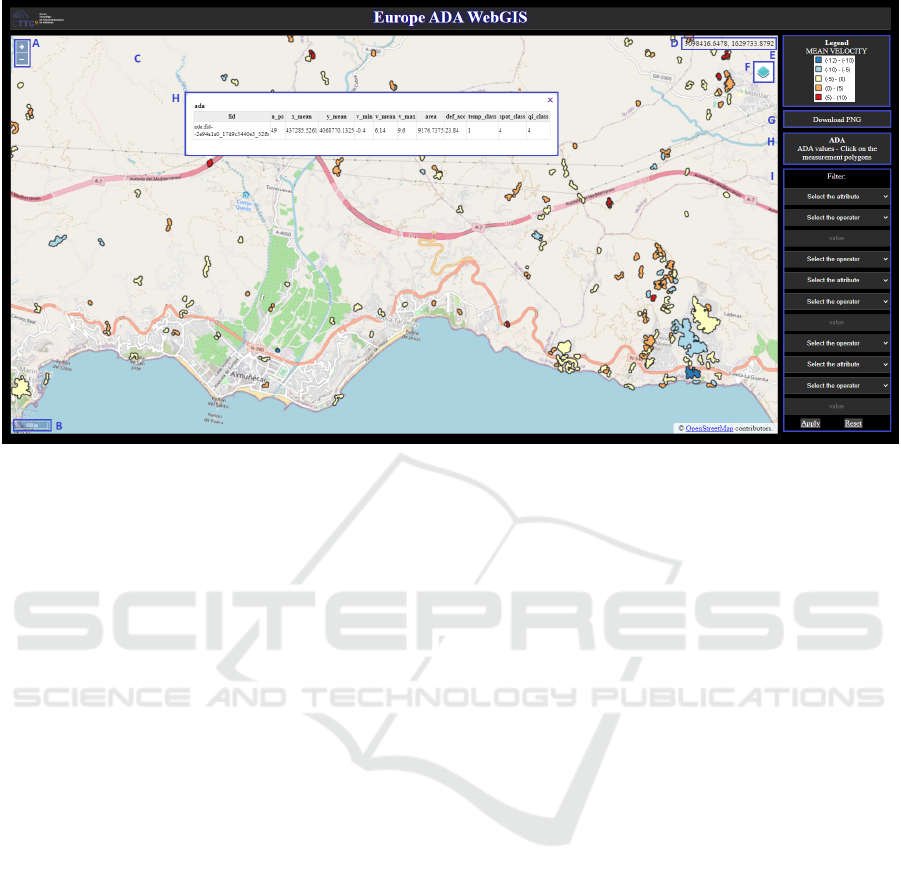
Figure 8: The overall layout of the WebGIS interface. A. Zoom. B. Scale bar. C. Map display D. Cursor coordinates. E.
Legend. F. Drop-down button. G. Download PNG. H. Get attributes table. I. Filter.
produce the SQL scripts took only 15 seconds, which
may be considered as a negligible time span from the
production routine standpoint. However, and since
the test were targeted too at evaluating the perfor-
mance of the database and WebGIS, rather big syn-
thetic data sets simulating the output of ADA2PGIS
were created. The worst one consisted of a grid of
317 × 317 ADA (making a total beyond 100.000),
each of them including a circular polygon made of
200 points and a time series consisting of 300 values.
The distance between rows and columns in the grid
was 300 m, thus covering an area of about 95.1 ×95.1
= 9044 km
2
, meaning a density of 11.1 ADA/km
2
,
which is, in average, much higher than the usual den-
sities found in this kind of situations. This synthetic
data was then uploaded to the PostgreSQL / Post-
GIS database, taking less than two minutes to com-
plete, which implies that this part of the process is
not a bottleneck neither—especially taking into ac-
count that such a big amount of data will never be
processed at once; data blocks like the one used to
check ADA2PGIS above will be the usual case.
Connecting QGIS to the database made possible
to visualize the data set as any other layer. The perfor-
mance was good; no matter the zoom level selected,
the screen was refreshed in less than 1 second. Note
that the value of the zoom level has direct implica-
tions on the number of items to display on the screen:
the closer to the terrain, the less ADA to show and
vice-versa.
The test was repeated this time using the full
setup. GeoServer was used to publish a layer with the
data in the database and then the WebGIS was used
to visualize them. In this case the performance was a
bit worse, depending on the zoom level. In the worst
cases the response time—reloading the ADA in the
area, crisp display of these—took about 4–5 seconds
at most including the update of the base map layer
(OpenStreetMap). Getting closer to the terrain made
the response times negligible.
7 CONCLUSIONS
This paper describes how not willing to face the rather
high economic requirements of a commercial, cloud
based solution for the storage and display of the ADA
covering the whole extent of Europe led to consider-
ing an in-house hosted, alternative solution relying on
open-source and self-developed tools.
Although the actual implementation of the sys-
tem’s architecture described above is still an ongoing
process, the authors have already checked the whole
concept, installing the several open-source compo-
nents (Apache, Tomcat, GeoServer, PostgreSQL +
PostGIS, WebGIS) on a regular development laptop
used in everyday routine operations. Such checks
have shown that the architecture and workflow de-
scribed in sections 2 and 4 are both feasible. Addi-
tionally, the performances reported in section 6 are
more than promising, specially taking into account
the high density of data and the setup using a single
computer to perform all the tasks involved in the tests.
An In-house, Self-developed Low-cost WebGIS Relying on Open-source and Self-made Tools to Show the Active Deformation Areas across
Europe
105

Consequently, it is reasonable to expect still better
performances when a fully dedicated, powerful server
is used to install the back-end software components.
Comparatively speaking, a system like the one de-
scribed may be considered as low-cost. Even if the
cost of such server—to be decided yet, however—
amounted to something in the range 4.000–5.000 C,
this cost is paid only once. Additionally, the com-
pany for which the authors work already has a com-
puting and data center to provide services such as data
storage, institutional and project webs, virtual private
networks, etc, and the staff to manage and maintain
these infrastructures is already on payroll; this means
that the service is reasonably guaranteed and its man-
agements costs already included in the regular ex-
penses of the company. The cloud-based solution for
which quotations were requested would imply spend-
ing a similar amount every 2–3 months. The use of
open-source, free software components has helped, of
course, to maintain this cost at so low levels.
It is important remarking the fact that the self-
developed software was already available in the case
of ADAfinder and it should have been developed at
any rate in the case of ADA2PGIS. In this last case,
and depending on how data should have been inserted
into the cloud infrastructure, a different piece of soft-
ware should have been built, but something had to be
built in all cases. The same may be said about the
WebGIS application. Consequently, the cost of in-
house software developing makes no substantial dif-
ferences between the two approaches.
It is the authors’ belief that a system like the one
described in this paper is, therefore, a viable solution,
not only from the technical but also from the econom-
ical standpoints given the infrastructure and staff con-
ditions available to the company where they work.
ACKNOWLEDGEMENTS
This work is part of the Spanish Grant SARAI,
PID2020-116540RB-C21, funded by MCIN/AEI/
10.13039/501100011033.
REFERENCES
Barra, A., Solari, L., B
´
ejar-Pizarro, M., Monserrat, O.,
Bianchini, S., Herrera, G., Crosetto, M., Sarro, R.,
Gonz
´
alez-Alonso, E., Mateos, R. M., Lig
¨
uerzana, S.,
L
´
opez, C., and Moretti, S. (2017). A Methodology to
Detect and Update Active Deformation Areas Based
on Sentinel-1 SAR Images. Remote Sensing,, 9(10).
Crosetto, M., Solari, L., Mr
´
oz, M., Balasis-Levinsen, J.,
Casagli, N., Frei, M., Oyen, A., Moldestadk, D. A.,
Bateson, L., Guerrieri, L., Comerci, V., and Andersen,
H. S. (2020). The Evolution of Wide-Area DInSAR:
From Regional and National Services to the European
Ground Motion Service. Remote Sensing, 12:2043.
Janssen, K. and Dumortier, J. (2007). Research and the-
ory in advancing spatial data infrastructure concepts.
ESRI Press, Redlands, California, 1st edition.
European Environment Agency (2021). European Ground
Motion Service – Copernicus Land Monitoring
Service. https://land.copernicus.eu/pan-european/
european-ground-motion-service. Accessed: 2021-
11-18.
OSGEO (2021). GeoServer. http://geoserver.org/. Ac-
cessed: 2021-11-18.
PostGIS Project Steering Committee (2021). PostGIS —
Spatial and Geographic Objects for postgreSQL.
https://postgis.net/. Accessed: 2021-11-18.
The Apache Software Foundation (2021a). Apache
Tomcat
©
– Welcome! http://tomcat.apache.org/.
Accessed: 2021-11-18.
The Apache Software Foundation (2021b). Welcome! –
The Apache HTTP Server Project. https://httpd.
apache.org/. Accessed: 2021-11-18.
The PostgreSQL Global Development Group (2021). Post-
greSQL: The world’s most advanced open source
database. https://www.postgresql.org/. Accessed:
2021-11-18.
Navarro, J. A., Tom
´
as, R., Barra, A., Pag
´
an, J. I., Reyes-
Carmona, C., Solari, L., Vinielles, J. L., Falco, S., and
Crosetto, M. (2020). ADAtools: Automatic Detec-
tion and Classification of Active Deformation Areas
from PSI Displacement Maps. ISPRS Int. J. Geo-Inf.,
9:584.
Tom
´
as, R., Pag
´
an, J. I., Navarro, J. A., Cano, M., Pastor,
J. L., Riquelme, A., Cuevas-Gonz
´
alez, M., Crosetto,
M., Barra, A., Monserrat, O., L
´
opez-S
´
anchez, J. M.,
Ram
´
on, A., Iborra, S., del Soldato, M., Solari, L.,
Bianchini, S., Raspini, F., Novali, F., Ferreti, A.,
Constantini, M., Trillo, F., Herrera, G., and Casagli,
N. (2019). Semi-Automatic Identification and Pre-
Screening of Geological-Geotechnical Deformational
Processes Using Persistent Scatterer Interferometry
Datasets. Remote Sensing, 11(14).
GISTAM 2022 - 8th International Conference on Geographical Information Systems Theory, Applications and Management
106
