
paMELA - Photoacoustic Melanoma Detector Design for Real-Time
Imaging of Melanin with 18 db SNR and 10 μm Precision
Elia Arturo Vallicelli
1a
, Giberto Chirico
1b
, Oliver Cosmi
1
, Lorenzo Stevenazzi
1
and Mattia Tambaro
2c
1
University of Milano, Bicocca, Milano, Italy
2
University of Padova, Padova, Italy
Keywords: Photoacoustics, Analog Front-end, Digital Signal Processing.
Abstract: This article presents the complete photon-to-bit cross-domain model of a photoacoustic melanoma detector
(paMELA), consisting of a pulsed laser, a multichannel acoustic sensor, an analog front-end and a DSP stage
for the implementation of an acoustic imaging algorithm. The photoacoustic effect can be exploited to obtain
complementary information on a suspected melanoma with respect to classical dermatoscopic techniques. By
modelling the physical phenomena (generation and propagation of the acoustic signal), electromechanical
process (pressure-voltage transduction by the acoustic sensor), the analog and digital signal processing, it is
possible to evaluate the impact of each stage on the quality of the final image. Finally, the simulation results
of paMELA allow to evaluate the performance of the detector in terms of localization precision and signal-
to-noise ratio, using both a single point-like source and a complete biological tissue phantom with different
sources sizes and features, obtaining 18 dB of SNR and 10 μm of precision in 1s acquisition.
1 INTRODUCTION
Melanoma is an aggressive malignant tumor that
initially develops on the epidermis and subsequently
expands deep into the tissues until it generates
metastases. Although it represents a small percentage
of skin cancers (<10%), it is responsible for 75% of
deaths in the entire category (Stewart, 2003). The
average onset is also young: it is the third most
frequent cancer under the age of 50 and the highest
cost in terms of years not lived. Between 2008 and
2016, melanoma represented the cancer with the
greatest annual average increase in Italy, with + 8.8%
in total in men and + 7.1% in women. If diagnosed in
the early stages, treatment involves simple surgical
excision with a 5-year survival rate of 98.4%. In the
more advanced stages, however, when the melanoma
has grown in depth to reach the dermis and lymphatic
vessels, the risk of metastasis is very high. The 5-year
survival rate drops drastically, reaching 63% if
metastases are present in the regional lymph nodes
and 22% if distant metastases are present making
a
https://orcid.org/0000-0003-0905-151X
b
https://orcid.org/0000-0001-6578-6460
c
https://orcid.org/0000-0002-7593-5084
necessary treatments that are invasive for the patient
(chemotherapy, radiotherapy) and with high costs for
health systems. An early diagnosis of melanoma is
therefore of fundamental importance in order to be
able to recognize it, have a favorable prognosis,
minimally invasive treatment and a reduction in the
associated socio-economic impact. Currently, the
screening of melanomas is carried out by a
specialized dermatologist who performs a visual
inspection of the skin nevi using the dermatoscope
(magnifying glass with polarized light, Figure (1),
evaluating their morphological aspects, that is, shape,
size and color.
In the event of a suspicious situation, surgical
removal and histological examination of the tissue
sample is carried out to assess the possible presence
of melanoma and its thickness (Figure 1). Staging is
in fact defined according to thickness since
melanomas in the initial stages are found only in the
epidermis (superficial layer), while in the more
advanced stages they begin to penetrate the dermis
(vascularized underlying layer), with the possibility
102
Vallicelli, E., Chirico, G., Cosmi, O., Stevenazzi, L. and Tambaro, M.
paMELA - Photoacoustic Melanoma Detector Design for Real-Time Imaging of Melanin with 18 db SNR and 10 m Precision.
DOI: 10.5220/0011013000003123
In Proceedings of the 15th International Joint Conference on Biomedical Engineering Systems and Technologies (BIOSTEC 2022) - Volume 1: BIODEVICES, pages 102-108
ISBN: 978-989-758-552-4; ISSN: 2184-4305
Copyright
c
2022 by SCITEPRESS – Science and Technology Publications, Lda. All rights reserved
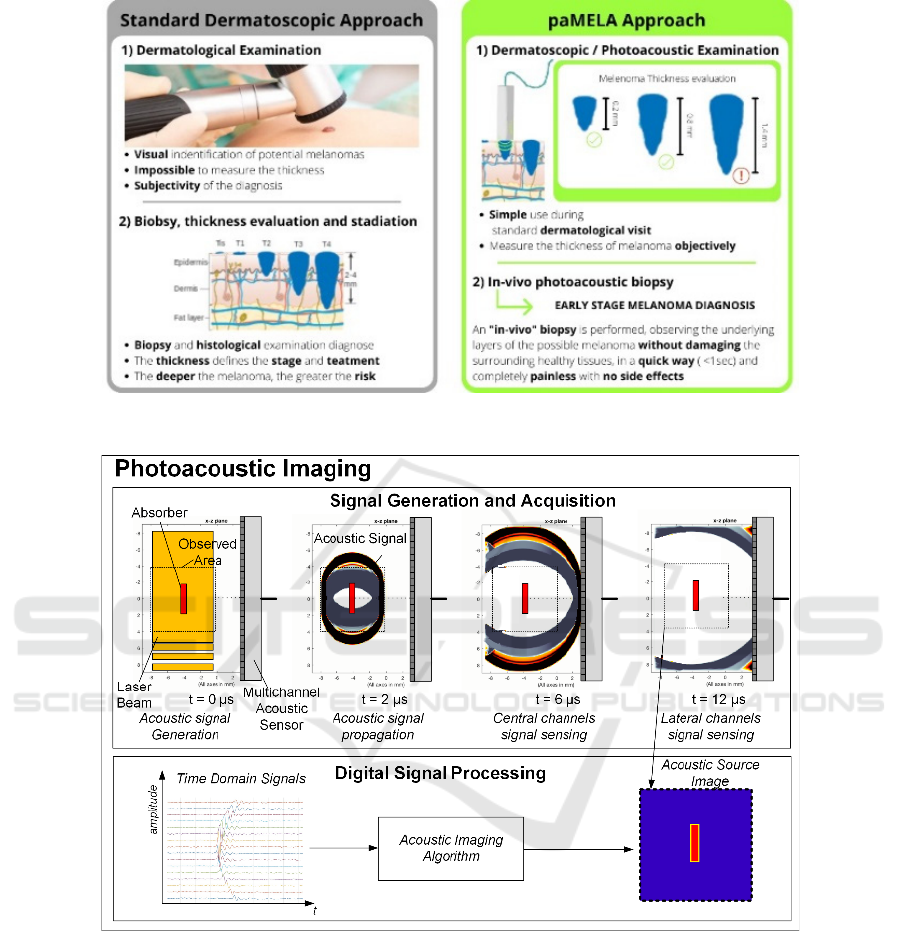
Figure 1: Comparison between standard dermatoscopic technique and photoacoustic technique.
Figure 2: Photoacoustic imaging process.
of generating metastases. It is therefore known that
measuring the thickness of melanoma is of
fundamental importance for an early diagnosis and an
effective clinical approach. However, this is not
possible with standard dermatoscopy which is limited
to observing the surface morphological
characteristics to identify suspected cases to be
surgically removed, postponing the staging to the
next histological examination and strongly depending
on the experience of the dermatologist.
An emerging alternative technique for the study
of melanomas is based on photoacoustics. When a
light pulse radiates an optical absorber, the rapid
deposition of energy generates an increase in
temperature and pressure that propagates in the
medium like an acoustic wave (Figure 2).
This acoustic wave can be acquired by a dedicated
acoustic detector to obtain information on the
absorber that generated it. By exploiting the sound
generated by a suspect melanoma it is possible to
obtain information on its morphology and in
particular on its thickness (Zhou 2014, Sinnamon
2019). With this technique, during a simple
paMELA - Photoacoustic Melanoma Detector Design for Real-Time Imaging of Melanin with 18 db SNR and 10 m Precision
103
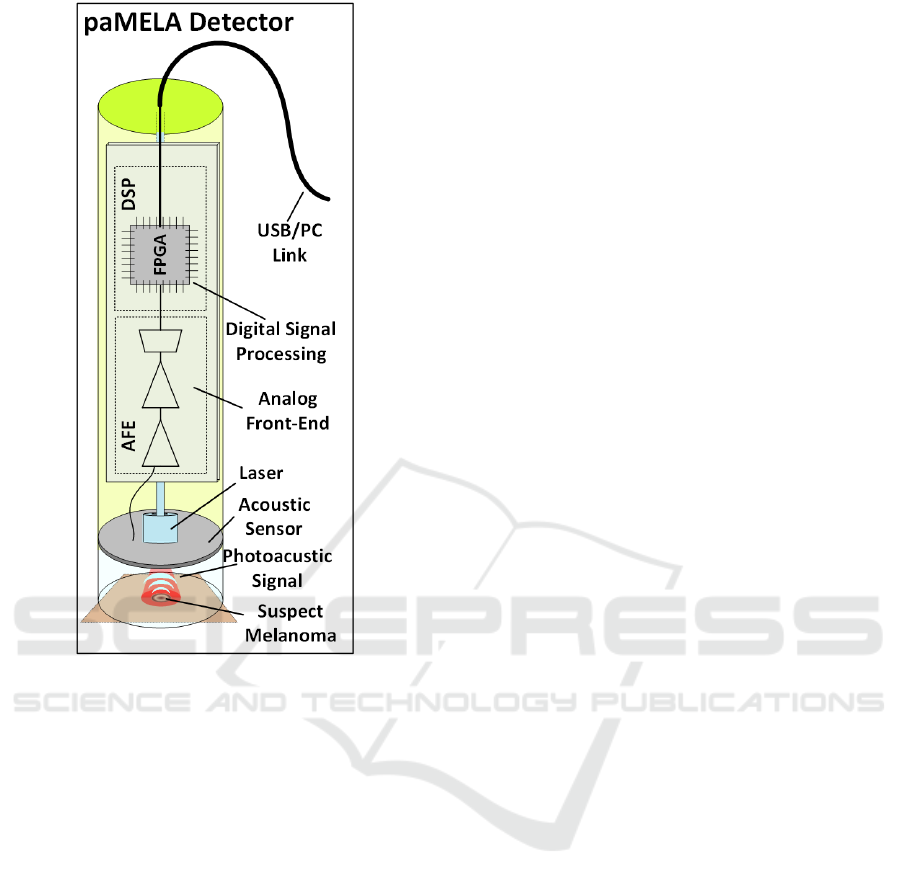
Figure 3: Block scheme of paMELA.
dermatological examination, it is possible to perform
a quick and painless in-vivo biopsy, which allows to
evaluate the actual presence and stage of melanoma
(Wang 2016, Park 2021). The photoacoustic effect
can be used to observe a wide range of biological
systems and the photoacoustic instruments currently
on the market are general-purpose to adapt to
different research needs, therefore not being
optimized for melanomas.
For these reasons, this work presents the design
and simulation characterization of paMELA
(photoacoustic melanoma detector), a compact real-
time photoacoustic detector optimized for
characterizing melanoma. This work is organized as
follows. Section II describes the design of paMELA,
Section III presents the simulation results from a
complete cross-domain model of the system and its
performance characterization. Finally, in Section IV
conclusions will be drawn.
2 PHOTOACOUSTIC
MELANOMA DETECTOR
DESIGN
Photoacoustic imaging can be obtained by several
techniques that can be summarized in two main
categories: Photoacoustic Microscopy (PAM)
exploits a single channel acoustic sensor and a
focused laser beam to perform a raster scan above the
sample and obtain a pixel-by-pixel image. Although
the instrumentation is simple, the mechanical
scanning over thousands of pixels is time consuming
(several minutes) and requires the tissue under
observation to be perfectly still for long periods, to
evitare misalignment in the picture. For this reason,
PAM is particularly suited for pre-clinical
application, but it has practical limitation as a clinical
tool. paMELA exploits a different technique, called
Photoacoustic Tomography (PAT), that by using a
multichannel acoustic sensor and dedicated acoustic
imaging algorithms can acquire a 2/3D image of the
sample without any movement of the sensor, relying
on acoustic beam steering in digital domain.
The laser beam spot is wide enough to illuminate
all the sample and for each beam pulse an acoustic
image of the whole area under observation can be
taken. The acquisition time are therefore very quick
and multiple images can be taken and averaged at a
frame rate up to thousands/sec (limited by the laser
pulse repetition rate and electronic throughput).
A block scheme of the hereby presented
photoacoustic imaging setup is shown in Figure 3. It
is composed by a pulsed laser, a multichannel
acoustic sensor (AS), an analog front-end (AFE) and
DSP stages on FPGA.
2.1 Signal Generation (Laser)
The signal is generated through the thermoacoustic
effect, where a rapid deposition of energy in a certain
volume generates an increase in localized
temperature and a consequent increase in pressure,
which propagates in space like an acoustic wave. The
deposition of energy occurs when the light pulse
produced by the laser encounters a tissue with a high
absorption coefficient (such as melanin). The melanin
inside the tissue acts as sources of an acoustic wave,
and by acquiring this signal with special multichannel
acoustic sensors (MAS) it is possible to locate the
acoustic sources and produce a 2D image of the
vascularization of the biological sample. To generate
an appreciable pressure signal, the pressure
deposition must be fast enough to comply with the
stress confinement condition, which is 20 ns for
BIODEVICES 2022 - 15th International Conference on Biomedical Electronics and Devices
104

samples of 30 μm in size. A pulse length of 15 ns has
been chosen as a tradeoff between preserving the
signal linearity by respecting stress confinement and
improving the acoustic signal amplitude which is
proportional to the energy dose deposition as in (1),
where D is the dose deposition (defined as the ratio
between energy deposition and mass of the absorber
volume) and Γ is the Grüneisen parameter, equal to
around 100 Pa/Gy for water and tissues.
𝑑𝑃 = 𝛤𝐷 (1)
A 650 nm laser diode with 10 W peak power was
used to maximize the melanin absorption. The
irradiated volume can be approximated as a cylinder
with 3 mm diameter and 1 mm thickness. This leads
to an average dose deposition of 20 mGy and 2 Pa
acoustic signal amplitude. The pressure wave then
propagates in space until it reaches the acoustic
sensor, undergoing spherical attenuation which is
proportional to the distance between the source and
the sensor (5 mm), and equal to 20 dB, thus leading
to 200 mPa signal at the sensor surface. Finally, the
frequency of the acoustic wave is linked to the
thickness of the source measured in the AS-source
direction according to equation (2).
𝑓
=
𝑐
2 𝐵𝑃
=
𝑐
2 𝑇𝐻
(2)
Thus, to achieve 30 μm resolution paMELA has
to acquire signals in the 25 MHz range.
2.2 Acoustic Signal Sensing
(Multichannel Acoustic Sensor)
The acoustic signal is acquired through a
piezoelectric sensor array that acts as a pressure-
voltage transducer through a parameter called
Sensitivity, defined in equation (3).
𝑉=𝑃·𝑆 (3)
The choice of AS depends primarily on the
frequency characteristics of the acoustic signal under
examination. In fact it is necessary to use an AS such
that its resonance frequency corresponds with the
band of the signal to be observed. The signal band in
turn depends on the size of the sources, as shown in
the previous section. Furthermore, in order to recreate
an image of the acoustic source, it is necessary to use
an array of sensors. In this way the difference in the
arrival times of the acoustic wave to the different
sensor channels can be used to locate the source in
space in 2D and to obtain an image of the same. For
this reason, a 64-channel linear array with a central
frequency of 25 MHz and 2 μV/Pa sensitivity.
Knowing the sensitivity and the electrical capacity of
each channel (calculated around 50 pF), it is possible
to calculate the output noise power (kT/C) and the
equivalent input noise of each channel, equal to 9
uVRMS and 4.5 PaRMS respectively. Considering a
64 channel array, when acoustic imaging algorithms
are applied the signals from all channels are re-phased
and added, reducing random noise fluctuation while
preserving the (deterministic) signal amplitude, thus
lowering the total noise floor by 18 dB following
equation (4), for a total of 570 mPa
RMS
:
𝑁
=𝑁
/𝑠𝑞𝑟𝑡
𝑁
(4)
This value indicates the background noise of the
sensor and is to be compared with the amplitude of
the pressure signal to obtain the SNR. It is however
possible to further lower the background noise by
acquiring and averaging multiple shots of the laser
beam.
2.3 Analog Signal Processing (Analog
Front-end)
The output signal from the acoustic sensor is typically
in the range of a fraction of uV amplitude for 200 mPa
pressure at the sensor surface and 2 uV/Pa sensitivity.
Therefore it must be amplified by about 60-80 dB
before being converted into the digital domain.
Piezoelectric acoustic sensors are typically
characterized by a very low spectral density of noise
output power, therefore they require dedicated
electronics that allow to obtain an acceptable noise
figure (NF) while preserving the signal quality. In
particular, the spectral density of noise power for the
sensor used is about 2 nV/√Hz. Commercial
operational amplifiers with BJT or JFET inputs allow
to achieve in-band noise PSD around 1 nV/√Hz, thus
achieving 1 dB NF (Vallicelli, 2020). A dedicated
Low-Pass Filter is then used to reject out-of-band
noise and interferers. Finally, ADC converts the
signal into digital domain for signal processing.
2.4 Digital Signal Processing
(Beamforming)
The DSP stages have two main goal, that are to
further improve the SNR by averaging signals from
multiple laser pulses and to implement acoustic
imaging algorithms to obtain information about the
suspect melanoma. A Delay&Sum beamforming
exploits the different acoustic wave time of arrival to
obtain an acoustic image of the source.
paMELA - Photoacoustic Melanoma Detector Design for Real-Time Imaging of Melanin with 18 db SNR and 10 m Precision
105
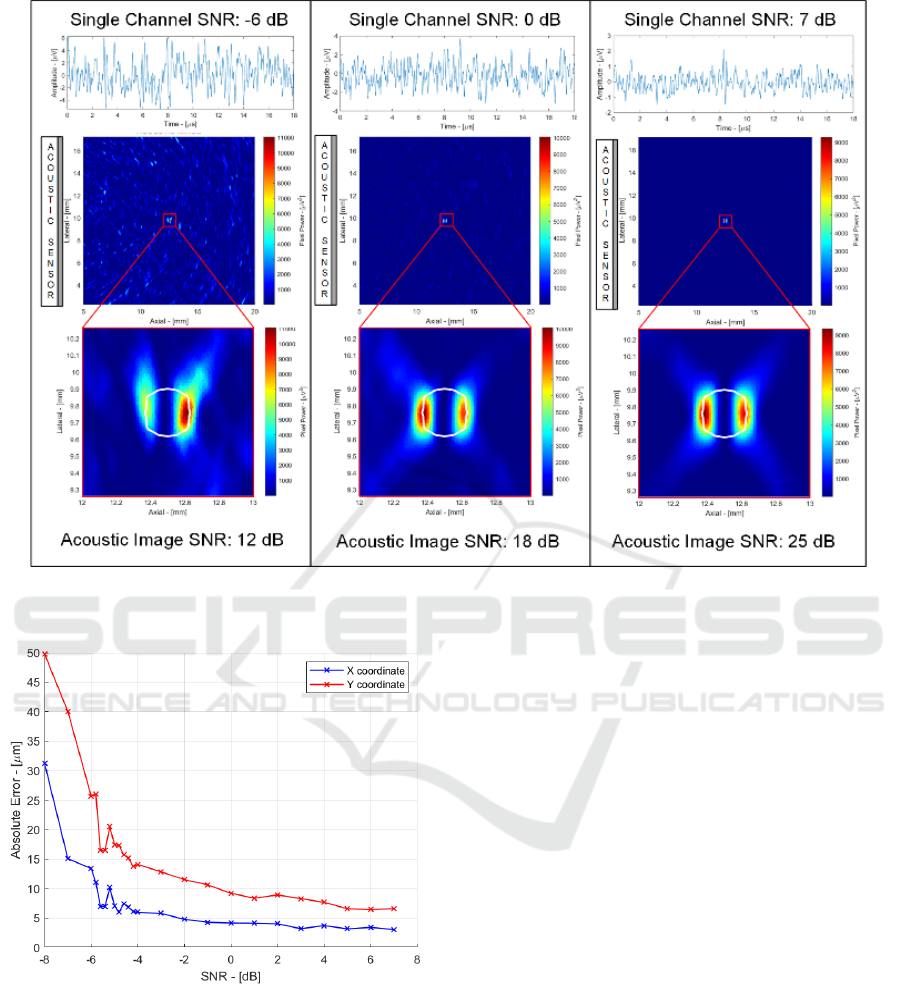
Figure 4: Single spherical source testbench.
Figure 5: Localization precision performances vs. single
channel SNR.
For every pixel of the acoustic image, the signals
from each channel are re-phased according to the
relative pixel-channel distance to highlight acoustic
sources located inside the pixel and reject other
sources by destructive interference. By repeating the
process for each pixel (changing the re-phasing
delays) an acoustic image is obtained.
3 SIMULATION RESULTS
To evaluate performance, a cross-domain model of
the whole system was made using k-Wave and
Matlab. The model includes the deposition of energy
in space due to the laser, the generation and
propagation of the acoustic wave from the source to
the sensor (including attenuation and absorption
effects), the noise power and frequency response of
the sensor and AFE and finally the A / D conversion
and DSP. This complete model allows to evaluate the
performance of the system before physically creating
it, in order to have a benchmark to validate the
performance of the setup in the future.
3.1 Point-like Source and Performance
Evaluation
To evaluate the performance of the system in terms of
resolution and SNR, a single spherical source was
considered placed in the centre of the observation area
(Figure 4). The performance of the system was
assessed in a low, medium and high SNR case to
estimate the ability of the system to locate the position
of the source (in two dimensions) and reconstruct its
dimensions (in the axial and lateral direction) (Fig. 5).
BIODEVICES 2022 - 15th International Conference on Biomedical Electronics and Devices
106
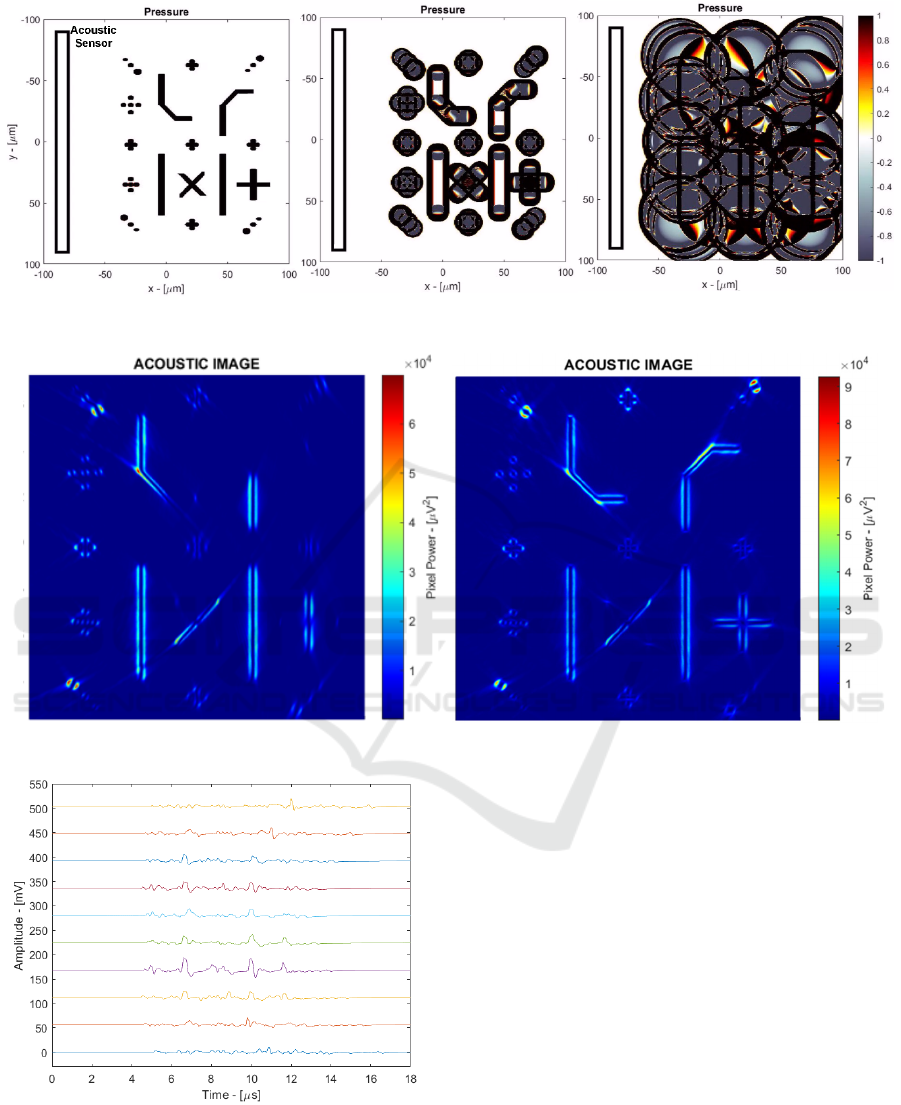
Figure 6: Time domain simulation of biological phantom.
Figure 7: Final acoustic image with linear (left) and C-shaped (right) sensor.
Figure 8: Time-domain output signals without noise (10
channels).
In Figure 4 the acoustic signal time track
(including the noise of the sensor and electronics)
acquired by the central channel of the sensor is
shown. The signal-to-noise ratio in the three cases is
-6 dB, 0 dB and 7 dB respectively. By combining the
signals of the 64 channels, an 18 dB increase in SNR
is obtained, bringing the final value in the acoustic
image to 12 dB, 18 dB and 25 dB respectively.
Looking at the acoustic images, it can be seen that in
all cases it is possible to clearly locate the source,
distinguishing it from the background noise, although
in the case of low SNR the random fluctuations due
to noise are clearly visible. It is interesting to note that
the size in the image of these random fluctuations
have dimensions comparable to the acoustic source
(and not less) due to the fact that the lowpass filter
limits the high frequency noise components, which
would in turn generate random fluctuations in the
image with a scale smaller than that of the source.
The precision in the localization of the centre of
the source was assessed by varying the SNR by
repeating 100 times the position measurement in the
presence of different noise realizations (always with
the same SNR) and calculating the variance of the
paMELA - Photoacoustic Melanoma Detector Design for Real-Time Imaging of Melanin with 18 db SNR and 10 m Precision
107

result. Figure 5 shows how the accuracy in axial (X)
and lateral localization (Y) varies with the SNR
(Vallicelli, 2021). With 1kpulse/sec, 1 second
acquisition allows averaging 1000 samples, leading to
a single channel SNR of 0 dB (18 dB final detector
SNR) and <10 μm precision.
3.2 Biological Phantom Simulation
Finally, paMELA has been validated using a
biological phantom simulation composed of several
pint-like and cylindrical sources in different locations
of the imaging area. The time domain simulation of
such testbench is shown in Figure 6 where a linear
array sensor is placed in the left. Figure 7 (left) shows
the resulting acoustic image where the D&S
algorithm highlights the edges of the pressure
sources. It is possible to observe that the sources
parallel to the sensor are clearly visible, while the
sources located at an angle are fainter. This happens
because linear sources irradiate acoustic energy
mainly perpendicular to their direction and thus most
of the acoustic wave might not be acquired by a linear
sensor. To overcome this issue, Figure 7 (right) shows
the results of a curved C-shaped sensor that improves
the angle of observation, making all the sources
clearly visible. Finally, Figure 8 shows the time-
domain signals from 10 channels (one every 6) that
have been used to generate the acoustic images.
4 CONCLUSIONS
This paper presents the preliminary design and
complete cross-domain simulation validation of
paMELA, a compact photoacoustic detector
optimized for fast melanoma imaging. Through the
complete characterization and design of dedicated
detectors it is possible to increase the performance of
these instruments to provide dermatologists with an
additional tool for the early diagnosis of melanoma.
paMELA manages to obtain a clear image of an area
of 7 mm
2
in one second, obtaining 18 dB SNR and a
precision of 10 μm using a simple laser diode of 10
W of peak power.
ACKNOWLEDGEMENTS
This work has been supported by the Proton Sound
Detector (ProSD) Project (founded by the Italian
Institute for Nuclear Physics, INFN) and the
paMELA – Photoacoustic Melanoma Detector
project (co-founded by University of Milano –
Bicocca, BiUniCrowd crowdfunding campaign and
Carolina Zani Melanoma Foundation).
REFERENCES
Stewart, B. W., & Kleihues, P. (Eds.). (2003). World cancer
report.
Zhou, Y., Xing, W., Maslov, K. I., Cornelius, L. A., &
Wang, L. V. (2014). Handheld photoacoustic
microscopy to detect melanoma depth in vivo. Optics
letters, 39(16), 4731-4734.
Sinnamon, A. J., Neuwirth, M. G., Song, Y., Schultz, S. M.,
Liu, S., Xu, X., & Karakousis, G. C. (2019).
Multispectral photoacoustic imaging for the detection
of subclinical melanoma. Journal of surgical oncology,
119(8), 1070-1076.
Wang, Y., Xu, D., Yang, S., & Xing, D. (2016). Toward in
vivo biopsy of melanoma based on photoacoustic and
ultrasound dual imaging with an integrated detector.
Biomedical optics express, 7(2), 279-286.
Park, B., Bang, C. H., Lee, C., Han, J. H., Choi, W., Kim,
J., ... & Kim, C. (2021). 3D wide‐field multispectral
photoacoustic imaging of human melanomas in vivo: a
pilot study. Journal of the European Academy of
Dermatology and Venereology, 35(3), 669-676.
Vallicelli, E. A., Turossi, D., Gelmi, L., Baù, A., Bertoni,
R., Fulgione, W., ... & De Matteis, M. (2020). A 0.3 nV/
√ Hz input-referred-noise analog front-end for
radiation-induced thermo-acoustic pulses. Integration,
74, 11-18.
Vallicelli, E. A., & De Matteis, M. (2021). Analog Filters
Design for Improving Precision in Proton Sound
Detectors. Journal of Low Power Electronics and
Applications, 11(1), 12.
BIODEVICES 2022 - 15th International Conference on Biomedical Electronics and Devices
108
