
Evaluating the Quality of Lane Change Event
Detection: Effect of Situational Variables
Merlijne Geurts
1,2
, Jeroen Hogema
1,
*
, Emilia Silvas
1,2
, Jan Souman
1
, Ashfaqur Rahman
3
and
Johannes Hiller
4
1
Integrated Vehicle Safety, TNO, Helmond, The Netherlands
2
Control Systems Technology, Eindhoven University of Technology, Eindhoven, The Netherlands
3
Assisted & Automated Driving, Jaguar Land Rover, Gaydon, U.K.
4
Vehicle Intelligence & Automated Driving, Institute for Automotive Engineering,
RWTH Aachen University, Aachen, Germany
johannes.hiller@ika.rwth-aachen.de
Keywords: Event Detection, Vehicle Driving, Intelligent Vehicles, Lane Change Detection.
Abstract: To develop safe automated driving functions, knowing road-user’s lane change behaviour is critical. This
detection problem may depend on multiple aspects such as road conditions, location, and weather. To
understand the effect of these situational variables, this work introduces a lane change detection algorithm
and assessed its performance under various light conditions, road types and weather conditions. The algorithm
was developed in L3Pilot: a large-scale European pilot project on level 3 automation. In the current study, the
algorithm was tested with data from a Dutch Field Operational Test on SAE Level 2 systems. The algorithm
was assessed against manually annotated video recordings. New is that validation was executed with Dutch
Field Operational Test data of different participants and vehicles, distinguishing three situational variables
factors. These were day vs night, motorways vs trunk roads and dry vs rain. A bootstrap procedure was used
to assess the statistical significance of differences among the conditions. The conclusion is that the algorithm
in combination with the provided data is effective in detecting lane changes when data is collected on a sample
of Dutch motorways, irrespective of light and precipitation conditions. However, the quality of the sensor
signals was worse on trunk roads, yielding significantly worse lane change detection performance (for all
light and precipitation conditions).
1 INTRODUCTION
More and more automated vehicle driving functions
are introduced and have the potential to make the
driving task easier and more relaxing, contributing to
traffic safety and efficiency (Sun et al., 2018). With
higher levels of automation, when driver is not a
backup for the automated system, it becomes
increasingly more important to ensure and certify that
these vehicles are indeed safer and more efficient.
One activity that influences traffic safety
immensely is that of lane change manoeuvres. For
example, You et al. (2015) showed that lane change
manoeuvres are responsible for almost 5% of total on-
road accidents. Therefore, in the evaluation of new
automated driving (AD) functions by means of Field
Operational Tests (FOTs), the identification of lane
*
Corresponding author
change manoeuvres plays an important role. FOTs
allow performance indicators to be assessed in
multiple real world scenarios. In this context a
scenario is defined as a use case in a specific situation,
for example vehicle driving on a motorway, without
rain during the day (FESTA, 2018). So given that a
lane change manoeuvre is conducted, it can be
investigated if this is done differently when
introducing an AD system. At the same time, one can
investigate how the frequency of occurrence of lane
change manoeuvres varies as a function of different
AD systems, allowing to evaluate their impact on
driving behaviour and safety. Such analyses are done
in post-processing; real-time detection of lane
changes is out of scope for this type of work.
In past studies, detection of lane change
manoeuvres has been performed using various types
36
Geurts, M., Hogema, J., Silvas, E., Souman, J., Rahman, A. and Hiller, J.
Evaluating the Quality of Lane Change Event Detection: Effect of Situational Variables.
DOI: 10.5220/0010998400003191
In Proceedings of the 8th International Conference on Vehicle Technology and Intelligent Transport Systems (VEHITS 2022), pages 36-45
ISBN: 978-989-758-573-9; ISSN: 2184-495X
Copyright
c
2022 by SCITEPRESS – Science and Technology Publications, Lda. All rights reserved
of data and variables therein (Das et al., 2020). Some
authors have used for example GPS data (Bogard &
Fancher, 1999), yaw rate (Miller & Srinivasan, 2005)
or degree of curvature (Koziol et al., 1999). Further,
some studies use the lateral vehicle position on the
road. For example, Xuan et al. (2006) where the
lateral position of the vehicle was determined by
means of the deviation from reference trajectories
constructed by differential Global Positioning System
(dGPS).
Lane changes have been detected in different
scenarios, e.g. Ayres et al. (2004) used yaw rate and
velocity to detect lane changes on different road
categories or Das et al. (2020) who investigated the
addition of weather variables in the lane change
detection using various machine learning techniques.
However, no studies have evaluated lane change
manoeuvre detection in more extensive scenarios
where different situational variables are considered,
e.g. weather, road category and light conditions.
Since this extension of the operational design domain
is a crucial step to enable higher levels of vehicles
autonomy, in this work a lane change detection
algorithm previously developed in the H2020 project
L3Pilot (Hiller et al., 2020) was evaluated and applied
using data from a Dutch project in which a FOT on
SAE Level 2 systems was conducted (Stapel et al.,
2021). The Operational Design Domain (ODD) of
this data set covered a wide set of driving conditions
including light conditions, road types and bad
weather. These driving conditions might influence the
data quality, and possibly also the quality of the lane
change detection. The lane change algorithm was
evaluated and validated with respect to ground truth
annotated video recordings, containing data of
multiple driving participants and vehicles in eight
different scenarios, defined by three situational
factors: light conditions (day/night), road category
(motorway or trunk roads), and rain (present or
absent). It was foreseen that due to these various
conditions, new challenges for the detection of a lane
change will appear. For example, it is possible that
due to rain, darkness or road type, the lane markings
are not detected perfectly when using a vision-based
sensor system. This could influence the quality of the
total chain assessment as bad input data will result in
bad detection output. If under certain conditions (e.g.
during rain), less lane changes are detected, it is
desired to understand and make sure that this is
indeed a change in driver behaviour in this scenario,
and not a shortcoming in detection of lane changes by
the system.
To this end, the contribution of this work is an
extended analysis of a lane change algorithm to
additional situations variables and ODD and an
identification of the boundaries of the current
detection capabilities when facing challenging or
more complex scenarios.
The paper is structured as follows. First, in
Section 2 the used lane change detection algorithm is
described. The system used for data logging and the
data sets are then introduced in Section 3. In Section
4 the lane change detection is analysed for different
variables and in Section 5 a more extensive
discussion on the results it done. Finally, in Section 6
conclusions and suggestions for future work are
presented.
2 LANE CHANGE DETECTION
ALGORITHM
The algorithm that was used to detect lane changes
(Hiller et al., 2020) detects lane changes from the ego
vehicle in post-processing, i.e., after the raw data
were collected. An overview of the algorithm is
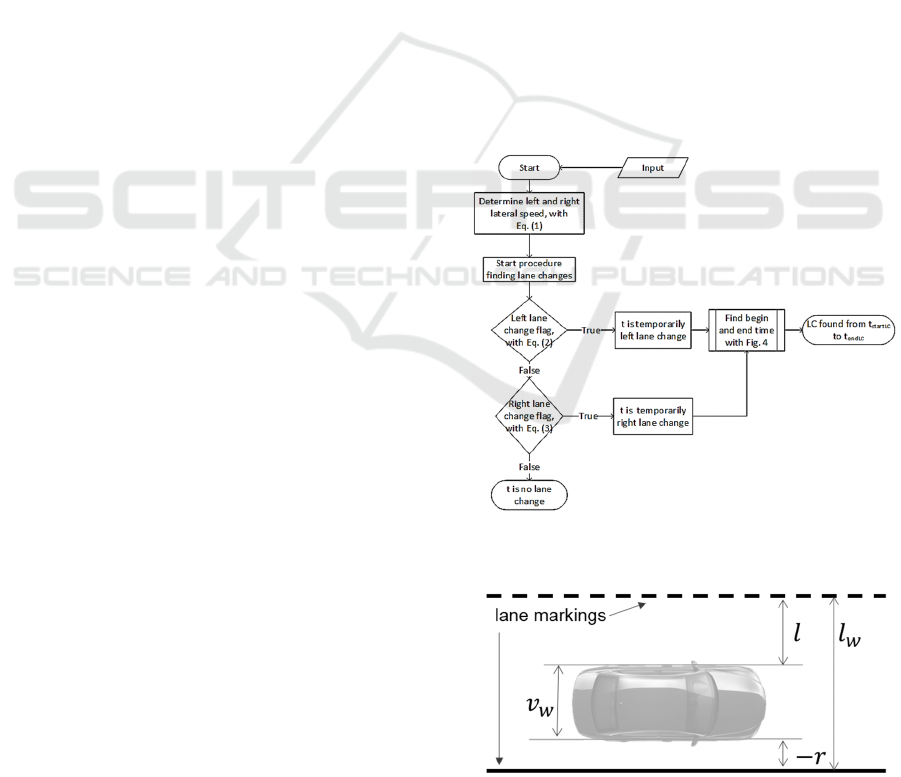
shown in Figure 1. The algorithm consists of the
following steps.
Figure 1: Overview of the lane change event detection
algorithm.
Figure 2: Measurement variables with respect to the lane.
Evaluating the Quality of Lane Change Event Detection: Effect of Situational Variables
37
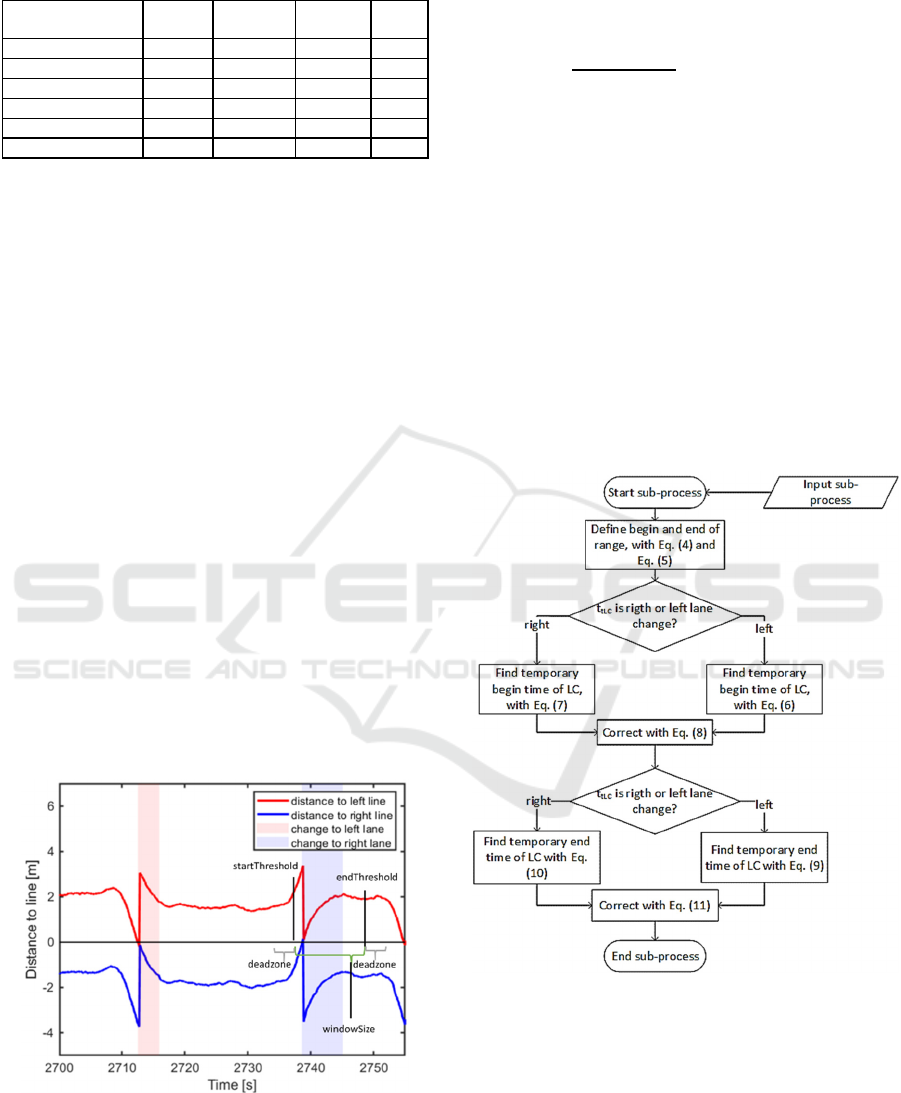
Table 1: Parameters and initial values of algorithm.
Parameter Range Initial
Value
Symbol Unit
windowSize [0,200] 100
W
[-]
startLCThreshold [0,50] 0
S
[m]
endLCThreshol
d
[0,50] 0
E
[m]
deadzone [0,10] 5
D
[-]
laneChangeSpee
d
[0,5] 2
C
[m/s]
minimalDistance [0,5] 0.2
M
[m]
1. Input:
At the start of the algorithm, the input data (i.e. lateral
distance to the left 𝑙 and right 𝑟 lane, see Figure 2)
and some parameters are loaded. The default values
of these parameters are listed in Table 1. The
parameter windowSize W represents the number of
samples used going backward or forward from a
detected lane change event. Given the 10 [Hz]
sampling frequency of the data used, the initial value
of 100 equals 10 [s]. The startLCThreshold parameter
(S in [m]) is a threshold value to detect the beginning
of a lane change in the lateral distance to a lane
marking. The endLCThreshold (E in [m]) is a
threshold value to detect the end of a lane change
from the lateral distance to a lane marking. The
deadzone D is a filter value which prevents the
algorithm from capturing spurious lane changes (i.e.,
lane changes that follow too soon on a previously
detected lane change). The initial value of 5 samples
represents 0.5 s for the data used. The
laneChangeSpeed parameter (C in [ms]) defines the
minimal lateral speed towards a lane marking for
detecting a lane change. The minimalDistance (M in
[m]) defines the minimal distance to the lane marking
for detecting a lane change (see Figure 3).
Figure 3: Visualization of the left (red) and right (blue)
distance to a road marking, including a left and right lane
change, with corresponding parameters as used in the lane
change detection algorithm (green: windowSize; gray:
deadzone; black: startLCThreshold and endLCThreshold).
To detect a lane change, first the absolute lateral
vehicle speed relative to the left, 𝑣
and right,𝑣
, lane
markings was computed by
𝑣
=
|
(
∆
)
()|
∆
, with 𝑖∈𝑟,𝑙,
(1)
where -𝑟 and 𝑙, represents the lateral distance of the
vehicle. Next, a preliminary detection of lane changes
is done for each time index t for a left lane change by:
𝐿𝐶 = 𝑙𝑒𝑓𝑡 ⇔
𝑀>𝑙(𝑡)
𝑣
(𝑡) > 𝐶
(2)
or as a right lane change with:
𝐿𝐶 = 𝑟𝑖𝑔ℎ𝑡 ⇔
−𝑀 < 𝑟(𝑡)
𝑣
(𝑡) > 𝐶
(3)
with M and C as defined in Table 1. If neither
condition did hold, then no lane change was flagged
at t.
2. Determination of start and end points of a lane
change:
Figure 4: Subcomponent of lane change detection algorithm
for determining the start and end points of a detected lane
change.
The next step was finding the begin time index
𝑡
and end time index 𝑡
of these
preliminary lane changes. This was done with the
subcomponent of the algorithm as shown in Figure 4.
This subcomponent had as input the time steps where
a lane change was detected in step 3. These time
VEHITS 2022 - 8th International Conference on Vehicle Technology and Intelligent Transport Systems
38

indices were defined as 𝑡
. For every 𝑡
, the range
(𝑡
,𝑡
) in which the real lane change was
searched was defined with:
𝑡
=𝑡
−𝑊∈
[
𝑡
,𝑡
]
(4)
and
𝑡
=𝑡
+𝑊∈
[
𝑡
,𝑡
]
,
(5)
with W as defined in Table 1. Depending on if the
event at 𝑡
was identified as a left or right lane
change, different calculations were made to find the
start time index 𝑡
of the lane change. This time
was determined with a preliminary start time index
𝑡
, which was corrected to arrive at a more
accurate estimate of 𝑡
. For a left lane change,
𝑡
was determined as follows:
𝑡
=min
…
(𝑧
>𝑆)
where 𝑧=
[
𝑧
,𝑧
,…,𝑧
,…,𝑧
,𝑧
]
=
[𝑙
(
𝑡
−𝐷
)
−𝑙
(
𝑡
−𝐷−1
)
,…,𝑙
(
𝑡
−
𝑊
)
−𝑙𝑡
].
(6)
For a right lane change 𝑡
was determined,
as follows:
𝑡
=min
,…
(𝑤
<𝑆)
where 𝑤=𝑤
,𝑤
,…,𝑤
,…,𝑤
,𝑤
=
[𝑟
(
𝑡
−𝐷
)
−𝑟
(
𝑡
−𝐷−1
)
,…,𝑟
(
𝑡
−
𝑊
)
−𝑟𝑡
]
(7)
𝑡
was updated to 𝑡
, with the ordering
index (I.e. 𝑊−𝑡
−𝐷 ):
𝑡
=𝑡
+𝑊−𝐷−𝑡
.
(8)
The next step was finding the end time index 𝑡
of the lane change. Depending if 𝑡
was a
temporarily left or right lane change, different
calculations were made to find 𝑡
. This time was
determined with a temporary end time index 𝑡
,
which was corrected to 𝑡
.
For a left lane change 𝑡
was determined, as
follows:
𝑡
=min
,…,
(
𝑞
>𝐸
)
where 𝑞=
[
𝑞
,𝑞
,…,𝑞
,…,𝑞
,𝑞
]
=
[
𝑙
(
𝑡
+𝑊
)
−𝑙
(
𝑡
)
,…,𝑙
(
𝑡
+𝐷
)
−
𝐿
(
𝑡
+𝐷−1
)
]
.
(9)
For a right lane change 𝑡
was determined, as
follows:
𝑡
= min
,…,
(
𝑝
<𝐸
)
where 𝑝=𝑝
,𝑝
,…,𝑝
,…,𝑝
,
𝑝
=
[𝑟
(
𝑡
+𝑊
)
−𝑟
(
𝑡
)
,…,𝑟
(
𝑡
+𝐷
)
−
𝑟
(
𝑡
+𝐷−1
)
].
(10)
𝑡
was corrected to 𝑡
by using:
𝑡
=𝑡
+𝑡
+𝐷−1.
(11)
3. Output:
The algorithm produced a time series with three
possible
states in each sample: no lane change, a lane
change to the right, or a lane change to the left. An
example is visualized in Figure 3. This figure shows
that during a left lane change the distance towards the
left lane marking decreases, followed by a large
increase when the vehicle enters the adjoining lane.
At the same time, the distance to the right lane
marking increases (becomes more negative) when
leaving the original lane and jumps to zero when
entering the adjoining lane. For a right lane change
this pattern is reversed. Figure 3 also shows that the
moment the car crosses the line, a lane change was
marked by a start time and an end time.
3 METHODS
3.1 Experimental Vehicles
The data used in this paper were collected during a
Dutch FOT on SAE-L2 systems, by using a video
camera-based system, the Mobileye (C-270 & ME5),
together with GPS, mounted in a passenger vehicle.
The Mobileye system was not used as input to a driver
assistance system but only as a sensor system, used to
collect (amongst others) lateral lane position data.
3.2 Collected Data
To detect lane changes several variables were
recorded with a frequency of 10 [Hz], as shown in
Figure 2. Herein, 𝑣
is the vehicle width, 𝑙 [m] the
distance to the left lane and −𝑟 [m] the distance to
right lane. When l is positive it is left of the middle,
as also indicated by the axes direction.
The complete data set contains data collected on
both motorways and trunk roads in The Netherlands.
On Dutch motorways, the lines have a width of 0.20
[m] on the outside and 0.15 [m] on lines between
lanes (RWS, 2019). On trunk roads, narrower lines
(down to 0.1 [m]) may also occur (CROW, 2013;
Schermers and Van Pettegem, 2013).
3.3 Situational Variables
Situational Variables (SVs) were recorded in the FOT
to distinguish among different environmental
conditions. The quality of data collection, by using
Evaluating the Quality of Lane Change Event Detection: Effect of Situational Variables
39
video-based sensor systems, may be different under
these SV conditions, either because visibility
conditions may be more challenging for the sensor
system, or because lane line characteristics may differ
among road categories.
The first SV was the road category, which was
determined using the logged GPS data in combination
with map matching tools. Motorways and trunk roads
were included in this work. To validate this SV, the
classification was verified by visual inspection,
crosschecking with video loggings. The second SV
was weather condition (i.e., raining vs dry) which was
determined by the activation of the wipers and visual
inspection of the video loggings. The last SV was
light conditions, i.e. driving during the day or night,
hence having the sun above or below the horizon.
This was determined in post-processing, using the
date, time and location of the vehicle in combination
with known sun rise and sun set times. When these
three SVs are combined (i.e., road category, weather
and light conditions), it leads to eight distinct
conditions where the lane changes of the ego vehicle
can be investigated (e.g., vehicle drives on a
motorway vs trunk road, with vs without rain, during
the day versus night).
3.4 Validation Data
The amount of data as used for the validation of each
combination of SVs, is presented in Table 2. All these
data were collected in different vehicles (two BMW
vehicles and one Mercedes vehicle), during different
trips (a trip is defined as the time between activating
the vehicle and deactivating the vehicle) and different
drivers (four out of twenty data loggers, where a data
logger corresponds to a certain vehicle).
Table 2: Amount of data used for detection of lane changes
for each scenario.
Scenario Number
of
vehicles
Number
of unique
trips
Annotated
time
hh:mm:ss
Rain, day, motorway 2 6 00:37:01
Dry, day, motorway 3 10 03:18:27
Rain, night, motorway 2 4 00:53:24
Dry, night, motorway 3 8 01:11:27
Rain, day, trunk road 2 6 00:29:18
Dry, day, trunk road 2 5 00:20:49
Rain, night, trunk road 2 4 00:40:43
Dry, night, trunk road 3 8 01:03:44
4 LANE CHANGE DETECTION
FOR DIFFERENT
SITUATIONAL VARIABLES
4.1 Performance Indicators
To assess the quality of the lane change detection in
the data (which may depend on the parameters listed
in Table 1 and on the SVs), the lane changes were
annotated by visual inspection of the front view
videos. This ground truth were compared with the
lane changes detected by the algorithm, by looking at
the amount of true positives (TP) (i.e. a lane change
is detected correctly), false positives (FP) (i.e. a lane
change is detected, but does not exist), false negative
(FN) (i.e. a lane change is not detected) and
confusions (conf) (i.e. a left lane change is detected
as a right lane change or vice versa).
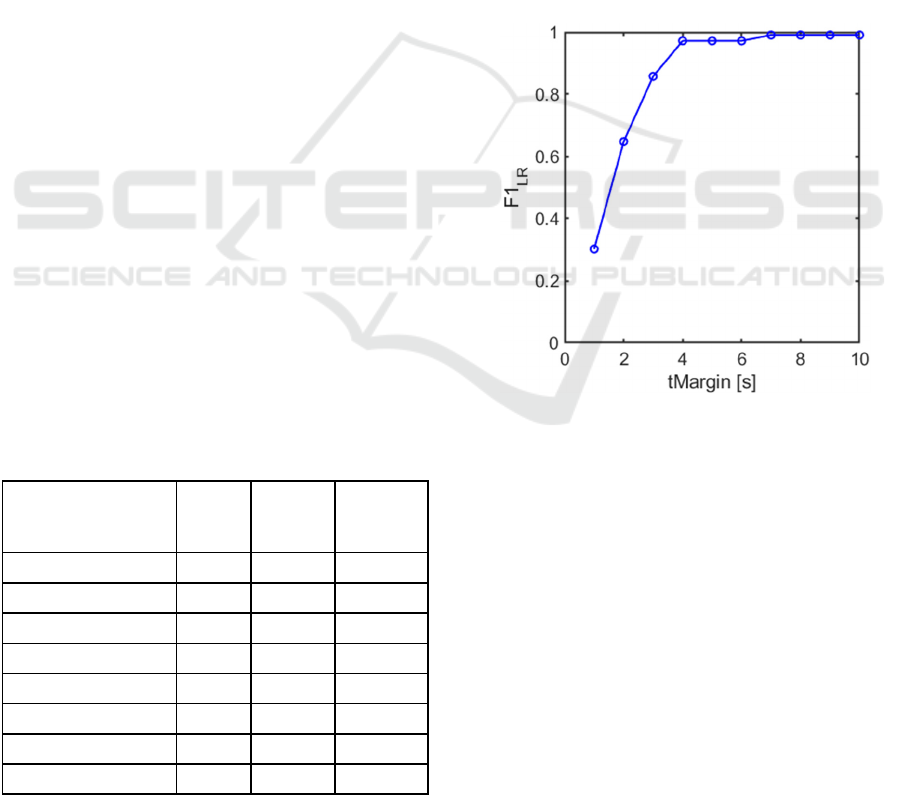
Figure 5: F1
LR
score for different time interval tMargin for
lane changes for tripid = 539 when W=100, S=0,D=5,C=2
and M=0.2.
In the annotation process, lane changes were
marked as instantaneous events with a certain time
stamp. However, in Figure 3 it was shown that the
lane change detection algorithm produces a time
interval to mark the entire lane change manoeuvre. To
make it possible to match this with the annotations,
the middle time of the interval was selected to
represent the single moment in time that reflects a
certain lane change. A detected and annotated lane
change where flagged as a true positive when the time
between the detection and annotation was less than 7
seconds (i.e.
|
𝑡
−𝑡
|
<7[𝑠]). In
Bakhit et al. (2017), Das et al. (2020), Hou et al.
(2015), Li et al. (2018) and Mandalia and Salvucci
VEHITS 2022 - 8th International Conference on Vehicle Technology and Intelligent Transport Systems
40

(2005) an interval from 1 to 5 [s] was selected.
However, in this study multiple intervals were
investigated, and the 7 [s] interval gave the best
results for F1
LR
(see Figure 5). Based on the number
of true positives, false positives, false negatives and
confusions, the quality of the lane change detection
was expressed as precision and sensitivity (for the left
and right lane separately). By calculating the
harmonic mean of precision and sensitivity, the
F1−score was calculated (Chinchor, & Sundheim,
1993). This was done for the left lane and for the right
lane separately (Eqs. (12), (13) and (14)). The newly
introduced overall algorithm detector quality called
F1
LR
score, was determined as the harmonic mean of
the left and right F1−scores (Eq. (15)).
𝑝𝑟𝑒𝑐𝑖𝑠𝑖𝑜𝑛 =
(12
)
𝑠𝑒𝑛𝑠𝑖𝑡𝑖𝑣𝑖𝑡𝑦 =
(13
)
𝐹1 =
∗∗
(14
)
𝐹1
=
∗
∗
(15)
The parameters as visible in Eq. (12), (13), (14)
and (15) were used to determine if a certain selection
of Table 1 parameters is better than the other. A
selection of parameters had a better performance,
when the scores as calculated with Eq. (12), (13), (14)
and (15), is larger than the previous set of parameters.
The selection of Table 1 parameters was done until
the values in Eq. (12), (13), (14) and (15) were at their
individual maximum. The selection of Table 1
parameters, was done by first optimizing the first
parameter (i.e. windowSize) towards the best
performance, by hand. Then the second parameter
was optimized, with a fixed first parameter. All
parameters were optimized, with fixed earlier
optimized parameters. When all parameters were
optimized, the procedure was repeated one more time
in reverse order, to be sure that the correct parameters
were selected.
The performance was also statistically validated,
by determining if the performance is significantly
better in a certain scenario. The statistical
significance of differences among F1
LR
scores values
was assessed using a bootstrap procedure as proposed
by
Keller et al. (2005). Bootstrapping is a test that
uses random sampling with replacement. Given a
certain value, which is an estimate of a sample of data,
then bootstrapping is able to assign measures of
accuracy to this sample estimate (Efron & Tibshirani,
1994). By using this method, the following
hypotheses were made:
1. H
0 = Both F1
LR
score values are equal
2. H
1 = they are not equal.
The null hypothesis was rejected when the p-value
was below 0.05.
4.2 Optimal Algorithm Parameters for
Extended Data
In this section, the selection process of the optimal
parameters for the algorithm is shown. As a remark,
the parameters were selected by using a data set
consisting of one hour driving on a motorway, during
the day with no rain. Therefore, the optimal input and
the performance of the algorithm was based on this
data set input. The algorithm had a set of default
parameters (see Table 1), the results of the default
parameters algorithm in combination with the
provided data set are shown in Table 3. A note should
be made here, the default values were selected
without any severe validation, the performance
results of the algorithm with these values, cannot be
considered as valid. The optimization process of the
parameter values resulted in the parameter values as
shown in Table 4. The results of the algorithm with
the provided data set and the new parameter values,
are visible in Table 5. When Table 5 is considered, it
is visible that sensitivity has a maximum score (i.e.
sensitivity = 1). Further, precision and F1LR
approach a maximum score (i.e. precision → 1 and
F1LR → 1). Therefore, the lane change detection
algorithm worked almost perfectly for the provided
data. The selection of parameters and the algorithm,
was validated with two other trips containing 30
minutes of data each, with 31 lane changes in total.
These trips contained data of different vehicles and
participants, to be sure that the selected values were
universal for the data as used in this verification. In
these trips the vehicle was driving during the day,
with no rain, on a motorway. Similar results to the one
in Table 5 where found (see Table 6 and Table 7). By
validating the results of the algorithm with various
data sets, it could be made sure that the found results
was not a local minimum. A note should be made
here, Table 5 shows an almost perfect result, however
the precision value is not perfect. Therefore, in the
selection of parameters a trade-off was made between
precision and sensitivity. In this process the precision
was reduced.
Evaluating the Quality of Lane Change Event Detection: Effect of Situational Variables
41

Table 3: Confusion matrix lane changes for tripid = 539,
when W=100, S=0, E=0, D=5, C = 2 and M = 0.2.
FP=False Positive; TP=True Positive; Conf=confusion
left/right.
Ground Truth
L R
Detected
1 FN 0FN
L 3FP 26 TP 0 Conf
R 1FP 0 Conf 25 TP
Precision 0.897 0.962
Sensitivit
y
0.963 1.000
F1 0.929 0.980
F1
LR
0.954
Table 4: Parameters in algorithm and selected values given
data set of tripid = 539.
Parameter Selected
value
Symbol
windowSize 100
W
startLCThreshol
d
1
S
endLCThreshol
d
0 E
deadzone 1 D
laneChan
g
eS
p
ee
d
2.2
C
minimalDistance 0.3
M
Table 5: Confusion matrix lane changes for tripid = 539,
when W=100, S=1, E=0, D=1, C = 2.2 and M = 0.3.
FP=False Positive; TP=True Positive; Conf=confusion
left/right.
Ground Truth
L R
Detected
0 FN 0FN
L 1FP 27 TP 0 Conf
R 0FP 0 Conf 25 TP
Precision 0.964 1.000
Sensitivit
y
1.000 1.000
F1 0.982 1.000
F1
LR
0.991
4.3 Statistical Analysis of Performance
It was validated if the algorithm in combination with
the provided data also works well, in other conditions,
than the ones used to optimize the parameters. The
length of data, the number of trips and vehicles, as
used for each scenario is shown in Table 2.
The F1
LR
(see Eq. (15)) of these different
conditions were determined, leading to the results as
visible in Figure 6. The bootstrap analysis yielded the
following results. First, the difference between any
Table 6: Confusion matrix lane changes for tripid = 4393,
when W=100, S=1, E=0, D=1, C = 2.2 and M = 0.3.
FP=False Positive; TP=True Positive; Conf=confusion
left/right.
Ground Truth
L R
Detected
0 FN 0FN
L 0FP 7 TP 0 Conf
R 0FP 0 Conf 7TP
Precision
1.000 1.000
Sensitivit
y
1.000 1.000
F1 1.000 1.000
F1
LR
1.000
Table 7: Confusion matrix lane changes for tripid = 5491,
when W=100, S=1, E=0, D=1, C = 2.2 and M = 0.3.
FP=False Positive; TP=True Positive; Conf=confusion
left/right.
Ground Truth
L R
Detected
0 FN 0 FN
L 0FP 8 TP 0 Conf
R 0FP 0 Conf 9TP
Precision
1.000 1.000
Sensitivit
y
1.000 1.000
F1 1.000 1.000
F1
LR
1.000
condition on the trunk road and any condition on the
motorway was statistically significant [all p < 0.005].
Secondly, within the trunk road, the situation
“rain, dark” differed from the three other situations
[all p < 0.085], showing that performance in this
condition was worse. Finally, within the motorway
condition, the situation “rain, light” differed
significantly from the three other situations [all p <
0.014]. Within the motorway scenarios, there was a
significant difference between rain versus no rain
during the day, with better performance in dry
conditions. Within the trunk road conditions, there
was a significant difference between rain versus no
rain during the night, with better performance in dry
conditions.
The reason for this could be the quality of the data.
The Mobileye system produces a confidence level
ranging from 0 (small) to 3 (high) as a quality
indicator. These data were analysed, yielding results
shown in Figure 7. This figure confirms that the
confidence level of the signals was lower on trunk
roads than on motorways. Combining these results,
VEHITS 2022 - 8th International Conference on Vehicle Technology and Intelligent Transport Systems
42
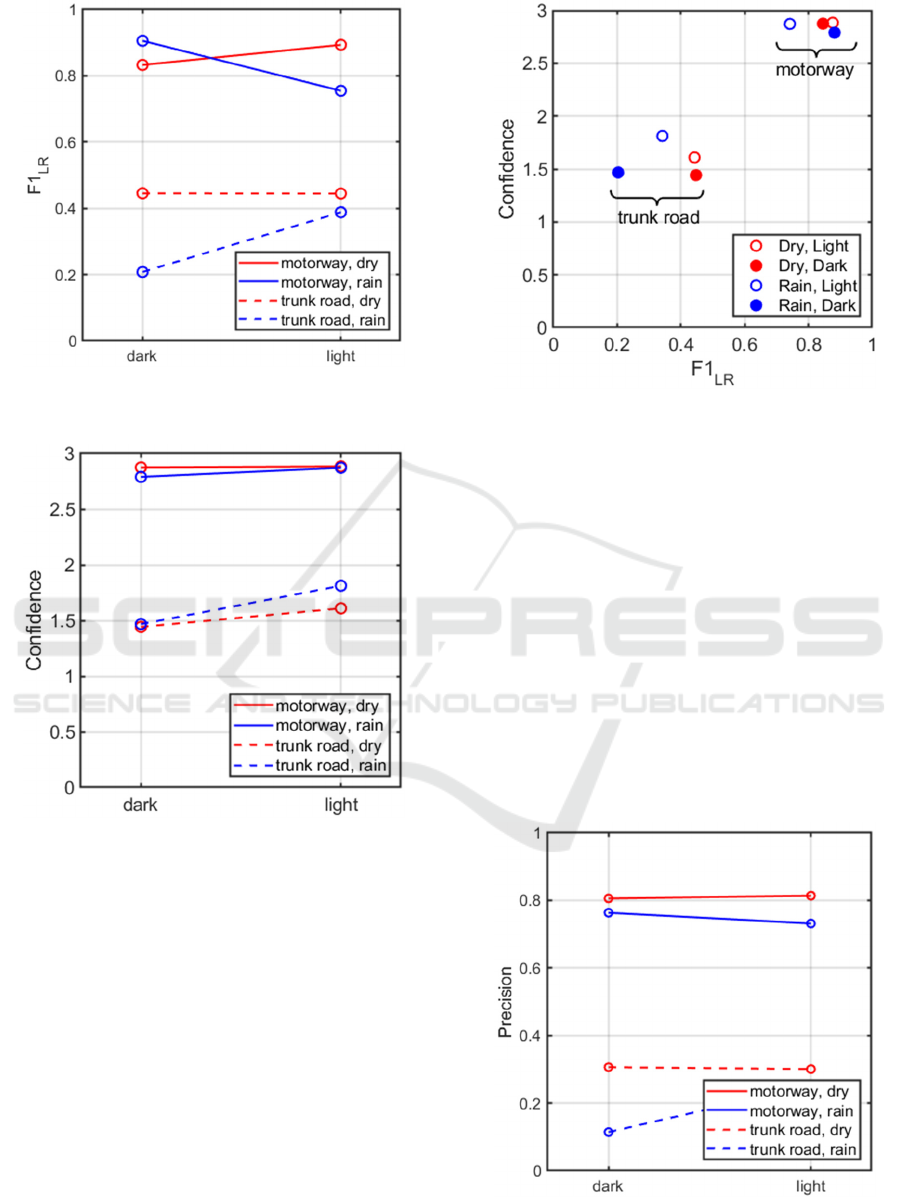
Figure 6: F1
LR
-score of lane changes detection algorithm as
a function of the Situational Variables.
Figure 7: Mean confidence levels (0-3) of the lane distance
measures as a function of the Situational Variables.
there is a clear relationship between the F1
LR
score
and the confidence level of the lane position signals
(see Figure 8). This means that if the quality of the
input to the algorithm is low, the performance of the
overall detection will reduce as well. This should be
considered when using this algorithm with low
quality data. From Figure 8 it can be concluded, if the
confidence > 2.5 then the performance of the
detection is fine. However, when confidence < 2 then
the performance will reduce.
In conclusion, the performance of the lane change
detection algorithm in combination with the provided
data, was significantly better when the data were
collected on motorways, then on trunk roads,
probably due to better lane markings. There was no
Figure 8: Mean confidence levels as a function of F1
LR
and
the Situational Variables.
overall effect of rain on the Fl
LR
score, but in half of
the road type x daylight configurations, detection
performance was significantly worse in rain
compared to dry weather (trunk roads in darkness and
motorways in daylight).
To investigate the quality of the detections further,
the precision and sensitivity were determined (taking
the harmonic mean over the left and right values).
Results are shown in Figure 9 and Figure 10. They
show that sensitivity was always higher than
precision. Also, the degradation of the detection when
comparing trunk roads to motorways was much more
severe in precision than in sensitivity. In other words,
false positives are more of an issue than false
negatives.
Figure 9: Precision of the detection algorithm as a function
of the Situational Variables.
Evaluating the Quality of Lane Change Event Detection: Effect of Situational Variables
43
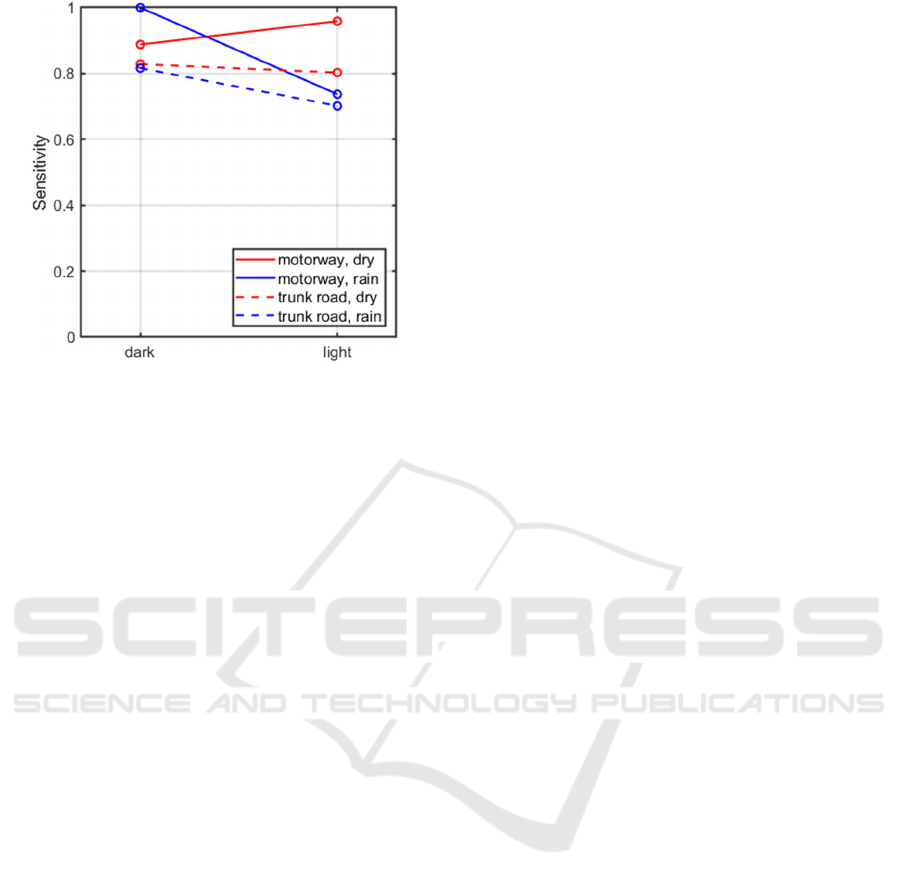
Figure 10: Sensitivity of lane changes detection algorithm
as a function of the Situational Variables.
5 DISCUSSION
In this paper a lane change detection algorithm from
the large-scale, Europe-wide, real-world pilot study
of SAE Level 3 functions was introduced and was
validated off-line with in-vehicle recorded data from
a Dutch project in which a FOT on SAE Level 2
systems was conducted (Hiller et al., 2020; Stapel et
al., 2021). The goal of this research is to answer the
question: ’Is it possible to automatically detect a lane
change event in a data set of SAE Level 2 automated
vehicles during different scenarios with different
situational variables, using the proposed lane change
manoeuvre detection algorithm?’. The input of the
algorithm are some parameters and the lateral vehicle
to road marking distance. These parameters were
optimized, by using two hours of lateral lane distance
data of a vehicle that is driving on the motorway,
during the day without rain. The selection of the
parameters, resulted in almost perfect lane change
detection. After the lane change detection algorithm
was optimized, the performance of the algorithm in
combination with the provided data was validated in
eight different scenarios (i.e. during the day/night,
with/without rain, on motorways/trunk roads). In
these scenarios, motorways lines have a width of 0.20
[m] on the outside and 0.15 [m] on lines between
lanes (RWS, 2019), whereas on trunk roads, narrower
lines (down to 0.1 [m]) may occur (CROW, 2013;
Schermers & Van Pettegem, 2013). Further, it is
assumed that a total lane change has a maximum time
of 7 [s], which is slightly larger in contrary to existing
sources which takes a time of 1-5[s] (Bakhit et al.
2017, Das et al., 2020, Hou et al., 2015, Li et al., 2018
and Mandalia & Salvucci, 2005). From the validation,
it could be concluded that the performance of the
algorithm in combination with the provided data,
works very well when using data collected on a
motorway. Results from a bootstrap procedure
showed that the detection was significantly better for
motorway data than for trunk road data. However,
when the motorway scenarios are investigated in
more detail, it could be concluded that the
performance of the algorithm in combination with the
provided data is worse, when the vehicle is driving on
a motorway during the day, with rain. Further, when
the trunk road scenarios are investigated in more
detail, the performance of the algorithm in
combination with the provided data was significantly
worse during the night, with rain. This was probably
due to bad lane detection and data quality in this
specific scenario. There was a strong correlation
between the quality of lane change detection and the
quality of the lane position signals, as expressed in the
confidence levels provided by the MobilEye system.
This is in line with findings from Das et al. (2020),
who reported reduced signal quality of a machine-
vision based lane position signal in snow or heavy
rain.
6 CONCLUSIONS
In conclusion, we have shown that the introduced lane
change detection algorithm performs excellently
under motorway conditions. However, for data from
trunk roads, lane change detection was significantly
worse. When the vehicle is driving on a trunk road,
the results of the algorithm in combination with the
data are significantly different from the results on the
motorway. Therefore, it is advised to use the current
algorithm in combination with the data for the off-line
detection of lane changes on motorways. To optimize
lane change detection on trunk roads, the key is not in
further tuning of the current algorithm but rather in
improving road marking detection and data quality
ACKNOWLEDGEMENTS
This project has received funding from the European
Union’s Horizon 2020 research and innovation
programme under grant agreement No 723051. The
sole responsibility of this publication lies with the
authors. The author would like to thank all partners
within L3Pilot for their cooperation and valuable
contribution.
VEHITS 2022 - 8th International Conference on Vehicle Technology and Intelligent Transport Systems
44

The data collection of the SAE L2 project was
done by TNO with financial and in-kind contributions
from the Dutch Ministry of Infrastructure and Water
Management, Rijkswaterstaat, RDW, AON, PON
Netherlands, BMW Netherlands and Germany, and
Athlon Carlease.
REFERENCES
Ayres, G., Wilson, B., & LeBlanc, J. (2004). Method for
Identifying Vehicle Movements for Analysis of Field
Operational Test Data. Transportation Research
Record: Journal of the Transportation Research Board,
1886(1), 92–100. https://doi.org/10.3141/1886-12
Bakhit, P. R., Osman, O. A., & Ishak, S. (2017). Detecting
Imminent Lane Change Maneuvers in Connected
Vehicle Environments. Transportation Research
Record: Journal of the Transportation Research Board,
2645(1), 168–175. https://doi.org/10.3141/2645-18
Bogard, S., & Fancher, P. (1999). Analysis of Data on
Speed-Change and Lane-Change Behavior in Manual
and ACC Driving ( DTNH22-94-Y-47016). Ann Arbor,
MI: University of Michigan Transportation Research
Institute.
Chinchor, N., & Sundheim, B. (1993). MUC-5 Evaluation
Metrics. In Fifth Message Understanding Conference
(MUC-5): Proceedings of a Conference Held in
Baltimore, Maryland, August 25-27, 1993 (pp. 69-78).
Baltimore, Maryland: August 25-27, 1993. Morgan
Kaufmann Publishers, Inc. https://aclanthology.org/
M93-1007.pdf
CROW (2013). Handboek Wegontwerp 2013 -
Gebiedsontsluitingswegen (Publicatie 330). Ede, The
Netherlands: CROW.
Das, A., Khan, M. N., & Ahmed, M. M. (2020). Detecting
lane change maneuvers using SHRP2 naturalistic
driving data: A comparative study machine learning
techniques. Accident Analysis & Prevention, 142,
105578. https://doi.org/10.1016/j.aap.2020.105578
Efron, B., & Tibshirani, R. J. (1994). An Introduction to the
Bootstrap. Taylor & Francis.
FESTA. (2018). FESTA handbook (Version 7). Updated
and maintained by FOT-Net and CARTRE.
https://connectedautomateddriving.eu/wp-content/
uploads/2019/01/FESTA-Handbook-Version-7.pdf
Hiller, J., Koskinen, S., Berta, R., Osman, N., Nagy, B.,
Bellotti, F., Rahman, A., Svanberg, E., Weber, H.,
Arnold, E. H., Dianati, M., & De Gloria, A. (2020). The
L3Pilot data management toolchain for a level 3 vehicle
automation pilot. Electronics (Switzerland) 9(5).
https://doi.org/10.3390/electronics9050809
Hou, Y., Edara, P., & Sun, C. (2015). Situation assessment
and decision making for lane change assistance using
ensemble learning methods. Expert Systems with
Applications, 42(8), 3875–3882. https://doi.org/
10.1016/j.eswa.2015.01.029
Keller, M., Bengio, S., & Wong, S. (2005). Benchmarking
Non-Parametric Statistical Tests. In Annual Conference
on Neural Information Processing Systems, NIPS 2005
(pp. 651-658).
Knoop, V. L., Hoogendoorn, S. P., Shiomi, Y., & Buisson,
C. (2012). Quantifying the Number of Lane Changes in
Traffic. Transportation Research Record: Journal of
the Transportation Research Board, 2278(1), 31–41.
https://doi.org/10.3141/2278-04
Koziol, J., Inman, V., Carter, M., Hitz, J., Najm, W., Chen,
S., Lam, A., Penic, M., Jensen, M., Baker, M.,
Robinson, M., & Goodspeed, C. (1999). Evaluation of
the Intelligent Cruise Control system. Volume II -
Appendices (DOT HS 808 969). Cambridge, MA: U.S.
Department of Transportation.
Li, X., Wang, W., Zhang, Z., & Rötting, M. (2018). Effects
of feature selection on lane-change maneuver
recognition: an analysis of naturalistic driving data.
Journal of Intelligent and Connected Vehicles, 1(3),
85–98. https://doi.org/10.1108/jicv-09-2018-0010
Mandalia, H. M., & Salvucci, M. D. D. (2005). Using
Support Vector Machines for Lane-Change Detection.
Proceedings of the Human Factors and Ergonomics
Society Annual Meeting, 49(22), 1965–1969.
https://doi.org/10.1177/154193120504902217
Miller R., & Srinivasan G. (2005). Determination of lane
change maneuvers using naturalistic driving data. Proc.
19th Int. Tech. Conf. Enhanc. Saf. Veh. (pp. 1–5).
RWS (2019). Richtlijn Ontwerp Autosnelwegen 2019
(ROA2019, Versie 1.0). Den Haag: Rijkswaterstaat.
Salvucci, D. D. (2004). Inferring Driver Intent: A Case
Study in Lane-Change Detection. Proceedings of the
Human Factors and Ergonomics Society Annual
Meeting, 48(19), 2228–2231. https://doi.org/10.1177/
154193120404801905
Schermers, G., & Van Petegem, J. W. H. (2013).
Veiligheidseisen aan het dwarsprofiel van
gebiedsontsluitingswegen met limiet 80 km/uur (report
D-2013-2). Leidschendam, The Netherlands: SWOV.
Stapel, J., Happee, R., Christoph, M., van Nes, N., &
Martens, M. (2021). Exploration of the impact of SAE2
automation on driving behaviour: a naturalistic driving
study. In J. C. J. Stapel (ed.), On-road assessment of
driver workload and awareness in automated vehicles
(pp. 39-72). TU Delft. https://doi.org/10.4233/
uuid:746f5f73-1876-4371-b142-f0f3117ded6a
Sun, L., Zhan, W., Tomizuka, M., & Dragan, A. D. (2018).
Courteous Autonomous Cars. 2018 IEEE/RSJ
International Conference on Intelligent Robots and
Systems (pp. 663-670). https://doi.org/10.1109/
IROS.2018.8593969
You, F., Zhang, R., Lie, G., Wang, H., Wen, H., & Xu, J.
(2015). Trajectory planning and tracking control for
autonomous lane change maneuver based on the
cooperative vehicle infrastructure system. Expert
Systems with Applications, 42(14), 5932–5946.
https://doi.org/10.1016/j.eswa.2015.03.022
Xuan, Y., & Coifman, B. (2006). Lane change maneuver
detection from probe vehicle DGPS data. IEEE Intell.
Transp. Syst. Conf. (pp. 624–629).
Evaluating the Quality of Lane Change Event Detection: Effect of Situational Variables
45
