
On-development of a GDPR Compliant Graph-based Recommender
Systems
Goloviatinski Sergiy
1
, Herbelin Ludovic
1
, Jos
´
e Mancera
2 a
, Luis Ter
´
an
2 b
, Jhonny Pincay
2,3 c
and Edy Portmann
2 d
1
University of Neuch
ˆ
atel, Avenue du 1er-Mars 26, Neuch
ˆ
atel, Switzerland
2
Human-IST Institute, University of Fribourg, Boulevard de P
´
erolles 90, Fribourg, Switzerland
3
Pontificia Universidad Cat
´
olica del Ecuador, Av. 12 de Octubre 1076, Quito, Ecuador
Keywords:
Graph-based Recommender System, GDPR, Social Networks.
Abstract:
The enforcement of the General Data Protection Regulation (GDPR) in the European Union represents a chal-
lenge in designing reliable recommender systems due to user data collection limitations. This work proposes a
method to consider GDPR data with a graph-based recommender system to tackle data sparsity and the cold-
start problem by representing the data in a knowledge graph. In this work, the authors assess a real dataset
provided by Beekeeper AG, a social network company for front-line workers, to model the interactions in a
graph database. This work proposes and develops a recommender system on top of the database using the re-
quests made to Beekeeper’s REST API. It explores the API events, neither with knowledge of the content nor
the user profiles. Besides, it presents a discussion of multiple approaches for community detection algorithms
to retrieve clusters of groups or companies that are part of the social network. This paper proposes several
techniques to understand user activity and infer user interactions and events such as likes in posts, comments,
and session duration. The recommendation engine presents posts to new and existing users. Thanks to pilot
customers who provided consent to access private data, this work verifies the effectiveness of the findings.
1 INTRODUCTION
Recommender Systems (RSs) have become success-
ful in demystifying unknown user patterns, prefer-
ences and, in some cases, having a complete picture
of the user personality in the context of social net-
works. However, governments and data privacy pol-
icymakers want to change these kinds of practices to
favor user trust. Some platforms like Beekeeper AG
have been empowered users to be owners of their data.
General Data Protection Regulation (GDPR) enforces
companies who provide data services to respect user
data from users (ISO/IEC 27001, 2013). It implies
that private data can not be used anymore without any
consent in any RS design. It brings a new era of RS,
where the quality of the information about users is
scarce, no very accurate and private user data such as
a
https://orcid.org/0000-0003-3837-6524
b
https://orcid.org/0000-0002-0503-511X
c
https://orcid.org/0000-0003-2045-8820
d
https://orcid.org/0000-0001-6448-1139
location and any private profile information are out of
the equation for a feature selection for traditional RS
design (Krebs et al., 2019; Stach and Steimle, 2019;
Tejeda-Lorente et al., 2018; Monteiro Krebs et al.,
2019). It strongly implies a shift of research under this
new data protection framework, where a new series
of design techniques, algorithms, and methods need
to be developed to provide novel features and better
user experience to users in GDPR certified platforms
(Regulation, 2016; Mohallick et al., 2018; Cummings
and Desai, 2018; Crockett et al., 2018). This paper
is a case study to develop a graph RS under a GDPR
framework with the client’s consent to validate if the
RS is performing correctly in the right direction. Bee-
keeper has provided a front-line users GDPR dataset
from a worldwide company in the hospitality indus-
try. Businesses that rely on Beekeeper AG technology
empower front-liner workers to increase communica-
tions and operation efficiency.(Grossmann, 2021)
This work is structured as follows: Section 2
presents the theoretical background of this research
effort. The methods developed and applied in the ex-
Sergiy, G., Ludovic, H., Mancera, J., Terán, L., Pincay, J. and Portmann, E.
On-development of a GDPR Compliant Graph-based Recommender Systems.
DOI: 10.5220/0010993700003179
In Proceedings of the 24th International Conference on Enterprise Information Systems (ICEIS 2022) - Volume 1, pages 645-654
ISBN: 978-989-758-569-2; ISSN: 2184-4992
Copyright
c
2022 by SCITEPRESS – Science and Technology Publications, Lda. All rights reserved
645
ecution of this work are described in Section 3. Re-
sults are presented in Section 4. Section 5 finishes the
article with a summary of the work conducted and the
lessons learned.
2 MOTIVATION
This work aims to take the raw dataset provided by
Beekeeper AG containing user events and parse it
to represent it conveniently for storage in a graph
database. Social media analytics methods are used to
discover relations and patterns between users to build
a RS using collaborative filtering-based methods. It
allows connecting users who do not know each other
and recommend new posts to users interested.
Beekeeper AG struggles to understand deeper data
insights in a GDPR data context. In several cases, it
is oversimplified and can not go further than count-
ing users’ events in certain parts of the platform. In
practice, under GDPR, to understand user needs, it is
required to get feedback on the platform’s user expe-
rience or usability. It can be achieved via customer
interviews with human resources managers, who also
may not understand the final needs of their front-line
workforce. In some cases, it is impossible due to the
legal access to contact the final users of the platform.
This work considers solving the problem of find-
ing valuable features in the GDPR data context and
developing graph-based RSs. It can improve how ser-
vices under GDPR can thrive and find a clear path for
companies to evolve with some best practices to un-
derstand users and develop new features more effec-
tively. It requires understanding essential data to drive
good recommendations, acceptable results, a proper
RS evaluation strategy, and potential improvements.
Thus, the research questions for this paper are: (1)
Which metrics should be used to evaluate a RS in
a GDPR context? (2) How effective can the recom-
mender system be, based solely on user interactions?
(3) Which parts of the user behaviors can be best
exploited for our recommender engine features? (4)
Which data or other algorithms (e.g., using user his-
tory in the recommendation engine or content-based
methods) could improve the recommendations?
3 IMPLEMENTATION
The RS presented in this work aims to take advantage
of user interactions and provide value to these peo-
ple. The first idea is to suggest that other users of
the same company interact close to them in the so-
cial network but could be far away physically. The
second idea is to suggest new posts to users based
on the users’ previous interaction with similar posts
(Schall, 2015). The Beekeeper dataset contains 68
million records or user events. These events consider
the entire 725 Beekeeper API endpoints (hidden and
public) without any headers (private information like
message texts or any user data trace). Data extrac-
tion is around fourteen months of activity between
01.01.2019 and 01.03.2020 (pre-COVID time). User-
names were hashed, and in some cases, a random and
unique number was assigned to each user. After im-
porting the data, approximately 10% of the dataset’s
rows were used. It represented around 6.8 millions
out of the 68 millions provided. The database in-
cludes around 5’400 nodes with 64’000 edges repre-
senting their relations as show in Figure 1. In the orig-
inal dataset, most of the relationships were present
more than once (e.g., there were multiple rows in
the CVS file with GET as HTTP verb and conversa-
tions/{id} as a path between the same user and the
same conversation). Therefore, the Neo4j relation-
ships had an attribute “count” that had the number of
rows in the CVS dataset representing the exact rela-
tion between the same two nodes. This count attribute
allowed us to interpret it as some rating, with the in-
tuition that the more times a user had the same kind
of interaction (e.g., the same post, the more interested
this user would be).
(a) Number of nodes, by node type.
(b) Number of relations, by relation type.
Figure 1: Number of nodes and relations after importing
them in the database.
To have faster queries, the RS was implemented
using inverse relationships. Suppose the query starts
from user A indexed by a known id. The goal is to
find any user B connected with a post P. In that case,
it is faster to traverse the graph with A → P → B rather
than A → P ← B.
For example, the same relationship were imple-
mented in reverse for all User Post relationships: Post
→ User, with the count attribute of the reverse rela-
tionship being the same as for the original relation-
ICEIS 2022 - 24th International Conference on Enterprise Information Systems
646
ship. In order to use some algorithms from Neo4j’s
graph data science library that required user-user or
post-post relationships (or in general, relationships
between nodes of the same type), those relationships
were created based on the imported user-post relation-
ships. That new user-user or post-post relationships
also had a count attribute. The computation of the
count attribute is illustrated with an example on Fig-
ure 2. The letters in red represent the value of the
count attribute for each relationship.
Figure 2: Computing the count attribute of
GET POST USER relationships.
After adding these new relationships, there were
around 2.4 million relationships in our database. The
last additional computation on the graph database was
adding the “normalized count” attribute for each re-
lationship. Some algorithms use a value between 0
and 1 instead of absolute values for the count attribute
to avoid a bias towards users/posts with a bigger in-
teraction count. Therefore, for each set of outgo-
ing relationships of the same type from a node. The
maximum and minimum value of the count attribute
was found. All of those outgoing relationships got a
normalized count attribute set to a value near zero if
the count attribute was minimal and one if the count
attribute was maximal. The following formula was
used to compute this attribute for a given relationship
(Equation 1).
norm count =
count − min(counts) + 1
max(counts) − min(counts) + 1
(1)
With count being the count attribute for a rela-
tionship, min(counts) being the minimal count value
among all relationships of the same type and outgo-
ing from the same node, and max(counts) the max-
imum. The +1 in the numerator and denominator is
there to avoid a division by zero if min(counts) =
max(counts).
3.1 Ground Truth Evaluation Criteria
Although, a customer consent was given to perform a
random checks on the ground truth data. It was im-
possible to do it intuitively since the Beekeeper plat-
form does not allow these queries via API, and man-
ual access was needed, making it hard to test it across
all the users since it was not possible to check it, user
by user. Then, a pre-ground truth was built as an in-
termediate step to fine-tune our RS results. Then, ran-
dom checks can be performed on particular users in
the social network (Schr
¨
oder et al., 2011).
Common Users by Conversation. The first imple-
mented strategy was to use the endpoints of the con-
versation between users and consider that users who
have participated in the same conversations are some-
how linked together and in the same group. The
implemented algorithm to build those ground truth
groups was the following: (1) For a given user, get its
conversations to which he has relationships; (2) Sort
the conversations by the number of interaction count
(descending); (3) Extract the top N = 5; (4) Get all
other users that have relationships with those five con-
versations. When using the ordinary users by conver-
sation ground truth, all algorithms ignored relation-
ships with conversations for recommending users be-
cause the results would be biased. The mean average
precision (MAP) would be high because those rela-
tionships were used to build the ground truth.
Communities Detection. Beekeeper users may be
assigned to workgroups with the same visibility of
specific posts and comments. Then, it was essen-
tial to find those groups based on the activity of the
users. In order to have a fair estimation, Louvain’s
algorithm for community detection was considered.
The algorithm works: at each iteration, a node is re-
moved from a community. It is included in the com-
munity that yields the best modularity (ratio of ingo-
ing inner edges in a community to outgoing) gain. In
the beginning, each node forms a community on its
own, and the algorithm ends when there is no more
modularity gain (or if the modularity gain is below a
threshold value) (Zafarani et al., 2014). The Neo4j’s
Graph Data Science Library (Neo4j, 2020) is used
for the implementation of the Louvain algorithm. It
creates in-memory sub-graphs in our database with
only the nodes and the relations needed before ap-
plying the algorithm. In this case, it extracts all the
user nodes with all GET POST USER relationships.
The GET POST USER relationships between users
are used for detecting communities because it was the
most frequent relationship in our database. With this
relationship, the average clustering coefficient in the
resulting communities was the highest compared to
when it was tried with other relationships. Therefore,
while using this ground truth, all algorithms ignored
the GET POST relationship in the recommendations
to avoid a biased result that would easily give a high
MAP.
On-development of a GDPR Compliant Graph-based Recommender Systems
647

3.2 User-user Recommendations
There are multiple choices of user interactions (API
endpoints) in the dataset to compute the recommen-
dations. Each of them were analyzed in this work and
assigned a weight to each of them. The reasoning be-
hind this can be explained with the following exam-
ple. A user that creates a comment or sends a message
to another user is more “involved” in the relationship
than a simple like on a post. Table 1 shows each edge
and the weight assigned to it if clustering is required.
If done well, it would help keep the users’ privacy
intact cost-effectively and solve the data sparsity in
some of the API resources.
Table 1: Relationship type and weight for user interactions.
Relationship Type Weight
CREATE COMMENT 3
CREATE MESSAGE 3
UPDATE POST 2
EDIT COMMENT 2
SUBSCRIBE POST 1
GET CONVERSATION 1
GET MESSAGES 1
LIKE COMMENT 1
LIKE POST 1
GET POST and GET COMMENTS were not
used. As shown on Figure 1b, these two relationships
are the most frequent in our dataset, and the computa-
tion of the algorithms and graph traversal at runtime
would be too costly.
Second-level Relation Recommendations. A
second-level recommendation can open opportunities
to understand better user relations (LinkedIn, 2020).
Using our previously computed “normalized count”
relationship attribute, get the most similar users
based on the sum of those attributes among the path
in the graph from the recommendation target user
to the potential recommended user. The reasoning
behind this was that this normalized count sum
would be maximal if. For example, the posts on the
path had the maximal count (i.e., rating) from all
users on the path. With this method, second-degree
(two nodes deep in the graph) recommendations are
implemented. The idea is shown on Figure 3. For
faster queries, the relationships go from the recom-
mendation target user towards the recommended
user (LIKE POST from user to post and the inverse
relationship LIKED POST from post to user).
Equation 2 is used to compute the similarity be-
tween the recommendation target user and a potential
recommended user. With the edge weights w
i
for all
Figure 3: Second-degree User-User recommendations.
the different relationship types used, as defined in the
Table 1 and r
1
to r
4
which are the 4 relationships on
the path from the current user to the recommended
user as shown on Figure 3. Then, after computing
this similarity for all the users that had such connec-
tions (as described on Figure 3) in the graph to the
recommendation target user, the users were sorted in
decreasing order by similarity, and the top ten users
were returned.
∑
w
i
∈relationship weights
w
i
·
r
4
∑
r
i
=r
1
normalized count(r
i
) (2)
Similarities. After designing the custom similarity
measure based on second-level relationships, some
well-known similarity measures (Adamic-Adar and
cosine) for our recommendation methods were tested.
The potential recommended users are one node away
from the recommendation target user (i.e., they have
interacted with the same nodes). For the similar-
ity computation, relationships and their correspond-
ing weights from Table 1 were used with cosine simi-
larity, and those from Table 2 with Adamic-Adar sim-
ilarity (Adamic et al., 2003). The similarity given by
the algorithm was multiplied by the predefined weight
and then summed up among all used relationships
with Equation 3.
∑
w
i
∈ relationship weights
w
i
·sim(me, user) (3)
Where sim is the similarity function, and
sim(me, user) is the computed similarity between the
recommendation target user and a potential user to be
recommended. Then, after computing this score for
all potential recommended users, the top ten users or-
dered by this descending score are returned.
Adamic-Adar Similarity. The algorithm needed
user-user relationships for this similarity computation
from user-post, user-comment, and user-conversation
relationships. The following relationships were used
with the weights on Table 2. The count attributes of
the relationships were not used because this similarity
measure is based on the graph topology. Equation 4
is used to compute the similarity.
∀i 6= j : σ
AA
(v
i
, v
j
) =
∑
z∈N(v
i
)∩N(v
j
)
1
log|N(z)|
(4)
ICEIS 2022 - 24th International Conference on Enterprise Information Systems
648

Table 2: Relationship type and weight for user-user interac-
tions used with Adamic-Adar similarity.
Relationship Type Weight
CREATE MESSAGE USER 3
LIKE COMMENT USER 2
GET CONVERSATION USER 1
With v
i
being the recommendation target user, v
j
as potential user to be recommended, N(v
i
) the graph
neighbors of v
i
, N(v
j
) the graph neighbors of v
j
, z the
nodes that are both neighbor of v
i
and v
j
and N(z)
the graph neighbors of z. The Adamic-Adar similar-
ity gives higher scores to users with more neighbors in
common, but it also considers that a node with more
connections will have less weight. The reasoning be-
hind this comes from the following example in so-
cial media. Suppose two people have some friends
in common, a celebrity (i.e., highly connected node).
In that case, they will probably be less similar than
two people with a common “local” or non-celebrity
friend. Then, with this similarity function, the method
described in section section 3.2 is used to get the ten
most similar users for the recommendation target user.
Cosine similarity allows us to compare the sim-
ilarity between 2 items. In our case, the compared
items are the normalized count attributes of relation-
ships that are outgoing from users to other node types
(posts, conversations, comments). When computing
the cosine similarity between 2 users, the nodes with
which both users have interacted were considered.
Then a vector is formed for both users, containing the
normalized count attribute values. Each component
of this vector is related to both users’ same outgoing
node (post, comment, or conversation).
3.3 User-post Recommendations
For the user-post recommendations, the cosine sim-
ilarity is used. The different user-post recommen-
dations methods were evaluated. Cosine similarity
provided better results in the evaluation. It is shown
in section 4, and on Table 6. Cosine similarity was
not used to find the most similar users regarding a
recommendation target user, but rather to find the
most similar posts regarding the posts that had got
the most interactions from the recommendation target
user. Again, the similarity is computed for different
relationships with different weights and then summed
up for all different relationships. Only post-user rela-
tionships are used to find the most similar posts com-
pared to posts where the recommendation target user
had the most interactions. The formula is the same
as in section 3.2. The similarities between posts in-
stead of similarities between users are computed. Ta-
ble 3 shows which relationships were used with which
weight. Finally, algorithm 1 shows the steps towards
recommending posts to a user.
Table 3: Relationship type and weight for computing simi-
larities between posts.
Relationship Type Weight
CREATE COMMENT 3
UPDATE POST 2
SUBSCRIBE POST 1
LIKE POST 1
Algorithm 1: Post to User Recommender.
Result: Return top 10 post to a user that have not been
recommended before, ordered by the sum of the products
between cosine similarities and corresponding
relationship weights (step 2)
initialization -¿ Load a list of Relationship Types;
for each relationship in Relationship Types do
normalized posts = find 10 posts with highest normalized
count (step: 1.a);
for post in normalized posts do
similar posts = compute post similarity (step 1.b)
end
for post in similar posts do
weight = multiply the cosine similarity (step 1.c);
sum this weight with other relationship types
values(step 1.d)
end
end
return top 10 posts (step 2)
3.4 Page Rank and Cold-start Problem
One of the main advantages of the graph-based ap-
proaches is that they suffer less from the cold-
start problem. In this work, the PageRank algo-
rithm (Neo4j, 2020) was implemented from Neo4j’s
Graph Data Science Library (Neo4j, 2020). In-
side each community, found previously (i.e., only
nodes and edges inside a given community were
considered), the edges between multiple communi-
ties were ignored. Therefore, each community was
considered a subgraph formed by posts with inter-
actions exclusively with users from a single com-
munity. Then, the page rank algorithm based on
GOT POST COMMON USERS relationships which
are post-post relationships was applied. The “count”
attribute as edge weight for the page rank algorithm
was used. The “normalized count” attribute was not
used, given that a bias towards posts with frequent in-
teractions was desired. After running the algorithm
on each of the different community subgraphs, a page
rank score was provided for each post stored in the
database. It provided us with a solution to get the
most popular posts for each community. Finally, new
On-development of a GDPR Compliant Graph-based Recommender Systems
649
users with no interactions were proposed to choose
some of those posts to resolve the cold-start problem
by establishing interactions between the new user and
the chosen popular posts.
4 RESULTS
For evaluation purposes, multiple metrics were ana-
lyzed. Finally, the Mean Average Precision@K=10
(MAP@10) was selected. The reason is that the
problem in this work is related to filtering and rank-
ing tasks to display a limited number of items (i.e.,
K = 10) which are potentially the most interesting
for a user (Schr
¨
oder et al., 2011). After running the
Louvain algorithm, a total of 8 communities were de-
tected (see Table 4). Each user was assigned to a com-
munity. It considers only communities greater than
ten users to ensure that the resulting communities re-
flect their connection in the real world (e.g., the same
company or same team in the company). After ana-
lyzing the MAP results by communities (see Figure 8,
communities six and seven often have the worst re-
sults. It could mean that the limit of ten users by
communities is too low. Considering only commu-
nities with a higher threshold, such as 100 or even
a higher number of users, would represent the real
ground truth. To evaluate the quality of the commu-
nity detection and to be able to compare them with the
whole graph, three network attributes were measured:
average clustering coefficient, average path length,
and degree distribution.
Average Clustering Coefficient. The first mea-
sured network attribute was the clustering coefficient,
and for a node v it is defined in Equation 5.
C(v) =
# of connected pairs of v’s neighbors
# of pairs of v’s neighbors
(5)
The clustering coefficient can be interpreted as a
measure of how much the users are interconnected.
For each node, a clustering coefficient was computed
with the GET POST USER relation. It takes into ac-
count only the neighbors of his community. Then the
average among all nodes of a given community in Fig-
ure 4a was computed. The average clustering coeffi-
cient for the whole graph was 0.71. It was computed
by considering all neighbors of a node, regardless of
whether they were in a community or not. It means
that, on average, users inside each community are
more tightly interconnected than users in the whole
graph. It could reflect the fact that there was some in-
terconnection between users of the same community
in the real world.
Table 4: Number of users for each detected community.
Community Percentage
0 654 (27.74%)
1 388 (16.45%)
2 376 (15.95%)
3 316 (13.40%)
4 252 (10.69%)
5 271 (11.49%)
6 43 (1.82%)
7 58 (2.46%)
Average Path Length. The second measured net-
work attribute was the average shortest path length
based on GET POST USER relations between users
of the same community in Figure 4b. The average
path length over the whole graph is 2.05. It was com-
puted between all nodes in the whole graph, regard-
less of whether they were in a community or not. In-
terestingly, community four is the only one with an
average path length more significant than the whole
graph’s one. It could mean that a non-insignificant
number of users inside this community are isolated
from the rest and interact only with a few other com-
munity members.
(a) Aver. clustering coefficient for each detected commu-
nity.
(b) Aver. path length for each detected community.
Figure 4: Network attributes.
Degree Distribution. The degree distribution of the
resulting communities was also measured. Instead of
measuring the degree of each user node and summed
up the count attribute of the GET POST USER rela-
tions for each user node to take into account the in-
teraction frequency between users. At first, the de-
gree and the resulting distribution did not follow a
power-law distribution ( i.e., the red line on the de-
gree distribution plot representing the power-law fit-
ted curve had a positive slope in the log scale). Fig-
ure 5 shows that both axes have a log scale. The
ICEIS 2022 - 24th International Conference on Enterprise Information Systems
650
x axis represents the sum of the count attributes of
all GET POST USER relations, and the y axis is the
fraction of nodes that have the corresponding sum of
count attributes. Each blue dot is a given fraction of
nodes that have a given sum of count attributes. The
red line is a power-law fitted curve that became a line
because the plot’s axis is in log scale. If the slope of
the red line is negative, it means that many users have
few interactions and a few users have a lot of interac-
tions, which corresponds to a power-law distribution.
(a) Degree distribution for whole graph.
(b) Degree distribution among all communities.
Figure 5: Comparison of the degree distribution between
whole graph and among all communities.
Figure 5a shows the sums of the count attribute of
GET POST USER relations were taken between each
interconnected node. Figure 5b shows the relations
that were between two users of the same community.
The communities reflected have the same interaction
behavior between users as in the graph.
4.1 User-user Recommendation MAP
This section presents the results of MAP@10 for user-
user recommendations based on two distinct ways to
get the ground truth: the first was using users that a
given user has interacted with in the same conversa-
tions, and the second was using detected communities
with the Louvain algorithm.
Common Users by Conversation Ground Truth.
Table 5 compares the average MAP@10 overall com-
mon conversation groups for each recommendation
technique used: cosine similarity, Adamic Adar sim-
ilarity, and second level relations. In this case, the
second level recommendation had the best results
(MAP@10 of 0.15) followed by cosine similarity
(MAP@10 of 0.11). Nevertheless, those MAP@10
values are notably low. Those results could mean a
low correlation between relationships from users to
conversations and relationships from users to other
entities.
Table 5: User-User MAP@10 recommendation results by
algorithm, ground truth: common users among top 5 con-
versations.
Method MAP@10 Score
Cosine similarity 0.11
Adamic-Adar similarity 0.05
Second level 0.15
Figure 6a shows the MAP@10 value for co-
sine similarity recommendation when only one re-
lation was used. Figure 6b shows the number of
users that have participated in a conversation (501
users) in our dataset that had a given relation. Fig-
ure 6a shows that mostly all relations, when used
exclusively, have poor results (MAP@10 value of
0.0 for SUBSCRIBE POST and UPDATE POST,
around 0.05 for LIKE COMMENT, LIKE POST and
GET COMMENTS), only CREATE COMMENT
has slightly better results (MAP@10 of 0.17). Fig-
ure 6b shows that the MAP@10 value of 0 for
SUBSCRIBE POST and UPDATE POST can be ex-
plained by the fact that among users that have
participated in conversations, only 3 had SUB-
SCRIBE POST relations and 5 UPDATE POST re-
lations, this means that there is not enough data to use
those relations in our recommendation algorithms.
(a) User-User MAP@10 cosine similarity by relation,
ground truth: common users among top five conversations.
(b) Number of users having a type of relation among users
participating in conversations.
Figure 6: Comparison of user recommendation MAP@10
by relation, with number of users having the relation.
On-development of a GDPR Compliant Graph-based Recommender Systems
651

Finally, one can conclude that there are no
significant correlations between relations related to
conversations and other relations. Only CRE-
ATE COMMENT has a slight correlation. It could be
explained by the fact that two users commenting on
the same post could lead them to start a conversation
about a similar topic. Users who invest in social me-
dia actively commenting participate in conversations
instead of users who only read posts without partici-
pating actively.
Communities as Ground Truth. Figure 7 com-
pares the average MAP@10 overall communities
for each recommendation technique used: cosine,
Adamic-Adar, and second level relations. The co-
sine similarity had the best results (0.8), but the sec-
ond level relations results are not much worse (0.74).
The interest of the second level relations recommen-
dations is that the recommended users have never in-
teracted with the user for whom the recommendations
are made. Therefore this kind of recommendation
could lead to more “discoveries” of new users. In
contrast, the cosine similarity recommendation out-
puts users who have interacted on the identical posts,
conversations, comments, and the user for whom the
recommendations are made have already seen those
recommended users before on social media. There-
fore, a combination of cosine similarity and second
level relation recommendation. For example, some
interleaving of top five from both methods or top five
from one method followed by a top-five from the
other would be a better solution for user-user recom-
mendations. The cosine similarity would recommend
users who have interacted on the same content as the
user for which the recommendations are made, and
those users could seem familiar. On the other hand,
the second-level relation recommendation users have
never interacted on the same content as the user for
which the recommendations are made. However, they
potentially share the same interests without seeming
familiar, and maybe those users would never have
been discovered in another way (e.g., seeing them on
a joint post).
Table 6: User-User MAP@10 recommendation results by
algorithm, ground truth: Louvain community detection on
GET POST.
Method MAP@10 Score
Cosine similarity 0.80
Adamic-Adar Similarity 0.70
Second level 0.74
Figure 7a shows the MAP@10 value for cosine
similarity recommendation when only one relation
was used. Figure 7b shows the number of users
that belong to a community in our dataset that had a
given relation. Figure 7a could be interpreted as the
following. It shows us which relations are more “inti-
mate” and are made mainly inside a given community
(those that have the highest MAP@10 values), and
which relations are less “intimate” and are made with
more posts from different communities (those that
have the lowest MAP@10 values). Figure 7b could
nuance the interpretation of Figure 7a: the relations
SUBSCRIBE POST and UPDATE POST have the
lowest number of users that have interactions of this
kind (Figure 7b), and at the same time, they give the
lowest MAP@10 value (Figure 7a). It could mean
that for those two relations, the MAP@10 value
could not be significant enough to interpret which
relations are mostly made inside a fixed group. SUB-
SCRIBE POST seems logical that this relationship is
not “intimate” and reserved for only one community.
Nevertheless, for UPDATE POST, it seems strange
because this relation seems more “intimate,” and
we could intuitively think that most users update
only a handful of posts shared with the same users
(i.e., the same community). Finally, the relations
with comments occur more often in a single com-
munity (CREATE COMMENT, LIKE COMMENT,
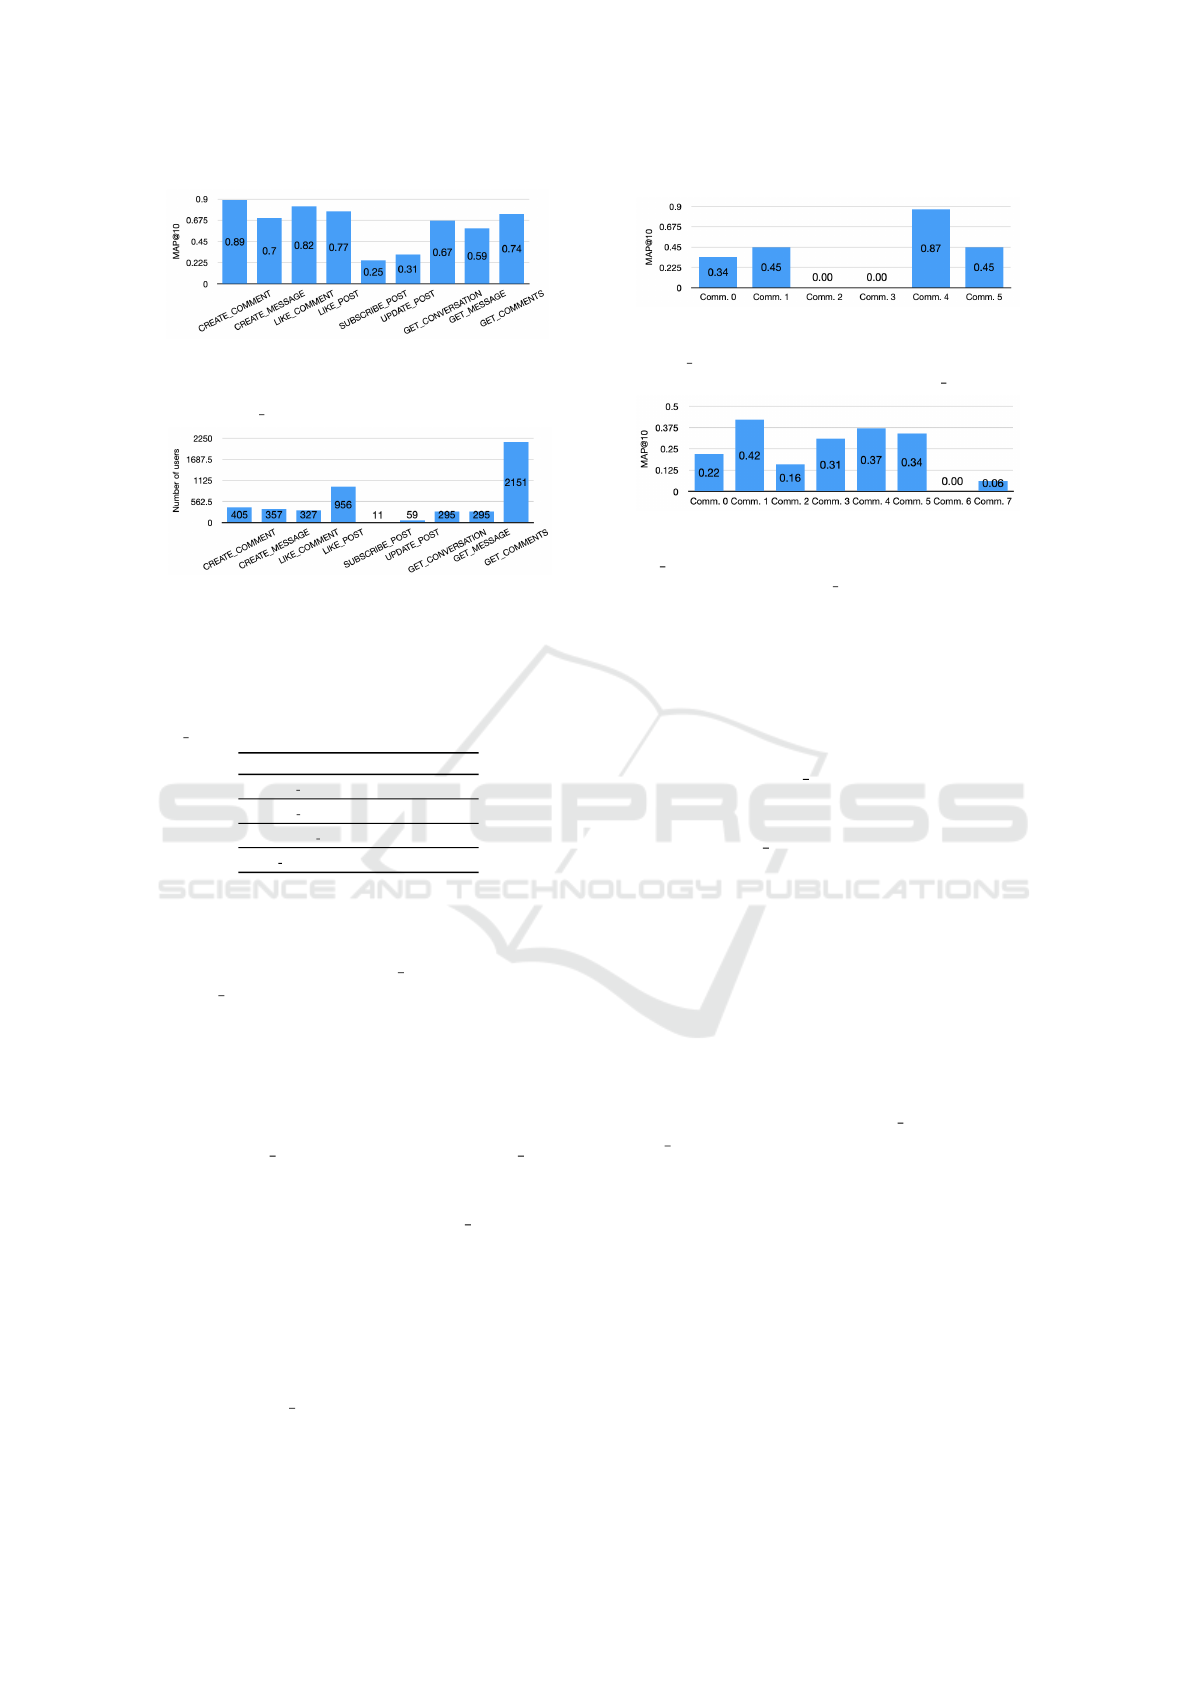
GET COMMENTS have a MAP@10 of 0.89, 0.82,
0.74 respectively). The relations with conversations
occur more often in more than one community
(CREATE MESSAGE, GET CONVERSATION,
GET MESSAGES have a MAP@10 of 0.7, 0.67,
0.59, respectively). It could reflect that maybe the
users on Beekeeper tend to participate in comments
with a given set of same users but have conversations
in common with a more diverse set of users.
4.2 User-post Recommendation MAP
The results in MAP@10 are presented for the user-
post recommendation, based on the same communi-
ties as for user-user recommendations. A post belongs
to a community if only users from a single community
have interacted with it (if users from two or more dif-
ferent communities have interacted with a given post,
this post does not belong to any community—the dis-
tribution of the posts among communities (1064 out
of 1733 posts belong to a community). For user-
post recommendation, only relations between users
and posts were used because the cosine similarity was
computed to retrieve posts with similar interactions
from the same users. The average MAP@10 among
all communities for the posts recommendations was
0.24. In order to try to understand where this low
value came from. The MAP@10 value is presented
ICEIS 2022 - 24th International Conference on Enterprise Information Systems
652
(a) User-User MAP@10 cosine similarity recommendation
results by relation, ground truth: Louvain community de-
tection on GET POST.
(b) Number of users having a type of relation.
Figure 7: Comparison of user recommendation MAP@10
by relation, with number of users having the relation.
Table 7: User-Post MAP@10 recommendation results by
relation, ground truth: Louvain community detection on
GET POST.
User event MAP@10 Score
CREATE COMMENT 0.35
UPDATE POST 0
SUBSCRIBE POST 0
LIKE POST 0.23
in Table 7 by taking into account exclusively one re-
lation and averaging the MAP@10 value among all
communities.
The relations UPDATE POST and SUB-
SCRIBE POST both have a MAP@10 value of
0 when they are exclusively used. It can be ex-
plained in Figure 7b, it shows users belonging to a
community. These two relations are those where the
lowest amount of users had this kind of interaction.
Therefore there is not enough data to use those
relations in recommendation algorithms. Then,
only CREATE COMMENT and then LIKE POST
relations were used and compared the MAP@10
value between each community in Figure 8.
Figure 8a shows that the CREATE COMMENT
relation had a MAP@10 value of zero for communi-
ties two and three. On the other hand, it has values
around 0.35-0.45 for communities zero, one, five, and
0.87 for community four. Communities two and three
were considered as exceptions with a different post
commenting behavior than other communities. Ig-
noring the results of communities two and three, we
see that CREATE COMMENT can also contribute to
finding posts that are from the same community as
(a) User-Post MAP@10 recommendation results with only
CREATE COMMENT relation, by community, ground
truth: Louvain community detection on GET POST.
(b) User-Post MAP@10 recommendation results with only
LIKE POST relation, by community, ground truth: Louvain
community detection on GET POST.
Figure 8: Comparison of post recommendation MAP@10,
if using only one relation, by community.
a user. Figure 7 shows that this relation contributes
the most for the MAP@10 increase for user-user rec-
ommendations with communities as ground truth. It
is worth noting that users from communities six and
seven had no CREATE COMMENT relation to posts
of the same community. Therefore those communities
do not appear on Figure 8a. On Figure 8b, where only
the relation LIKE POST was used, the worst results
are achieved with community six and seven (with re-
spectively, a MAP@10 value of 0 and 0.06). Commu-
nity six has no user having this relation to a post from
the same community, and community seven has only
one of this type of user. It led us to the hypothesis
that maybe those two detected communities, which
are the smallest (as described in section 4), are not
from the same group in reality. Therefore, consider-
ing those two communities will naturally lower the
average MAP@10 score overall communities.
In conclusion, our user-post recommendation re-
sults could be better if CREATE
COMMENT and
LIKE POST relations are used and to ignore com-
munities six and seven. Additionally, a post that be-
longs to a community (only if it has interaction from
users excluded from a single community) is too strict
as ground truth. Then, assigning multiple communi-
ties to each post or assigning most users who have
interacted with a post would lead to better results.
5 CONCLUSION
This paper presents a graph-based RS that uses a
dataset from the social media Beekeeper containing
On-development of a GDPR Compliant Graph-based Recommender Systems
653

the API endpoints from users. The RS was imple-
mented under the GDPR framework. Thus, it makes
the system privacy-friendly, given that it is not possi-
ble to retrieve the original data. This work processed
the dataset and modeled the interactions to a graph
database. The RS prototype exploited the database,
and a web app was used to demonstrate the recom-
mendations provided by the system. During the eval-
uation phase, multiple approaches were considered to
infer groups and communities, especially in commu-
nities. During the evaluation process, it was possible
to match the recommendations with the ground truth
data of the groups in the social network.
In addition, the similarities on multiple types of
edges in the graphs were computed. They were used
as baselines for the recommendations, and the accu-
racy of the system was also evaluated. It was also
possible to identify the user relationships and the cor-
relations between them by measuring the MAP@10
performance using one relationship and comparing it
with the ground truth built with another relationship.
The evaluation of the system represented a sig-
nificant challenge. In addition, to comply with the
GDPR framework, it was impossible to have access
to ground truth, so it was needed to build one from
scratch. The prototype should be implemented in pro-
duction to gather the metrics on how the users react
and determine recommendations’ effectiveness.
It is also essential to generate synthetic data to
develop and evaluate the system using social media
models. Although depending on the goals of the sys-
tem, a specific model should be selected. For exam-
ple, the small-world model could be used in the case
that real node connections are required. The preferen-
tial attachment model could be used when clustering
is required. If done well, these approaches would help
users keep privacy intact, cost-effectively and solve
the data sparsity in some API resources.
REFERENCES
Adamic, L. A., Buyukkokten, O., and Adar, E. (2003). A
social network caught in the web.
Crockett, K., Goltz, S., and Garratt, M. (2018). Gdpr im-
pact on computational intelligence research. In 2018
International Joint Conference on Neural Networks
(IJCNN), pages 1–7. IEEE.
Cummings, R. and Desai, D. (2018). The role of differ-
ential privacy in gdpr compliance. In FAT’18: Pro-
ceedings of the Conference on Fairness, Accountabil-
ity, and Transparency.
Grossmann, C. (2021). The Rise of the Frontline Worker:
How to Turn Your Frontline Workforce Into Your
Biggest Competitive Advantage.
ISO/IEC 27001 (2013). Information Security Management.
Standard, International Organization for Standardiza-
tion, Geneva, CH.
Krebs, L. M., Alvarado Rodriguez, O. L., Dewitte, P., Aus-
loos, J., Geerts, D., Naudts, L., and Verbert, K. (2019).
Tell me what you know: Gdpr implications on design-
ing transparency and accountability for news recom-
mender systems. In Extended Abstracts of the 2019
CHI Conference on Human Factors in Computing Sys-
tems, pages 1–6.
LinkedIn (2020). Why i disagree with the people you
may know linkedin feature. [Online; accessed 23-
December-2020].
Mohallick, I., De Moor, K.,
¨
Ozg
¨
obek,
¨
O., and Gulla, J. A.
(2018). Towards new privacy regulations in europe:
Users’ privacy perception in recommender systems.
In International Conference on Security, Privacy and
Anonymity in Computation, Communication and Stor-
age, pages 319–330. Springer.
Monteiro Krebs, L., Alvarado Rodriguez, O. L., Dewitte,
P., Ausloos, J., Geerts, D., Naudts, L., and Verbert,
K. (2019). Tell me what you know: Gdpr implications
on designing transparency and accountability for news
recommender systems. In Proceeding CHI EA’19 Ex-
tended Abstracts of the 2019 CHI Conference on Hu-
man Factors in Computing Systems. ACM Digital Li-
brary; New York, NY, USA.
Neo4j (2020). Neo4j Graph Data Science Library. [Online;
accessed 23-December-2020].
Neo4j (2020). Pagerank. [Online; accessed 23-December-
2020].
Regulation, G. D. P. (2016). Regulation (eu) 2016/679 of
the european parliament and of the council. Regula-
tion (eu), 679:2016.
Schall, D. (2015). Social network-based recommender sys-
tems. Springer.
Schr
¨
oder, G., Thiele, M., and Lehner, W. (2011). Setting
goals and choosing metrics for recommender system
evaluations. In UCERSTI2 workshop at the 5th ACM
conference on recommender systems, Chicago, USA,
volume 23, page 53.
Stach, C. and Steimle, F. (2019). Recommender-based pri-
vacy requirements elicitation-epicurean: an approach
to simplify privacy settings in iot applications with
respect to the gdpr. In Proceedings of the 34th
ACM/SIGAPP Symposium On Applied Computing,
pages 1500–1507.
Tejeda-Lorente,
´
A., Bernab
´
e-Moreno, J., Herce-Zelaya, J.,
Porcel, C., and Herrera-Viedma, E. (2018). Adapting
recommender systems to the new data privacy regula-
tions. In SoMeT, pages 373–385.
Zafarani, R., Abbasi, M. A., and Liu, H. (2014). Social
media mining: an introduction. Cambridge University
Press.
ICEIS 2022 - 24th International Conference on Enterprise Information Systems
654
