
Predicting Depression with Text, Image, and Profile Data from Social
Media
N. Ignatiev
1,2 a
, I. Smirnov
1,2 b
and M. Stankevich
1 c
1
Federal Research Center “Computer Science and Control” of the Russian Academy of Sciences, Moscow, Russia
2
Peoples Friendship University of Russia (RUDN University), Russia
Keywords:
Depression Detection, Social Media, Classification.
Abstract:
In this study, we focused on the task of identifying depressed users based on their digital media on a social
network. We processed over 60,000 images, 95,000 posts, and 9,000 subscription items related to 619 user
profiles on the VKontakte social media network. Beck Depression Inventory screenings were used to assess
the presence of depression among these users and divide them into depression and control groups. We retrieved
6 different text based feature sets, images, and general profile data. The experimental evaluation was designed
around using all available data from user profiles and creating a prediction pipeline that can process data
samples regardless of the availability of text or image data in the user profile. The best result achieved a 69%
F1-score with a stacking classifier approach.
1 INTRODUCTION
Depression can have a severe impact on the quality of
life of individuals and it is one of the main causes of
disability in the world (WHO, 2017). This mental dis-
order is closely related to a variety of somatic diseases
and cases of self-harm behavior. Not surprisingly, re-
searchers in the field of psychology are making great
efforts to study the phenomenon of depression.
Society in its current state is strongly merged with
social networks. The popularity of social networks
made it possible to study human behavior, personal
traits, and mood by mining and analyzing the data
provided by users. At the same time, given the
fact that depression can affect human behavior, re-
searchers came up with the idea of monitoring depres-
sion and other mental disorders by using social media
data (De Choudhury et al., 2013a). Analysis of social
media data provides an opportunity to privately de-
tect the symptoms of depression before they progress
into more advanced stages of depression. This would
allow suggesting measures for the prevention of de-
pression and treatment during the early stages.
Our work is based on the general profile data, text
messages, and images provided by users from the
Russian-speaking social media network VKontakte
a
https://orcid.org/0000-0001-8834-9319
b
https://orcid.org/0000-0003-4490-2017
c
https://orcid.org/0000-0003-0705-5832
(VK). We collected screening results of the Beck De-
pression Inventory questionnaire to perform a binary
classification task: predicting whether a user was de-
pressed or not. We already evaluated a similar prob-
lem in our previous work (Stankevich et al., 2019),
where we analyzed the text from user posts on VK.
It was found, that it is not possible to apply the pro-
posed methods for all users since some of them do not
have text data in their profiles. The same situation is
observed with image data. In contrast to our previ-
ous work, we define the depression prediction task as
a global task, which means that we include users in
our dataset regardless of data types available in their
profiles. Overall, we processed over 60,000 photos,
95,000 posts and 9,000 groups of 619 users from VK.
To address this task we formed several feature
sets that were based on different data types from user
profiles: tf-idf, psycholinguistic markers, objects and
color properties of posted images, general profile in-
formation, and user subscriptions. To deal with miss-
ing data we evaluated several approaches to form fea-
ture vectors and used a stacking classifier approach on
the data, which yielded the best results on this task.
2 RELATED WORK
There are growing amounts of studies related to the
topic of predicting mental health by processing data
Ignatiev, N., Smirnov, I. and Stankevich, M.
Predicting Depression with Text, Image, and Profile Data from Social Media.
DOI: 10.5220/0010986100003122
In Proceedings of the 11th International Conference on Pattern Recognition Applications and Methods (ICPRAM 2022), pages 753-760
ISBN: 978-989-758-549-4; ISSN: 2184-4313
Copyright
c
2022 by SCITEPRESS – Science and Technology Publications, Lda. All rights reserved
753
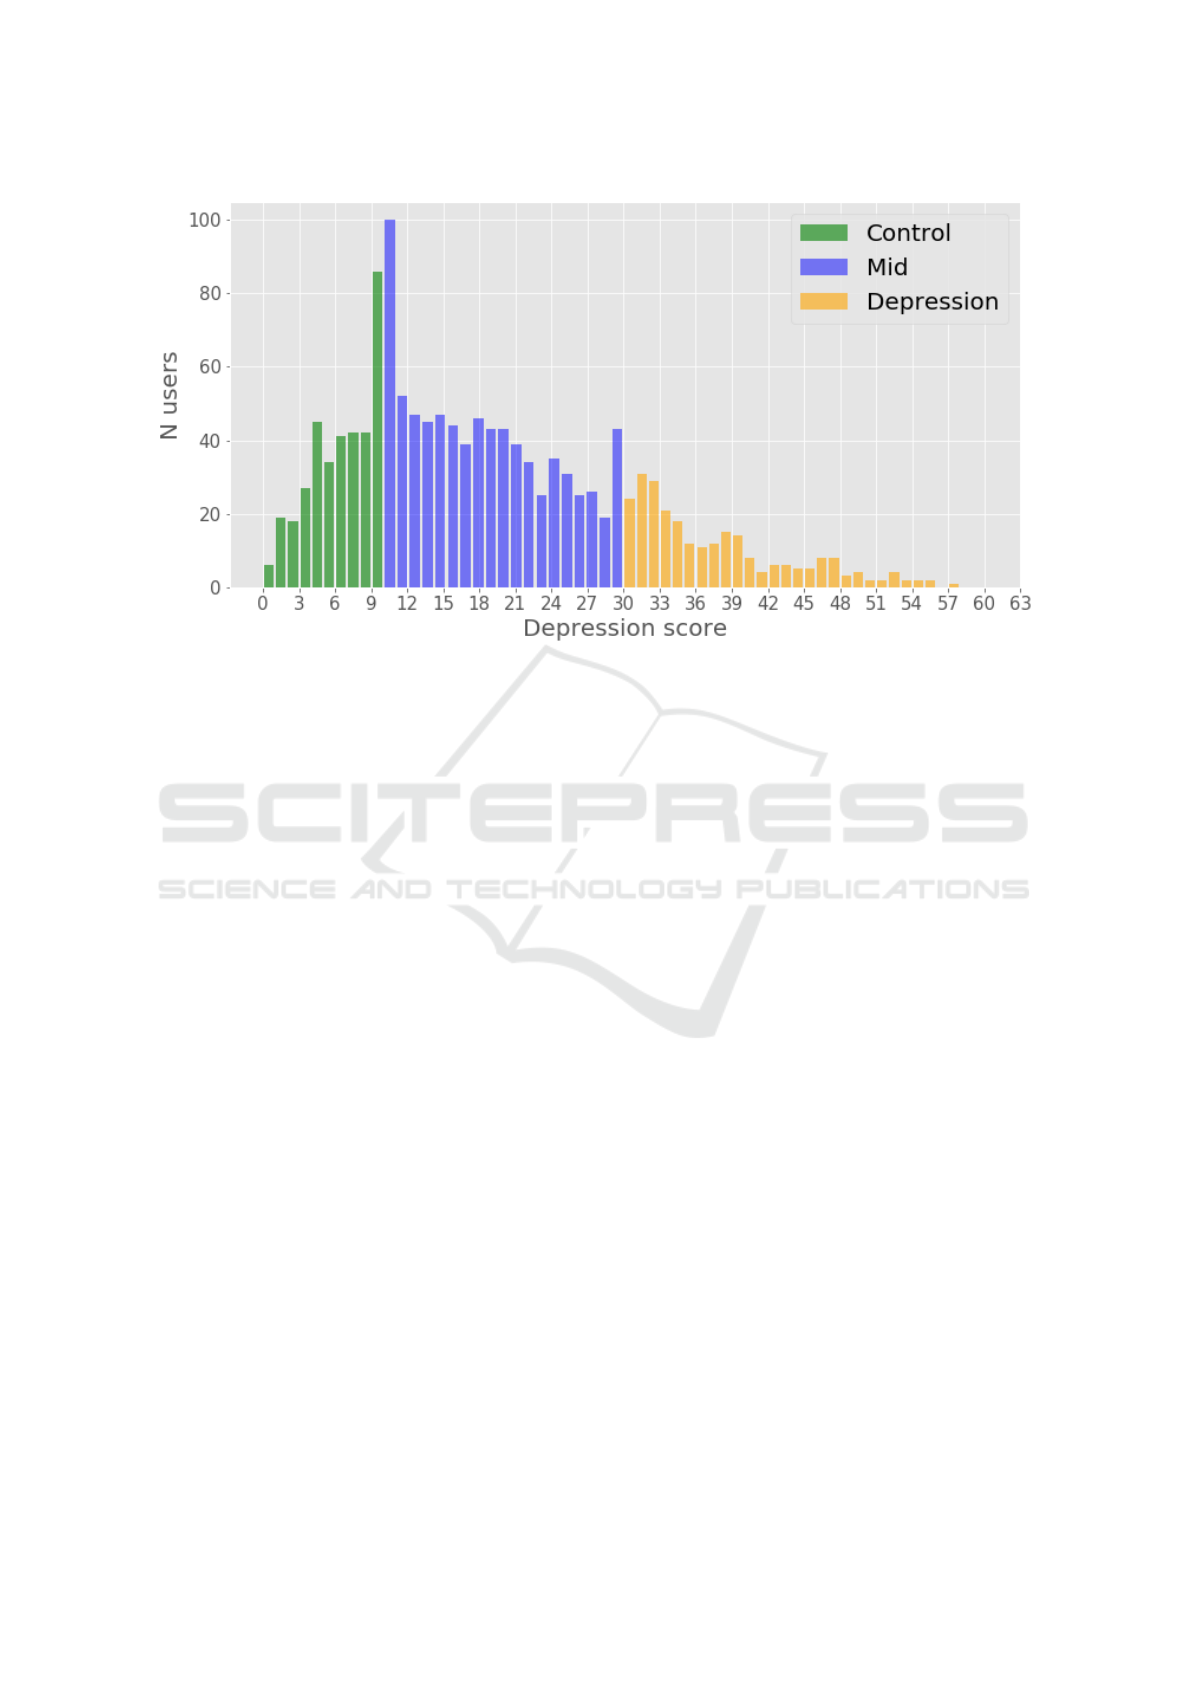
Figure 1: Beck Depression Inventory screening results. Control group: score610; Depression group: score>30.
from social networks, and the majority of them are
focused on analyzing text data (Wongkoblap et al.,
2017). This is not surprising since the main content
of social media usually consists of various user text
messages. A good example of text-based analysis is
the Clef/eRisk series, that provided a shared task and
dataset of Reddit users’ messages for researchers to
address the task of early risk prediction of depression
(Losada et al., 2017; Losada et al., 2018). From this
point of view, this problem is closely associated with
the problem of predicting mental health from text in
general, not only from social media. For example,
an interesting task of predicting current and future
psychological health from childhood essays was pro-
vided by the Clpsych 2018 shared task (Lynn et al.,
2018). We should also note the Linguistic Inquiry and
Word Count tool (LIWC) (Tausczik and Pennebaker,
2010) - the feature extraction tool, which was success-
fully utilized in many psychological studies, as well
as in studies related to our topic (Wang et al., 2017;
Schwartz et al., 2016; De Choudhury et al., 2013b).
The image data posted by social media users can
be analyzed by searching for cues of mental disor-
ders. The dataset of 43950 photos from 166 Instagram
users was utilized to address the depression prediction
task (Reece and Danforth, 2017). Authors of the work
retrieved color properties, filter usage, frequency of
human faces, and some activity features from Insta-
gram accounts to perform binary classification. In an-
other study, image properties such as color theme, sat-
uration, brightness, color temperature, and color clar-
ity were analyzed to detect psychological stress (Lin
et al., 2014a).
In addition to text and image data, it is also possi-
ble to retrieve valuable features from general informa-
tion about users’ profiles, activity, and interactions be-
tween users and communities in social media. For ex-
ample, posting time, the number of followers/follows,
the number of Twitter reply posts, retweets and links
were applied as features for the depression prediction
model in (De Choudhury et al., 2013a). There are
several works that studied the graph structures of so-
cial media interactions to find signs of mental disor-
ders (Wang et al., 2017; Bollen et al., 2011). Another
study evaluated the possibility of using the digital me-
dia content of Facebook users (Kosinski et al., 2013)
to predict personality traits and socio-demographic at-
tributes.
Researchers provide a methodological framework,
as an alternative to similar works(Shen et al., 2017;
Ghosh and Anwar, 2021; Chiu et al., 2021), which
solves the problem of predicting mental health and,
in particular, depression, by analyzing records on so-
cial networks. However, the majority of the studies
evaluate this task by utilizing text, images, and social
media activity data separately, and there is a lack of
works that predict depression by processing all types
of social media data simultaneously.
3 DATASET
To form the dataset, we implemented the Beck De-
pression Inventory questionnaire (Beck et al., 1996)
ICPRAM 2022 - 11th International Conference on Pattern Recognition Applications and Methods
754
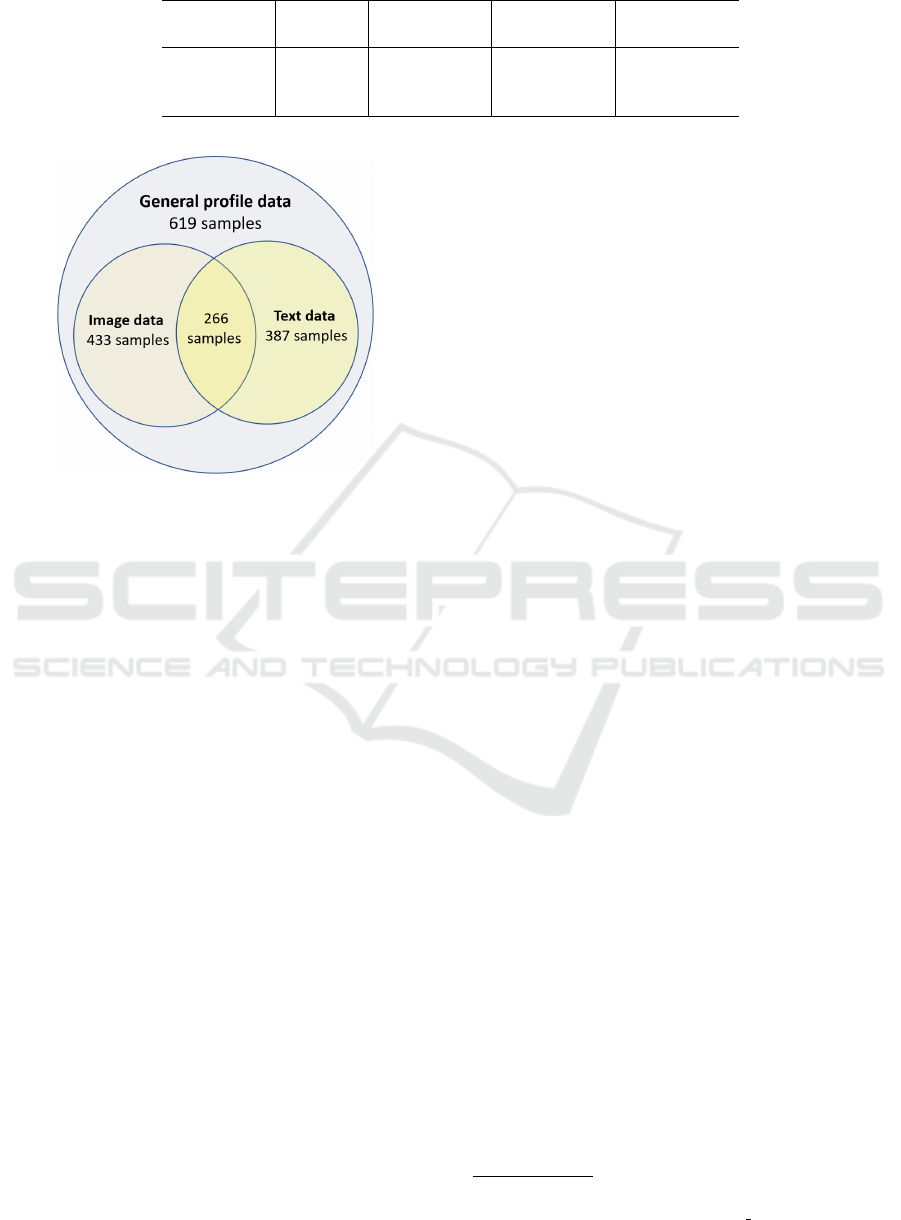
Table 1: Available Data in Control and Depression Groups.
Data General Text Images Text +
Type Profile Images
Depression 259 148 (57.1%) 195 (75.2%) 110 (42.4%)
Control 360 239 (66.3%) 238 (66.1%) 156 (43.3%)
Sum 619 387 (62.5%) 433 (69.9%) 266 (42.9%)
Figure 2: Available data from 619 VK users.
and VK API authorization in our web-application that
was specially developed for our task. Using the inter-
nal VK advertisement system, we asked volunteers to
participate in our research by providing access to their
VK data and completing the Beck questionnaire un-
der privacy concerns. There are 1330 VK users who
provided Beck screenings and social media record-
ings. The Beck Depression Inventory is a well-known
and well-validated 21-item questionnaire designed to
measure the severity and presence of depression on
a 0 to 63 score scale. The distribution of depression
screening scores is presented in Fig. 1.
The questionnaire scores were used to define
3 groups of users: control group (score610),
middle group(116score629), and depression group
(score>30). These cut-off values closely correspond
to the values presented in (Beck et al., 1988). Similar
to our previous work (Stankevich et al., 2019), we re-
moved users with middle scores to perform a binary
classification on data. After removing the middle we
ended up with a dataset of 619 users. We outline 3
data types that are possible to retrieve from VK:
• General profile data.
• Text data;
• Image data.
All of the 619 users have general profile data, but
not every user has images or enough text volume in
his/her profile. It seems that some users only use VK
as messenger app. The analysis of these profiles re-
vealed that the main activity in their profiles are re-
posting (analog of retweets from Twitter). The di-
agram in Fig. 2 provides some insight into how the
data partition looks like.
Overall, the dataset includes the data from 387
users who have a sufficient volume of authored text,
433 users who have more than 10 images, and 266
users who had enough text and image data. The statis-
tics about available data between control and depres-
sion groups are demonstrated in Table 1.
Data Availability. Unfortunately, there is no com-
plete way to anonymize data that we collected, be-
cause that part of VK profiles is freely available on the
Internet. That means that it is not possible to provide
depression screening results at the same time with raw
text and image data without possibly revealing the
identity of participants, which is contrary to our pri-
vacy concerns agreement with volunteers. However,
we can consider sharing already processed data for re-
search purposes under the data agreement form, if we
will become sure that there is no way to reveal users’
identities using this data. We also provide some code
sources for VK data loader
1
and evaluation pipeline
2
.
4 FEATURE SETS
4.1 General Profile Data
We outlined two types of features that we were able to
retrieve from general profile data. First of all, we re-
trieved features available on the main page of the pro-
file. There are some quantitative features: the number
of friends, followers, messages, affiliations, photos,
audio- and video- content, likes on user posts, repost
ratio, etc.; categorical features from VK predefined
list of information about a person: attitude to alco-
hol and smoking, the main goal in life, marital sta-
tus, etc.; binary features that indicate the availability
of the following information in profiles: religion, fa-
vorite books, films, quotes, games, relationship status,
TV, and online shows, etc. We named these features
the activity set (Activity). In general, people in the
1
https://github.com/naignatiev/VKParser7
2
https://github.com/naignatiev/psy vk
Predicting Depression with Text, Image, and Profile Data from Social Media
755

Figure 3: Examples of feature distributions in control and depression groups: a) number of friends, b) number of words, and
c) sentiment score; µ - mean.
depression group have fewer friends (see a) in Fig-
ure 3), which is also noted in other studies (Stanke-
vich et al., 2019).
We also considered information about users’ sub-
scriptions as general profile data and formed a sub-
scriptions feature set (Subs.). We retrieved the list of
groups to which every user subscribed to, and gath-
ered information about these groups. Groups with
less than four subscriptions from users in our dataset
were removed from our feature set. We processed
around 9500 subscription items and identified 28 fea-
tures. The 33- and 66-percentile cut-off values of
the total number of group subscribers were used to
determine 3 group types: large, medium, and small.
The most common topics of groups were used to de-
termine 21 types: humor, creativity, cooking, educa-
tion, media, city community, show, literature, soci-
ety, science, design, unspecified type of community,
culture, cinema, style, photography, tourism, music,
artist, animals, and personal care. Groups age re-
strictions were used to describe another 4 types: 0+,
16+, 18+ and not specified. For each user, we pro-
cessed their subscription list and counted how many
of their groups fall into these 28 categories. The re-
sulting values were normalized by the total number of
user subscriptions.
4.2 Text Data
Our text data contains 95255 user messages, where
for each user we assembled messages with an overall
volume of up to 60000 characters from posts that are
most close to the Beck Depression Inventory screen-
ing date. Large messages with lengths exceeding
5000 characters were removed from observation since
manual analysis revealed that these texts are not au-
thored by users themselves in most cases. Since the
procedure for text selection for all users was the same,
it can be judged that the users in the depression group
generally provide less textual volume on social media
(see b) in Figure 3). The first text data based fea-
ture set is psychological markers (PM), which con-
tains a large number of features that have been iden-
tified based on the lexical, morphological, syntactic,
semantic, and sentiment characteristics of the text
(Smirnov et al., 2021). The open access version
of markers retrieving tool with limited functionality
available at github
3
. The sentiment score of each user
was calculated with a help of the Linis-Crowd senti-
ment dictionary (Koltsova et al., 2016) by summariz-
ing sentiment scores of each word in user messages.
Distributions of sentiment scores (normalized by sen-
tence count) in the depression and control groups pre-
sented at c) in Figure 3. Features from the PM set are
similar to the PM set from our previous work (Stanke-
vich et al., 2019), but we also extended it with dictio-
nary based features, which were previously separated
from the PM set, and semantic features (Shelmanov
and Smirnov, 2014). As a second text-based feature
set, we computed tf-idf values over the unigram rep-
resentation of user messages (TF-IDF).
4.3 Image Data
We utilized Faster R-CNN (Ren et al., 2016) pre-
trained on the COCO (Lin et al., 2014b) dataset to
detect 80 types of objects on images from users’ pro-
files. The three image sources that were observed
were: avatar (profile pictures), images from mes-
sages, and custom user albums. Overall, we processed
61794 user-related images. For each image source,
we calculated the frequency of occurrence of each ob-
ject. The frequency value of each object occurrence
was normalized by the total image count on the re-
spective profile (Objects). In addition, we retrieved
color features (Colors) from users’ images by com-
puting the average values and standard deviation of
each component of the following color spaces: RGB,
HSV, XYZ, LAB.
3
https://github.com/tchewik/titanis-open/
ICPRAM 2022 - 11th International Conference on Pattern Recognition Applications and Methods
756
Table 2: Best cross-validation binary F1-scores for depression class.
Classifier XGB LGBM CAT RF NB SVM KNN LR MLP R
Activity .62
∗
.55 .62
∗
.59 .63
∗
.59 .54 .59 .59
Subs. .61
∗
.58 .61
∗
.56 .58 .62
∗
.59 .57 .56
PM .56 .50 .57 .55 .61
∗
.55 .59
∗
.63
∗
.50
TF-IDF .57 .53 .57 .54 .68
∗
.61
∗
.59
∗
.50 .54
Objects .54 .50 .55 .53 .59
∗
.59
∗
.58
∗
.49 .50 .40
Colors .51 .44 .56 .50 .59
∗
.59
∗
.59
∗
.56 .45
1-stack .66 .65 .66 .65 .65 .64 .59 .63 .64
3-stack .70 .67 .71 .67 .67 .69 .69 .68 .69
All .56 .51 .58 .48 .60 .61 .45 .57 .54
∗
predictions of these classifiers were used to train 3-stack model
Table 3: Classification report on the test data.
Feature set Model
Depression class Control class
F1-macro
Recall Precision F1-score Recall Precision F1-score
Activity NB .68 .57 .62 .64 .74 .68 .65
Subs. SVM .70 .59 .63 .65 .75 .70 .67
PM LR .67 .55 .60 .60 .72 .65 .63
TF-IDF NB .68 .52 .59 .55 .71 .62 .60
Objects SVM .67 .53 .59 .57 .70 .63 .61
Colors SVM .62 .56 .59 .65 .70 .67 .63
1-stack CAT .57 .57 .57 .69 .69 .69 .63
3-stack CAT .65 .63 .64 .73 .74 .74 .69
All SVM .56 .56 .56 .69 .69 .69 .62
5 METHOD AND EVALUATION
SETUP
Social media contains information about users of dif-
ferent kinds. In our particular case of predicting de-
pression from social media, we analyzed VK data and
outlined three types of information about users that
we can assemble: general profile data, text data, and
image data. Recent studies demonstrate that it is pos-
sible to process all of these data sources to retrieve
features, which can distinguish depressed and non-
depressed users. The problem is that it is not possible
to apply prediction models that are trained on text-
based features for users that are missing text messages
in their profiles. The same is true for image-based
prediction models. Taking into account that datasets
for this type of research are usually relatively small,
It is also hard to strictly compare performance yielded
by these models since they are trained on completely
different samples. If we observe the situation where
we need to run a real world application that predicts
the depression status of social media users, it would
not be that easy to determine which model we should
use. To address this problem we consider the given
task as a global task, without separation on the text-
based and image-based datasets, and generalize our
approach to identifying depressed users. To evaluate
the performance of our models we split our data on
train and test samples (468 for the train part and 151
for the test part). The diversity of available data was
taken into account to make balanced splits.
We build a pre-processing pipeline with the fol-
lowing steps: missing values replacement, feature se-
lection, data transformation, and dimensional reduc-
tion. Along with parameters of classifiers, the settings
of each of the pre-processing stages were considered
as a hyperparameter and were optimized using the
Tree-Structured Parzen Estimator approach (Bergstra
et al., 2011) with the help of hyperopt (Bergstra et al.,
2013) on 3 times 5-fold cross-validation. It was found
empirically, that three repetitions are enough to not
overfit hyperparameters to the training set. At the
missing values replacement step, missing data was re-
placed by a median, average value, or zeros. The k-
Best Nearest Neighbor algorithm with varied k-values
was used for feature selection. At the stage of trans-
formation, the data were scaled to a normal, standard
or Gaussian-like form. As part of pre-processing,
PCA with linear, poly or rbf cores was used to lower
the number of dimensions. For the tf-idf sparse di-
mension, we also used truncated SVD for reduction.
It is important to note, that each of the pre-processing
Predicting Depression with Text, Image, and Profile Data from Social Media
757

steps could be skipped.
We evaluated three gradient boosting algorithms:
XGBoost (XGB) (Chen and Guestrin, 2016), Light-
GBM (LGBM) (Ke et al., 2017), CatBoost (CAT)
(Prokhorenkova et al., 2017) and 6 classic machine
learning algorithms: support vector machine (SVM),
random forest (RF), gaussian naive bayesian classi-
fier (NB), k-nearest neighbors (KNN), multilayer per-
ceptron (MLP), and logistic regression (LR). We also
included a random based model for comparison (R).
To address the proposed idea of treating data from
social media users in an equal way regardless of its di-
versity we utilized the stacking classifiers approach.
More specifically, models predictions with the best
train scores from each feature set evaluations were
used to train the new classification models. We per-
formed this approach with 1 (1-stack: 6 features) and
3 (3-stack: 18 features) best scores from each fea-
ture set. As another evaluation setup, we combined
all of the 6 feature sets into one feature space (All)
and applied chained equations (Azur et al., 2011) and
k-nearest neighbors (Troyanskaya et al., 2001) ap-
proaches for missing values imputations (which were
also designed as a hyperparameter for optimization).
6 RESULTS
The results of the best cross-validation performances
are presented in Table 2. All values in Table 2 rep-
resent binary F1-scores for the depression class. The
best result for each feature set is highlighted in bold.
The results calculated on the test data are presented in
Table 3.
Comparing the initial 6 feature sets by F1-score
for the depression class, the best scores were achieved
by models that were trained on general profile data:
.64 with activity and .65 with subscriptions. This
result is not surprising since these feature sets were
based on information about users that was available
for all 619 users. The test scores with text-based fea-
ture sets are .60 and .59 with the PM and tf-idf feature
sets retrospectively. With image-based features test
scores were both around .59. We understand that we
are not able to adequately compare performance con-
ducted on the text and image-based sets since classi-
fication performance in both situations were distorted
by samples with values inserted during the missing
values replacement step. However, this step was in-
cluded to perform a classification stacking approach
on the data. Staking predictions with 1-stack has not
demonstrated any good results on the test data. But
with the 3-stack approach over the CatBoost classi-
fier, we were able to improve results to .64 on the test
Table 4: Top 5 CatBoost feature importance.
Base Level Model Feature Importance
CAT: activity 56.6960
KNN: tf-idf 26.4112
XGB: subscriptions 14.1834
SVM: subscriptions 1.4027
LR: PM 1.1157
SVF: tf-idf 0.1907
samples, which is the best result in our experiment. In
addition, the 3-stack model demonstrates the best F1-
scores for the control class (.74) and F1-macro (.69).
We retrieved feature importance values of the 3-
stack model and demonstrated them in Table 4. It
is noteworthy that the predictions obtained from the
image data based models were almost completely ig-
nored in this case. We assume that correct predictions
with objects and color features are almost completely
coincided with predictions given by classifiers trained
on text and general profile data features.
Generally speaking, the obtained prediction accu-
racy is comparable in quality to other studies (Skaik
and Inkpen, 2020). However, it should be noted that
a direct comparison with other works is impossible,
as all depression detection studies were carried out on
other social networks, with a different class balance
and using different metrics.
7 CONCLUSION
The work describes the depression detection task that
was performed on the basis of VK social media data.
We formed a dataset that consists of text, image and
profile data from personal pages of 619 VK users.
The results of the Beck Depression Inventory screen-
ings were used to split our users into depression and
control groups in order to try to classify them us-
ing machine learning methods. User social media
data was processed to retrieve activity, subscriptions,
psycholinguistic markers, tf-idf, image objects, and
image color properties feature sets. The experimen-
tal evaluation was designed around using all avail-
able data from users’ profiles and creating a predic-
tion pipeline that can process data samples regardless
of the availability of text or image data in the user
profile. We applied the stacking classifiers technique
by combining predictions from the best models that
were trained on the different feature sets and used
them as features for a meta-classifier. This method
allows reaching the best performance in our exper-
iments with around 64% of binary F1-score for de-
pression class and 69% F1-macro.
ICPRAM 2022 - 11th International Conference on Pattern Recognition Applications and Methods
758

ACKNOWLEDGEMENTS
This paper has been supported by the RUDN Univer-
sity Strategic Academic Leadership Program. The re-
search was carried out using the infrastructure of the
shared research facilities ‘High Performance Comput-
ing and Big Data’ of FRC CSC RAS (CKP ‘Informat-
ics’).
REFERENCES
Azur, M. J., Stuart, E. A., Frangakis, C., and Leaf, P. J.
(2011). Multiple imputation by chained equations:
what is it and how does it work? International journal
of methods in psychiatric research, 20(1):40–49.
Beck, A. T., Steer, R. A., Brown, G. K., et al. (1996). Man-
ual for the beck depression inventory-ii.
Beck, A. T., Steer, R. A., and Carbin, M. G. (1988). Psy-
chometric properties of the beck depression inventory:
Twenty-five years of evaluation. Clinical psychology
review, 8(1):77–100.
Bergstra, J., Bardenet, R., Bengio, Y., and K
´
egl, B. (2011).
Algorithms for hyper-parameter optimization. Ad-
vances in neural information processing systems, 24.
Bergstra, J., Yamins, D., and Cox, D. (2013). Making a sci-
ence of model search: Hyperparameter optimization
in hundreds of dimensions for vision architectures. In
International conference on machine learning, pages
115–123. PMLR.
Bollen, J., Gonc¸alves, B., Ruan, G., and Mao, H. (2011).
Happiness is assortative in online social networks. Ar-
tificial life, 17(3):237–251.
Chen, T. and Guestrin, C. (2016). Xgboost: A scalable
tree boosting system. In Proceedings of the 22nd acm
sigkdd international conference on knowledge discov-
ery and data mining, pages 785–794.
Chiu, C. Y., Lane, H. Y., Koh, J. L., and Chen, A. L. (2021).
Multimodal depression detection on instagram con-
sidering time interval of posts. Journal of Intelligent
Information Systems, 56(1):25–47.
De Choudhury, M., Counts, S., and Horvitz, E. (2013a).
Social media as a measurement tool of depression in
populations. In Proceedings of the 5th annual ACM
web science conference, pages 47–56.
De Choudhury, M., Gamon, M., Counts, S., and Horvitz,
E. (2013b). Predicting depression via social media.
In Seventh international AAAI conference on weblogs
and social media.
Ghosh, S. and Anwar, T. (2021). Depression intensity es-
timation via social media: A deep learning approach.
IEEE Transactions on Computational Social Systems.
Ke, G., Meng, Q., Finley, T., Wang, T., Chen, W., Ma, W.,
Ye, Q., and Liu, T.-Y. (2017). Lightgbm: A highly
efficient gradient boosting decision tree. Advances
in neural information processing systems, 30:3146–
3154.
Koltsova, O. Y., Alexeeva, S., and Kolcov, S. (2016). An
opinion word lexicon and a training dataset for russian
sentiment analysis of social media. Computational
Linguistics and Intellectual Technologies: Materials
of DIALOGUE, 2016:277–287.
Kosinski, M., Stillwell, D., and Graepel, T. (2013). Pri-
vate traits and attributes are predictable from digital
records of human behavior. Proceedings of the na-
tional academy of sciences, 110(15):5802–5805.
Lin, H., Jia, J., Guo, Q., Xue, Y., Li, Q., Huang, J., Cai,
L., and Feng, L. (2014a). User-level psychological
stress detection from social media using deep neural
network. In Proceedings of the 22nd ACM interna-
tional conference on Multimedia, pages 507–516.
Lin, T.-Y., Maire, M., Belongie, S., Hays, J., Perona, P.,
Ramanan, D., Doll
´
ar, P., and Zitnick, C. L. (2014b).
Microsoft coco: Common objects in context. In Euro-
pean conference on computer vision, pages 740–755.
Springer.
Losada, D. E., Crestani, F., and Parapar, J. (2017). erisk
2017: Clef lab on early risk prediction on the inter-
net: experimental foundations. In International Con-
ference of the Cross-Language Evaluation Forum for
European Languages, pages 346–360. Springer.
Losada, D. E., Crestani, F., and Parapar, J. (2018).
Overview of erisk: early risk prediction on the inter-
net. In International conference of the cross-language
evaluation forum for european languages, pages 343–
361. Springer.
Lynn, V., Goodman, A., Niederhoffer, K., Loveys, K.,
Resnik, P., and Schwartz, H. A. (2018). Clpsych 2018
shared task: Predicting current and future psycholog-
ical health from childhood essays. In Proceedings of
the Fifth Workshop on Computational Linguistics and
Clinical Psychology: From Keyboard to Clinic, pages
37–46.
Prokhorenkova, L., Gusev, G., Vorobev, A., Dorogush,
A. V., and Gulin, A. (2017). Catboost: unbiased
boosting with categorical features. arXiv preprint
arXiv:1706.09516.
Reece, A. G. and Danforth, C. M. (2017). Instagram pho-
tos reveal predictive markers of depression. EPJ Data
Science, 6:1–12.
Ren, S., He, K., Girshick, R., and Sun, J. (2016). Faster
r-cnn: towards real-time object detection with region
proposal networks. IEEE transactions on pattern
analysis and machine intelligence, 39(6):1137–1149.
Schwartz, H. A., Sap, M., Kern, M. L., Eichstaedt, J. C.,
Kapelner, A., Agrawal, M., Blanco, E., Dziurzynski,
L., Park, G., Stillwell, D., et al. (2016). Predicting
individual well-being through the language of social
media. In Biocomputing 2016: Proceedings of the Pa-
cific Symposium, pages 516–527. World Scientific.
Shelmanov, A. and Smirnov, I. (2014). Methods for seman-
tic role labeling of russian texts. In Computational
Linguistics and Intellectual Technologies. Proceed-
ings of International Conference Dialog, volume 13,
pages 607–620.
Shen, G., Jia, J., Nie, L., Feng, F., Zhang, C., Hu, T.,
Chua, T.-S., and Zhu, W. (2017). Depression detection
Predicting Depression with Text, Image, and Profile Data from Social Media
759

via harvesting social media: A multimodal dictionary
learning solution. In IJCAI, pages 3838–3844.
Skaik, R. and Inkpen, D. (2020). Using social media for
mental health surveillance: A review. ACM Comput-
ing Surveys (CSUR), 53(6):1–31.
Smirnov, I., Stankevich, M., Kuznetsova, Y., Suvorova, M.,
Larionov, D., Nikitina, E., Savelov, M., and Grigoriev,
O. (2021). Titanis: A tool for intelligent text analysis
in social media. In Russian Conference on Artificial
Intelligence, pages 232–247. Springer.
Stankevich, M., Smirnov, I., Kiselnikova, N., and
Ushakova, A. (2019). Depression detection from so-
cial media profiles. In International Conference on
Data Analytics and Management in Data Intensive
Domains, pages 181–194. Springer.
Tausczik, Y. R. and Pennebaker, J. W. (2010). The psy-
chological meaning of words: Liwc and computerized
text analysis methods. Journal of language and social
psychology, 29(1):24–54.
Troyanskaya, O., Cantor, M., Sherlock, G., Brown, P.,
Hastie, T., Tibshirani, R., Botstein, D., and Altman,
R. B. (2001). Missing value estimation methods for
dna microarrays. Bioinformatics, 17(6):520–525.
Wang, T., Brede, M., Ianni, A., and Mentzakis, E. (2017).
Detecting and characterizing eating-disorder commu-
nities on social media. In Proceedings of the Tenth
ACM International conference on web search and
data mining, pages 91–100.
WHO (2017). Depression and other common mental disor-
ders: global health estimates. Technical report, World
Health Organization.
Wongkoblap, A., Vadillo, M. A., and Curcin, V. (2017). Re-
searching mental health disorders in the era of social
media: systematic review. Journal of medical Internet
research, 19(6):e228.
ICPRAM 2022 - 11th International Conference on Pattern Recognition Applications and Methods
760
