
Real-time Approach for Decision Making in IoT-based Applications
Hassan Harb
1 a
, Diana Abi Nader
1
, Kassem Sabeh
1
and Abdallah Makhoul
2 b
1
Faculty of Sciences, Lebanese University, Hadat, Lebanon
2
FEMTO-ST Institute, Univ. Bourgogne Franche-Comt
´
e, CNRS, 1 cours Leprince-Ringuet, 25200, Montb
´
eliard, France
Keywords:
IoT, Wireless Sensor Networks, Real-time Applications, Energy Saving, Data Reduction Techniques, Score
System, K-means Algorithm.
Abstract:
Nowadays, the IoT applications benefit widely many sectors including healthcare, environment, military,
surveillance, etc. While the potential benefits of IoT are real and significant, two major challenges remain
in front of fully realizing this potential: limited sensor energy and decision making in real-time applications.
To overcome these problems, data reduction techniques over data routed to the sink should be used in such a
way that they do not discard useful information. In this paper, we propose a new energy efficient and real-time
based algorithm to improve the decision making in IoT. At first data reduction is applied at the sensor nodes
to reduce their raw data based on a predefined scoring system. Then, a second data reduction phase is applied
at intermediate nodes, called grid leaders. It uses K-means as a clustering algorithm in order to eliminate data
redundancy collected by the neighbor nodes. Finally, decision is taken at the sink level based on a scoring risk
system and a risk-decision table. The evaluation of our technique is made based on a simulation from data
collected on sensors at Intel Berkeley research lab. The obtained results show the relevance of our technique,
in terms of data reduction and energy consumption.
1 INTRODUCTION
Wireless sensor network (WSN) is an indispensi-
ble part of Internet of Things (IoT). It allows mon-
itoring, data collection, processing and transmission
in several IoT based applications (Kadiravan et al.,
2021) (Mostafa et al., 2018), such as smart cities and
smart farms, health care, agriculture, business inno-
vation, environmental monitoring, and so on (Atzori
et al., 2017). In a typical scenario, data collected by
sensor nodes are transmitted to a middleware for pro-
cessing before being forwarded to a specific access
point (sink) for further analyses and decision making
(Kaur and Sood, 2015).
Following the increasing number of IoT users, the
quantity of data generated and collected is continu-
ously increasing. For that, differentiating between
what data to keep and what data to dismiss is crucial
for data accuracy and decision making optimization
especially in real-time cases. However, data trans-
mission is the most expensive in terms of sensor en-
ergy consumption. Additionally, IoT devices, espe-
cially sensor nodes, are limited in their lifetime en-
a
https://orcid.org/0000-0003-3066-9189
b
https://orcid.org/0000-0003-0485-097X
ergy due to the battery power limitation which af-
fects the device’s longevity (Ruan et al., 2019; Harb
and Makhoul, 2018). Thus, many data reduction
techniques have been introduced in order to solve
this problem. It aims at removing similar routed
data in such a way of minimizing the amount of
data transmitted and thus, saving energy (Harb et al.,
2018) (Harb et al., 2020).
In this paper, we propose a novel approach for
energy saving and decision making in real-time IoT-
based applications. Its purpose resides in reducing
the quantity of transmitted data to the sink without
loosing information and guaranteeing data integrity.
By this mean, data transmission rate will be reduced,
leading to the optimization of the network resources.
Our technique is composed of two data reduction lev-
els and one decision level. The first data reduction
technique is applied at the sensor level where raw data
are reduced by mean aggregation based on a prede-
fined score system. The second data reduction tech-
nique is applied at intermediate nodes, called grid
leaders. Each grid leader works on removing data re-
dundancy collected by neighboring nodes based on K-
means clustering algorithm. The final decision phase
is achieved at the sink level. The dataset obtained will
Harb, H., Nader, D., Sabeh, K. and Makhoul, A.
Real-time Approach for Decision Making in IoT-based Applications.
DOI: 10.5220/0010985800003118
In Proceedings of the 11th International Conference on Sensor Networks (SENSORNETS 2022), pages 223-230
ISBN: 978-989-758-551-7; ISSN: 2184-4380
Copyright
c
2022 by SCITEPRESS – Science and Technology Publications, Lda. All rights reserved
223

be used to calculate the risk ratio based on the score
system, then it will determine the right decision ac-
cording to a predefined risk-decision table. To evalu-
ate our approach several simulations have been con-
ducted while using real dataset collected at the Intel
Berkeley research lab. The obtained results show the
relevance of our technique in terms of data reduction
and energy consumption.
The rest of the paper is organized as follows. Sec-
tion 2 overviews various existing data reduction tech-
niques for IoT. Section 3 describes the real-time grid
architecture used in our scenario. In Section 4, we
present the first layer of our data reduction technique
applied at the sensor nodes level. Section 5 describes
the second layer of data reduction applied at the grid
leaders level. In Section 6 we detail the decision mak-
ing algorithm at the sin level. Simulation results are
presented in Section 7. Finally, Section 8 concludes
our paper and gives some perspectives.
2 RELATED WORK
Many approaches have been suggested for data reduc-
tion in WSNs. The importance of reducing data col-
lected in IoT based sensors relies in avoiding packets
loss in network or delay in packets delivery which will
affect decision making.
Many energy efficiency techniques based on ma-
chine learning techniques have been proposed for ef-
fective routing decisions in WSN and IoT. For in-
stance, in (Thangaramya et al., 2019), neuro-fuzzy
based cluster formation protocol (FBCFP) was pro-
posed. The network is trained with convolutional neu-
ral network with fuzzy rules for weight adjustment,
learning four components: current energy level of the
CH (Cluster Head), distance of the CH from the sink
node, change in area between the nodes present in
the cluster and the CH due to mobility and the de-
gree of the CH. Then using Mamdani Inference Sys-
tem for adjusting new CHs depending on energy. In
(Preeth et al., 2018), another fuzzy energy efficient
scheme is proposed called adaptive fuzzy multi cri-
teria decision making (AF-MCDM) approach, where
fuzzy Analytic Hierarchy Process (FAHP) and TOP-
SIS methods are combined together for selection of
cluster head.
In (Santiago et al., 2018), an energy aware load
balancing algorithm is proposed for IoT network by
selecting parent nodes using event rate for cluster for-
mation and neural network predictor for ELT (Ex-
pected Life Time) prediction. In (Elappila et al.,
2018), a congestion and interference aware energy ef-
ficient routing technique in WSN for IoT is presented.
It consists of selecting the signal to interference and
noise ratio of the link, the survivability factor of the
path from the next hop node to the destination, and
the congestion level at the next hop node. In (Khan
et al., 2018), a new routing protocol named Modified-
Percentage LEACH Protocol is introduced based on
existing protocol namely Percentage LEACH. Energy
wastage is reduced by reducing communication be-
tween Cluster Heads and sink through threshold cal-
culation on each CH for cluster selection and taking
into consideration the distance of nodes from sink.
Authors in (Kaur and Sood, 2015) proposed to
switch to sleep the IoT sensors based on three con-
ditions: if it is not necessary to sense the target envi-
ronment in a given period of time; if the coverage area
can be compromised for battery life; and if the battery
level is critically low. In (Hong et al., 2018), TCEB,
a topology control algorithm with energy balance, ad-
dresses the problem of how to find a reasonably re-
duced topology and the packets forwarding route for
underwater wireless sensor networks for energy con-
servation. Non-cooperative game theory is introduced
to the the cluster-head selection in order to optimize
the set of the cluster-heads selection and to ensure the
energy consumption of the whole network balance.
Then, the intra-cluster and the inter-cluster topology
construction are used in order to find the optimum re-
liable nodes to perform the forwarding task.
On bio-smart levels, (Roy et al., 2019) a bio-
inspired distributed event sensing and data collection
framework was proposed based on the gene regula-
tory networks (GRNs) in living organisms. This is
achieved by customizing a heuristic for the Maxi-
mum Weighted Independent Set problem encompass-
ing both quality and quantity of sensed data, where
the first depends on the device energy levels while
the second on the number of events sensed. A sub-
optimal device will be proposed depending on the
residual energy.
In (Muhammad et al., 2019), an energy-efficient
Data Prioritization framework is proposed by intel-
ligent integration of the Internet of Things, artificial
intelligence, and big data analytics for green smart
cities. In (Ejaz et al., 2017; Tomasoni et al., 2018),
a unifying framework for energy-efficient optimiza-
tion and scheduling of IoT-based smart cities. Fi-
nally, in (Wang et al., 2017),an Integer Linear Pro-
gramming (ILP) formulation as well as two effec-
tive polynomial-time heuristic algorithms are pro-
posed for energy-efficient task scheduling problem on
smartphones in mobile crowd sensing systems.
Despite that most of the proposed techniques al-
low efficient energy saving, they fail to reach all as-
pects of IoT applications. Indeed, they are very com-
SENSORNETS 2022 - 11th International Conference on Sensor Networks
224
plex and require huge processing. In this paper, we
present an energy efficient data reduction method that
it is less complex and suitable for limited resources
sensor nodes.
3 THE NETWORK
ARCHITECTURE
In this section, we introduce the network architecture
used in our technique. Two main concepts have been
adopted in our scenario: grid-based architecture and
periodic data acquisition. In the following, we de-
scribe each of them in more details.
3.1 Grid-based Network
We consider a grid-based distribution, where each
square can be defined based on the dimensions of the
whole area of interest and the density of the sensor
nodes. In each square, a grid leader is elected or se-
lected using an appropriate method. This grid leader
is considered as intermediate node. It can be an ordi-
nary node or a node with more capabilities. We con-
sider that the sensor nodes in the same square will
send their data directly to their grid leader, which in
his turn summarizes and aggregates the received data
coming from neighboring nodes. The idea is to re-
move useless redundant data, While following spe-
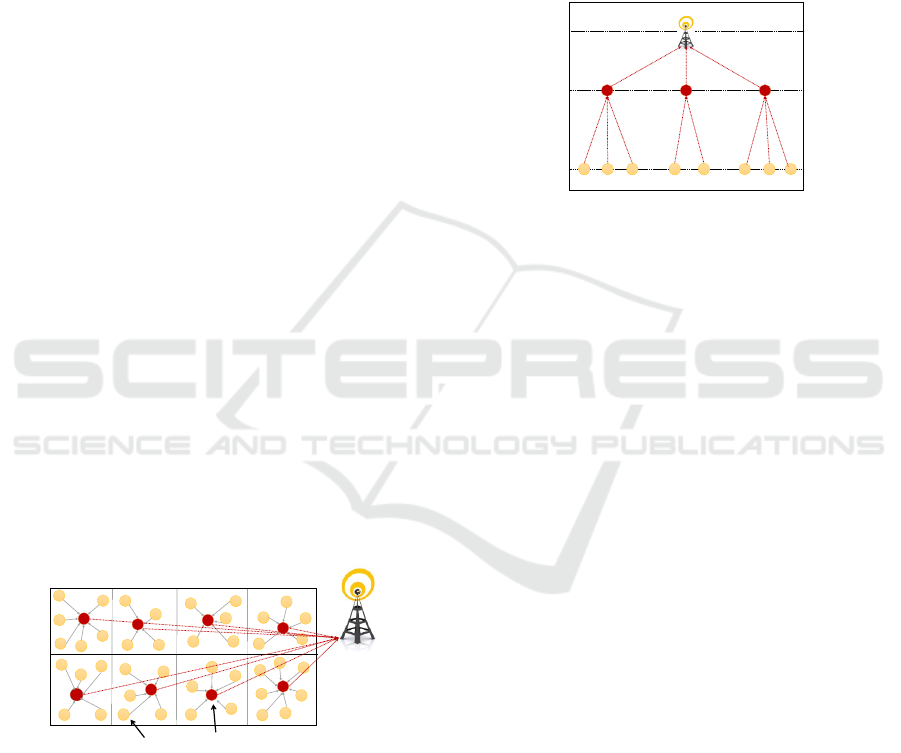
cific rules and before sending them to the sink. Figure
1 shows our sensor network architecture, where data
transmission between sensor nodes and their appro-
priate grid leader is based on single-hop communica-
tion.
Sink
Grid Leader
Sensor node
Figure 1: Two-level data transmission architecture.
3.2 Periodic Data Acquisition Model
Data collection from Iot applications can be made by
data streaming where, data flows primarily from the
sensor node to the grid leader and finally to the sink.
We distinguish two kinds of data streaming the peri-
odic sampling and the event driven. In our approach
we are interested in ”periodic sampling” data model,
where the acquisition of sensor data is forwarded to
the grid leader and the to the sink on a periodic basis.
We consider that each period p is partitioned into
time slots. At each slot t, each sensor node N
i
cap-
tures a new reading r
i
. At the end of the period p, N
i
collects a vector of τ readings, e.g. R
p
i
=
r
1
, r
2
, . . . ,r
τ
,
then it sends it to the sink. In our system, each sensor
node sends periodically (period p) its data to the ap-
propriate grid leader, which in turn sends it to the sink
(Fig. 2) (Harb et al., 2018).
Sensor nodes
Grid Leaders
Sink
Decision level
Figure 2: Periodic data reduction scheme.
4 FIRST PHASE DATA
REDUCTION
In this section we describe how the sensor node it-
self reduces the amount of its collected data before
sending it to the grid leader. Indeed, data collected
in vector R contains redundant measurements espe-
cially when the slot interval between two collected
measures is short. The idea is to reduce the size of
the the vector R
p
i
by selecting similar and consecutive
measures from it and computing their mean to send to
the grid leader instead of sending the whole readings.
Our proposed model is based on a measurement score
aggregation system used to identify similar measures.
4.1 Score System
The score system is a guide used to determine simi-
lar measures within a vector R
p
i
by assigning scores
to each measure. Based on a score system, all mea-
sures belonging to the same interval will be assigned
the same score and aggregated as similar measures.
Table 1 gives an example of such a score system.
4.2 Sensory Data Reduction Algorithm
In this section we introduce the algorithm proposed to
reduce the number of readings collected periodically
by each sensor. The idea is to reduce the number of
readings in the vector R
p
i
to send to the grid leader.
The algorithm works as follows: first we find the
Real-time Approach for Decision Making in IoT-based Applications
225

Table 1: Score System.
Measure Score
≤16 0
]16,17] 1
]17,18] 2
]18,19] 3
]19,20] 4
]20,21] 5
]21,22] 6
]22,23] 7
]23,24] 8
>24 9
score of each reading present in R
p
i
using the function
score, which takes the reading as an input and
returns the score of the reading according to a well
defined score system. Then, if consecutive readings
in R
p
i
have the same score, we calculate the mean
value of those readings. The basic idea is that we
consider readings having the same score as similar
and redundant and instead of sending all of them we
send only their mean. Therefore, the process starts
by finding the score for the first reading in R
p
i
, then it
checks the score of the next values until it reaches a
reading whose score is different from the current one.
Then, we calculate the mean of all previous readings,
and the process iterates again to find readings with
same score as current value. Hence, the final vector
V
R
p
i
contains the mean value of the readings having
same score, as well as the weight of the mean value
(lines 11-13). The weight of the mean value indicates
the number of readings represented by the mean
value. Note that only consecutive values having
same score are aggregated by their mean, and not all
values within R
p
i
having same score. The algorithm
is represented in algorithm 1.
Algorithm 1: Sensor Mean Aggregation Algorithm.
Require: Reading vector: R
p
i
= [r
1
, r
2
, . . . ,r
τ
].
Ensure: Vector of representative readings of R
p
i
:
V
R
p
i
.
1: V
R
p
i
←
/
0
2: checkbe f ore = Score(r
0
) // score of first reading
3: f requency = 0
4: for each set reading r
i
∈ R
p
i
do
5: check = Score(r
0
) // score of current reading
6: if checkbe f ore = check then
7: f requency = f requency + 1
8: else
9: find the mean value, r
i
, of readings in R
p
i
10: wgt(r
i
) = f requency
11: V
R
p
i
← V
R
p
i
∪ {r
i
, wgt(r
i
)}
12: f requency = 1
13: end if
14: checkbe f ore = check
15: end for
16: return V
R
p
i
After applying Algorithm 1, each sensor
will send a vector of representative readings
V
R
p
i
=
(r
1
, f
1
), (r
2
, f
2
), .. . ,(r
k
, f
k
)
to its proper grid
leader, where k ≤ τ and f
i
represents the weight or
frequency of r
i
.
5 SECOND PHASE DATA
REDUCTION
The grid leader receives a vector of reduced data from
all neighboring sensors at the end of each period. At
this stage, we propose an algorithm to reduce the
number of data collected at grid leader level by elim-
inating similar or redundant vectors. Our objective
is to group the readings observed by the grid leader
in clusters using the K-means algorithm, then elimi-
nate redundant data within each cluster by applying
a mean based technique similar to the one applied at
sensor level. In the next sections we explain in more
details how we combined the K-means algorithm with
a mean aggregation technique to clean data at grid
leader level.
5.1 K-means Clustering Algorithm
K-means clustering is a simple unsupervised learning
algorithm that is used to solve clustering problems.
k-means tries to divide a set of samples in k disjoint
groups or clusters using the mean value of the mem-
bers as the main indicator. The clusters are partitioned
as points and all observations or data points are asso-
ciated with the nearest cluster, computed, adjusted,
and then the process starts over using the new adjust-
ments until a desired result is reached. Although it
can be proved that the procedure will always termi-
nate, the algorithm is also significantly sensitive to the
initial randomly selected cluster centers.
The performance of a clustering algorithm may be
affected by the chosen value of K. Therefore, instead
of using a single predefined K, a set of values might be
adopted. It is important for the number of values con-
sidered to be reasonably large, to reflect the specific
characteristics of the data sets. At the same time, the
selected values have to be significantly smaller than
SENSORNETS 2022 - 11th International Conference on Sensor Networks
226

the number of objects in the data sets, which is the
main motivation for performing data clustering. The
optimal value of K for many studied applications var-
ied in the interval [3, 5].
5.2 Absolute Value Distance
One of the fundamental steps when applying the K-
means algorithm is computing the distance between
a reading and a mean value of a cluster. In this pa-
per, we considered the absolute value distance which
is a simple yet effective method to find the distance
between two values. In mathematics, the distance be-
tween x and y is defined by a subtracting relationship:
| x − y |. Let us consider a data value in R
i
and mean
value of a cluster µ , then the absolute value distance
(A
d
) between them can be calculated as follows:
A
d
(r
i
, µ) =| µ − r
i
|, (1)
where r
i
∈ R
i
and µ is the mean value of a cluster.
5.3 K-means and Absolute Value
Distance
Algorithm 2 describes the procedure of K-Means
algorithm to divide the n vectors R
i
received by the
grid leader from the n neighboring sensors into a set
of k clusters. First, the algorithm assigns k random
values from the readings as centroids and allocates
a cluster for each centroid. Then, we calculate the
absolute value distance between each value r
i
and
the k centroids of all clusters and assign the readings
to the clusters according to the minimum distance.
In the next step, we calculate the mean value for
each cluster and use it as the new centroid for that
cluster. Then, we calculate the distance between
the new centroid and the old one. If the distance
is zero for all clusters, the algorithm stops and we
return the clusters with the corresponding centroid
of each. Else, we iterate and recalculate the distance
between the readings r
i
and all centroids to allocate
them to the one with the minimum distance. The
algorithm stops when the distance between the mean
and current centroid is zero in all clusters.
Algorithm 2: K-Means Adopted to Absolute Value Dis-
tance Algorithm.
Require: List of datasets R
p
= {R
p
1
, R
p
2
, . . . ,R
p
n
}, K,
where R
p
i
=
(r
1
, f
1
), (r
2
, f
2
), . . . ,(r
k
, f
k
)
Ensure: List of k clusters C
p
= {C
p
1
,C
p
2
, . . . ,C
p
k
}
where C
p
i
=
(r
1
, f
1
), value(r
2
, f
2
), .. . ,(r
k
, f
k
)
.
1: for j ← 1 to k do
2: C
j
← φ
3: and randomly choose centroid x
j
belongs to C
j
4: end for
5: repeat
6: for each value r
i
∈ R
p
i
do
7: Assign r
i
to the cluster C
j
with nearest x
i
8: end for
9: for each cluster C
j
, where j ∈ 1, . . . , k do
10: Update the centroid x
i
to be the centroid of
all values currently in C
j
so that x
j
=
1
|C
j
|
∑
r
i
for i ∈ C
j
11: end for
12: until
13: clusters’ centroids no longer changes
14: return C
p
5.4 Cluster Reduction at the Grid
Leader
After applying the K-Means algorithm to the data re-
ceived by the grid leader we will have K-clusters.
Next, we will reduce the data present in each cluster
by utilizing the score system we defined earlier (cf.
Section 4.1).
For the K clusters found in (5.3) we will aggregate
the values having the same score using their mean
value. This approach is similar to the one we ini-
tially performed in (4.2) but this time we use the fre-
quency to calculate the mean value. So for each clus-
ter C
p
i
=
(r
1
, f
1
), (r
2
, f
2
), .. . ,(r
k
, f
k
)
, if n consecutive
values r
i
, r
i+1
, . . . ,r
i+n
have the same score according
to our score system, we aggregate them by calculating
the mean value:
m
j
=
r
i
∗ f
i
+ r
i+1
∗ f
i+1
, +···+ r
i+n
∗ f
i+n
|m
i
|
(2)
At the end of this phase we will have a
set of K clusters C
p
= {C
p
1
,C
p
2
, . . . ,C
p
k
} where
C
p
i
=
(m
1
, f
1
), (m
2
, f
2
), . . . ,(m
i
, f
i
)
, where f repre-
sents the frequency value used to compute the mean
and i is ≤ 10 (10 being the number of scores avail-
able). This data will be sent to the sink for a decision
to take place as illustrated in the next section.
6 DECISION MAKING METHOD
AT THE SINK
The sink receives the data from the grid leader as clus-
ters and stores this data after aggregating it, in a sin-
gle cluster form D=
(m
1
, f
1
), (m
2
, f
2
), .. . ,(m
n
, f
n
)
.
Then it makes a decision based on this data and the
evaluated risk as shown in Table 2.
Real-time Approach for Decision Making in IoT-based Applications
227
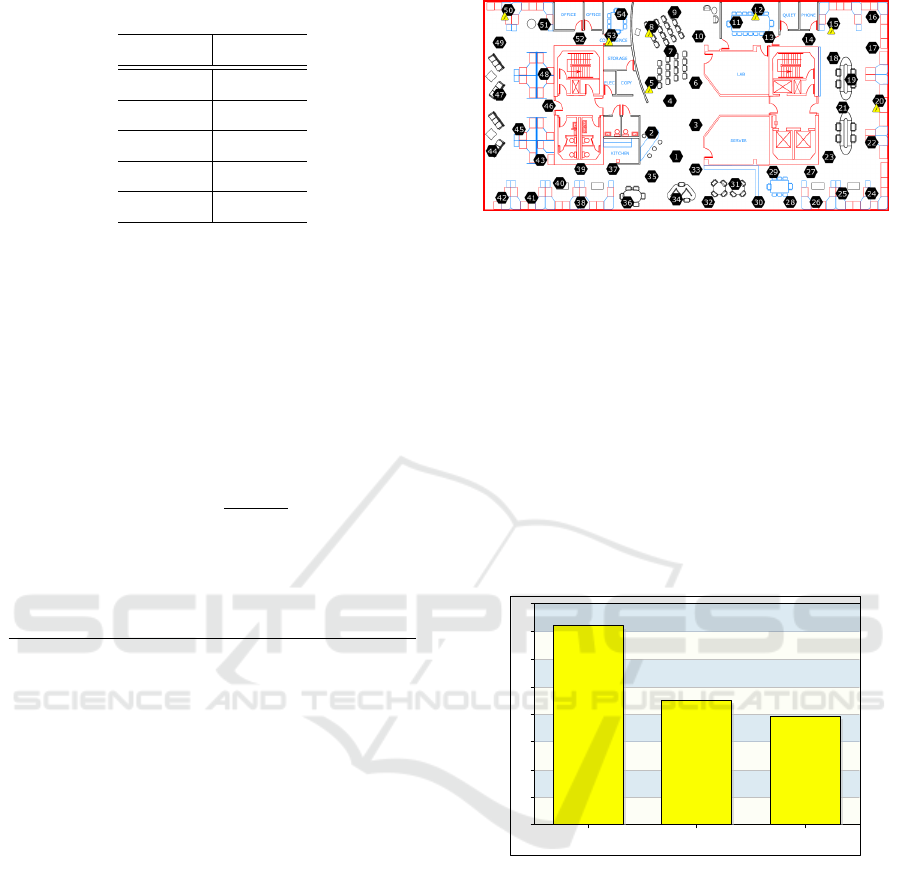
Table 2: Risk Decision.
Risk Decision
≤0.2 d
1
]0.2, 0.4] d
2
]0.4, 0.6] d
3
]0.6, 0.8] d
4
> 0.8 d
5
To calculate the risk, first we have to find
the frequency associated with each score. We
then transform the aggregated data set D into
the following form according to our score system:
D
c
=
(0, f req
0
), (1, f req
1
), (2, f req
2
), . . . ,(9, f req
9
)
.
Where the numbers 0, 1, 2, . . . ,9 represent scores
from our score system in Table 1 while f req
i
repre-
sents the frequency of values having a score i.
Furthermore, the weight parameter is calculated
according to the following formula:
weight
i
=
f req
i
∗ i
|D
c
|
(3)
where |D
c
| is the total frequency of the set D
c
.
Finally, the risk is obtained according to the for-
mula:
0 ∗ weight
0
+ 1 ∗ weight
1
+ 2 ∗ weight
2
+ ·· ·+9 ∗weight
9
6
.
(4)
Based on the risk level, the decision will be taken
according to Table 2.
7 SIMULATION RESULTS
In this section, we show the relevance of our proposed
technique after performing a simulation on real sensor
data nodes deployed in Intel Berkeley research lab. 47
sensors were deployed where each of them collected
temperature, humidity, light and voltage data from 28
February to 5 April 2004. A total of 2.3 millions read-
ings were collected (Harb et al., 2015). In these series
of simulation, we tested our algorithm while consid-
ering the temperature values. The sensors send their
collected data to a grid leader where the K-means al-
gorithm will be applied. The value of k is set first to 3,
then to 4 and finally to 5. The period size in its turn is
set first to 50 readings, then 100 readings and finally
to 150 readings. Figure 3 shows the distribution of
sensors inside the laboratory.
In these simulations Table 1 is adopted for the
score system.
Figure 3: Distribution of sensors in Intel Berkeley lab.
7.1 Data Aggregation Ratio at Sensor
Nodes
As mentioned before, the mean aggregation according
to the score system, allows each sensor node to min-
imize the size of its sensed data by removing similar
readings. Figure 4 shows the average number of tem-
perature readings implemented on different size peri-
ods, using our technique. The obtained results show
that our data filtering model allows sensors to sig-
nificantly reduce its data transmission in a redundant
zone, up to 92% the temperature readings for τ = 50.
0
1
2
3
4
5
6
7
8
data aggregation ratio (%)
50 100 150
T
Figure 4: Aggregation ratio at each sensor during different
periods.
7.2 Data Aggregation Ratio at Grid
Leader
In Figure 5, we show the average number of remain-
ing sets after applying K-means algorithm at the grid
leader, when varying K values to 3, 4 and 5 respec-
tively. The obtained results show that K-means can
significantly eliminate redundant data sets generated
by neighboring sensors. Subsequently, we observe
that K-means can reduce up to 36% of the whole re-
ceived sets at the grid leader. These results confirm
that the clustering is a very efficient approach in terms
of eliminating redundant data and providing useful in-
SENSORNETS 2022 - 11th International Conference on Sensor Networks
228
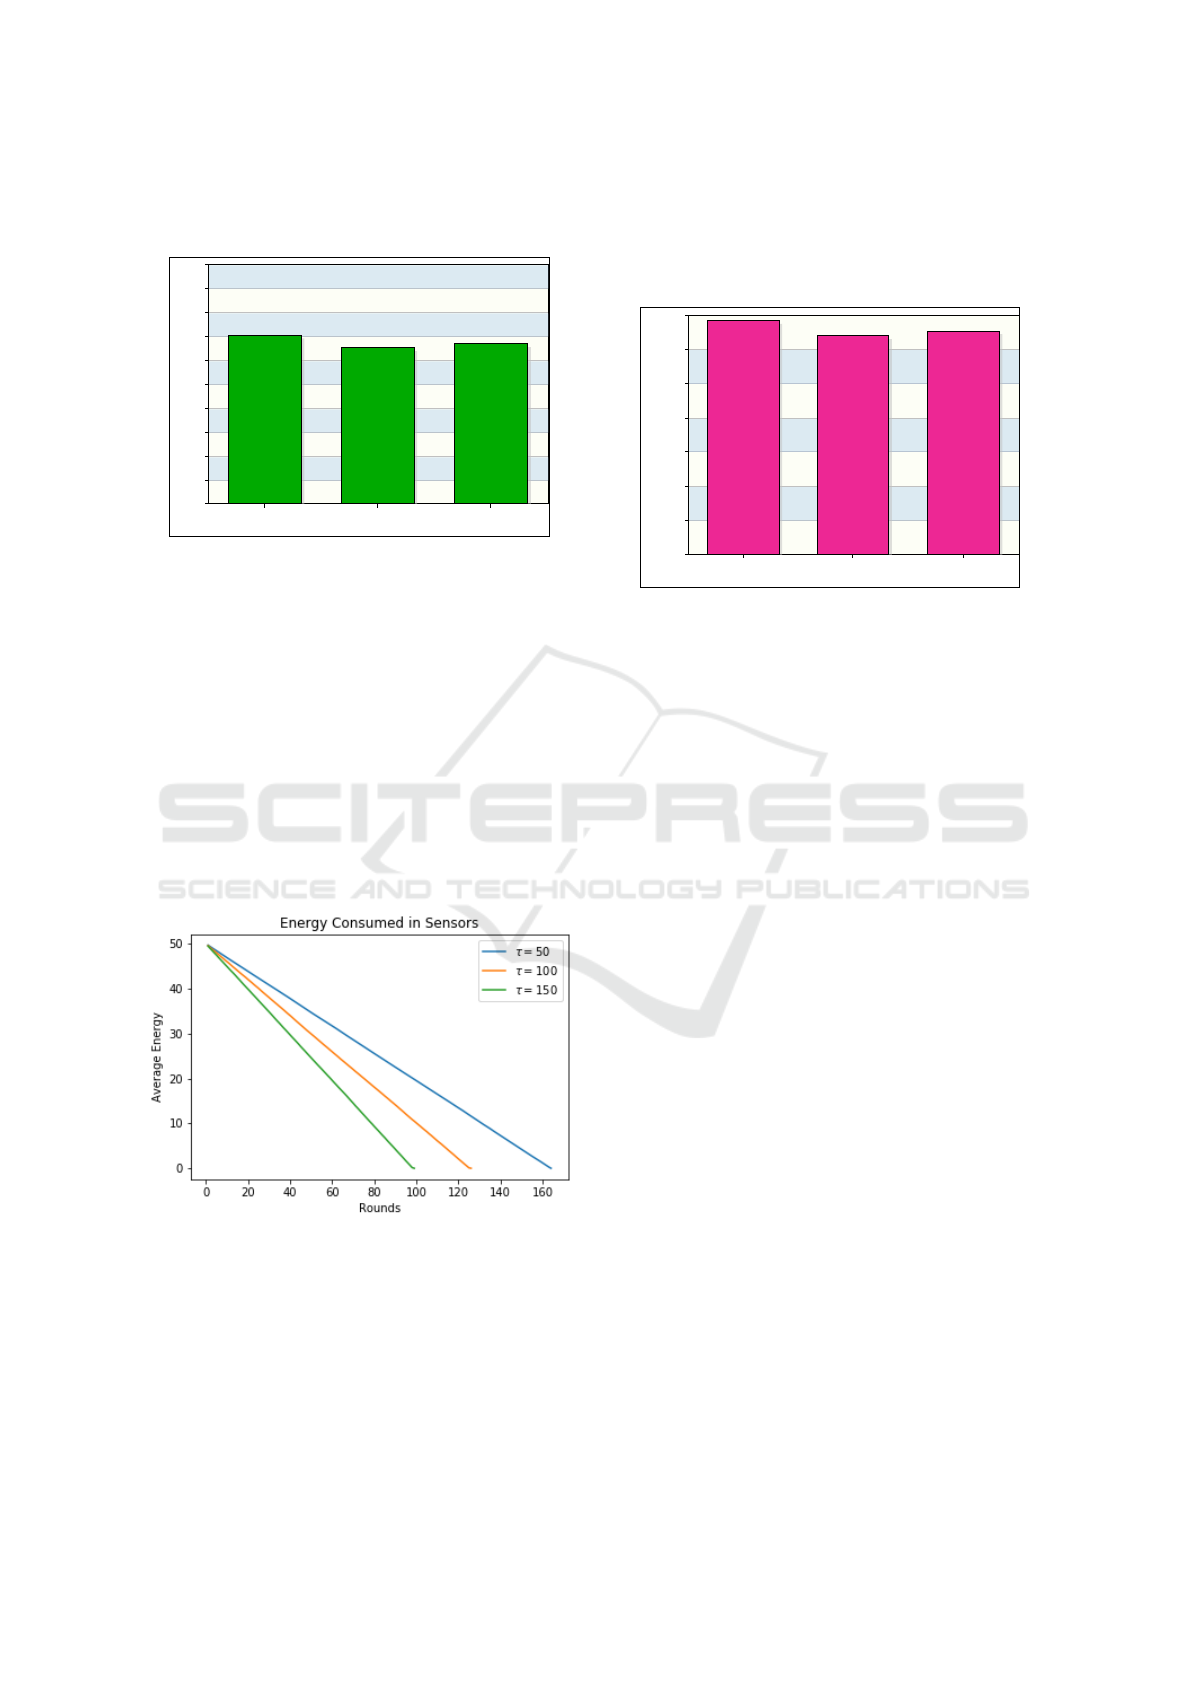
formation to the end user, comparing to other existing
approaches.
0
10
20
30
40
50
60
70
80
90
100
% of sets sent to the sink
3 4 5
K
Figure 5: Filtering set ratio after applying K-means at the
grid leader.
7.3 Energy Consumption at Sensors
Energy consumption is the main metric being studied
in this research. Figure 6 shows the average consump-
tion of energy at sensor level by studying the decrease
in the average energy remaining in sensors as a func-
tion of rounds. We suppose that the initial energy for
each sensor is 50mJ and run the simulation until the
energy becomes zero. A round consists of 15 periods.
We can observe that the sensors survive for approxi-
mately 160 rounds when τ = 50, and 100 rounds when
τ = 150.
Figure 6: Average energy consumption at sensors level.
7.4 Energy Consumption at Grid
Leader
Figure 7 shows the results of energy consumption of
K-means, when varying K. The obtained results are
highly dependent on the number of remaining sets af-
ter applying K-means (see results of Figure 5); less
the number of remaining sets thus less of energy is
lost. Indeed, we observe that our technique gives
important results regarding reducing the energy con-
sumption of the sent data.
0
0.002
0.004
0.006
0.008
0.01
0.012
0.014
energy consumption (mJ)
3 4 5
K
Figure 7: Percentage energy consumption.
8 CONCLUSION AND FUTURE
WORK
Internet of Things (IoT) will play an important role
in the future by collecting surrounding conditions and
environment information. Thus, designing new en-
ergy efficient techniques while preserving data in-
tegrity for decision making appears to be crucial in
order to eliminate redundant raw data and make such
networks operate as long as possible. This paper pro-
posed a real-time framework for energy-efficient and
decision making in IoT-based applications. The first
phase uses a score aggregation system and aims to re-
duce raw data collected by the sensors. The second
phase allows grid leader nodes to eliminate redundant
data collected by neighboring nodes using K-means
clustering algorithm. The third phase will be dedi-
cated to decision making based on a risk-decision ta-
ble. Our technique has been evaluated based on a sim-
ulation on real sensors data. The results obtained with
our technique showed significant energy savings.
Many future directions for our work can be traced.
We seek to try another data clustering methods at the
grid leader level, like decision trees and neural net-
works.
REFERENCES
Atzori, L., Iera, A., and Morabito, G. (2017). Understand-
ing the internet of things: definition, potentials, and
societal role of a fast evolving paradigm. Ad Hoc Net-
works, 56:122–140.
Real-time Approach for Decision Making in IoT-based Applications
229

Ejaz, W., Naeem, M., Shahid, A., Anpalagan, A., and Jo,
M. (2017). Efficient energy management for the inter-
net of things in smart cities. IEEE Communications
Magazine, 55(1):84–91.
Elappila, M., Chinara, S., and Parhi, D. R. (2018). Surviv-
able path routing in wsn for iot applications. Pervasive
and Mobile Computing, 43:49–63.
Harb, H., Jaoude, C. A., and Makhoul, A. (2020). An
energy-efficient data prediction and processing ap-
proach for the internet of things and sensing based ap-
plications. Peer-to-Peer Netw. Appl., 13(3):780–795.
Harb, H. and Makhoul, A. (2018). Energy-efficient sensor
data collection approach for industrial process moni-
toring. IEEE Trans. Ind. Informatics, 14(2):661–672.
Harb, H., Makhoul, A., and Couturier, R. (2015). An en-
hanced k-means and anova-based clustering approach
for similarity aggregation in underwater wireless sen-
sor networks. IEEE Sensors Journal, 15(10):5483–
5493.
Harb, H., Makhoul, A., and Jaoude, C. A. (2018). En-route
data filtering technique for maximizing wireless sen-
sor network lifetime. pages 298–303.
Hong, Z., Pan, X., Chen, P., Su, X., Wang, N., and Lu,
W. (2018). A topology control with energy balance
in underwater wireless sensor networks for iot-based
application. Sensors, 18(7):2306.
Kadiravan, G., Sujatha, P., Asvany, T., Punithavathi, R.,
Elhoseny, M., Pustokhina, I., Pustokhin, D. A., and
Shankar, K. (2021). Metaheuristic clustering proto-
col for healthcare data collection in mobile wireless
multimedia sensor networks. Computers, Materials
& Continua, 66(3):3215–3231.
Kaur, N. and Sood, S. K. (2015). An energy-efficient archi-
tecture for the internet of things (iot). IEEE Systems
Journal, 11(2):796–805.
Khan, F. A., Ahmad, A., and Imran, M. (2018). Energy op-
timization of pr-leach routing scheme using distance
awareness in internet of things networks. Interna-
tional Journal of Parallel Programming, pages 1–20.
Mostafa, B., Benslimane, A., Saleh, M., Kassem, S., and
Molnar, M. (2018). An energy-efficient multiobjective
scheduling model for monitoring in internet of things.
IEEE Internet of Things Journal, 5(3):1727–1738.
Muhammad, K., Lloret, J., and Baik, S. W. (2019). Intel-
ligent and energy-efficient data prioritization in green
smart cities: Current challenges and future directions.
IEEE Communications Magazine, 57(2):60–65.
Preeth, S. S. L., Dhanalakshmi, R., Kumar, R., and Shakeel,
P. M. (2018). An adaptive fuzzy rule based energy ef-
ficient clustering and immune-inspired routing proto-
col for wsn-assisted iot system. Journal of Ambient
Intelligence and Humanized Computing, pages 1–13.
Roy, S., Ghosh, N., and Das, S. K. (2019). biosmartsense:
A bio-inspired data collection framework for energy-
efficient, qoi-aware smart city applications. pages 1–
10.
Ruan, J., Wang, Y., Chan, F. T. S., Hu, X., Zhao, M., Zhu,
F., Shi, B., Shi, Y., and Lin, F. (2019). A life cycle
framework of green iot-based agriculture and its fi-
nance, operation, and management issues. IEEE com-
munications magazine, 57(3):90–96.
Santiago, S., Kumar, A. D. V., and Arockiam, L. (2018).
Ealba: energy aware load balancing algorithm for iot
networks. pages 46–50.
Thangaramya, K., Kulothungan, K., Logambigai, R., Selvi,
M., Ganapathy, S., and Kannan, A. (2019). Energy
aware cluster and neuro-fuzzy based routing algo-
rithm for wireless sensor networks in iot. Computer
Networks, 151:211–223.
Tomasoni, M., Capponi, A., Fiandrino, C., Kliazovich, D.,
Granelli, F., and Bouvry, P. (2018). Profiling en-
ergy efficiency of mobile crowdsensing data collec-
tion frameworks for smart city applications. pages 1–
8.
Wang, J., Tang, J., Xue, G., and Yang, D. (2017). Towards
energy-efficient task scheduling on smartphones in
mobile crowd sensing systems. Computer Networks,
115:100–109.
SENSORNETS 2022 - 11th International Conference on Sensor Networks
230
