
A Data-Driven Methodology for Pre-Flight Trajectory Prediction
Gaetano Zazzaro
a
, Francesco Martone, Gianpaolo Romano, Antonio Vitale
b
and
Edoardo Filippone
CIRA (Italian Aerospace Research Centre), Via Maiorise snc, Capua (CE), Italy
Keywords: Data Driven, Data Mining, Machine Learning, Trajectory Prediction, Uncertainties.
Abstract: This paper presents a data-driven methodology, named P4T, for the trajectory prediction from long to short
term before scheduled time of flight, developed within the framework of the PIU4TP project. The
methodology is aimed to support the Network Manager in the air traffic flow and capacity management,
allowing the optimization of flight distribution among sectors and flight routes, the anticipation of air traffic
flow requests and the identification in advance of potential conflicts. The proposed approach applies machine
learning and data mining techniques to perform data analysis and to correctly identify, from historical data,
the aircraft expected behaviour, in terms of flight path selection. The main peculiarity of this approach is the
exploitation of the uncertainties on current forecasts of some relevant mission and aircraft parameters to
compute trajectory prediction outcomes enriched with associated probabilistic information. The preliminary
validation of the methodology using simulated data highlighted very promising results.
1 INTRODUCTION
Trajectory Prediction (TP) is one of the most relevant
capability and need of the current and, above all, the
future management of air traffic, in its expected
implementation of the Trajectory Based Operations
paradigm. Indeed, it supports the activities
concerning demand-capacity balance, identification
of hotspots and preventive mitigation of potential
conflicts. Therefore, the TP process is used by several
actors involved in the traffic planning and
management, starting even long time before the
actual flight execution. A lot of efforts have been
done to develop TP algorithms that can meet the
stringent safety requirements typical of the aviation
sector. The traditional approach uses a model-based
deterministic forecast of the trajectories without any
quantification of the uncertainty affecting the
prediction (Engage, 2019). However, the TP process
is uncertain by its nature, indeed it predicts actual
trajectories by using models, which are
approximation of the reality affected by a given
accuracy, and uncertain input data, such as weather
forecast, Air Traffic Control (ATC) practices, and
aircraft actual performance.
a
https://orcid.org/0000-0001-6042-6650
b
https://orcid.org/0000-0001-9675-5245
This paper presents the TP approach developed in
the PIU4TP project (Zazzaro et al., 2020), financed
by SESAR within the Engage KTN framework, and
applicable to the strategic and pre-tactical phases of
the Air Traffic Management (ATM). It is a data-
driven methodology that builds the predictive model
of flight trajectories by using Data Mining (DM) and
Machine Learning (ML) techniques. The innovation
of the approach consists in the computation of 4-
dimensional (4D) TP enriched with its relevant
probabilistic information, which is obtained by
exploiting the uncertainty inherently connected to the
data used as inputs by the TP process. The prediction
of the 3D spatial trajectory consists, for the scope of
this work, in the identification of the most suitable
flight plan among several possible, whereas the
prediction of the fourth dimension of the flight plan,
that is the computation of the time of arrival in each
waypoint (WP), is performed by solving a regression
problem. Actually, there is a large number of
parameters that can affect the optimal flight plan
selection. Few, among the most relevant ones, have
been considered in the development of the proposed
methodology. In fact, the aim is to demonstrate a
proof of concept and to investigate how the
188
Zazzaro, G., Martone, F., Romano, G., Vitale, A. and Filippone, E.
A Data-Driven Methodology for Pre-Flight Trajectory Prediction.
DOI: 10.5220/0010985300003191
In Proceedings of the 8th International Conference on Vehicle Technology and Intelligent Transport Systems (VEHITS 2022), pages 188-197
ISBN: 978-989-758-573-9; ISSN: 2184-495X
Copyright
c
2022 by SCITEPRESS – Science and Technology Publications, Lda. All rights reserved

information about significant parameters can be
exploited in an integrated manner to perform in
advance a reliable prediction of the flown trajectory.
Although the method was designed in this simplified
scenario, all the steps that define the proposed
approach can be applied to any set of uncertain inputs.
Indeed, the methodology takes the form of a lifecycle
model for the analysis and modelling of flight paths
in the context of TP and allows to add new input
variables and external parameters by iterating through
the phases of the lifecycle. The defined methodology
was preliminarily validated using simulated data and
the obtained results seem very promising. The use of
simulated data is due to the lack of comprehensive
open access datasets of real aircraft trajectories and
information concerning the parameters that influence
these trajectories. Moreover, the simulated data allow
to test the methodology in a controlled environment,
that is, the value of the parameters of interest and the
rules and the assumptions that lead to perform the
flight along a specific flight plan are perfectly known;
thus, the capabilities and limitations of the proposed
approach can be fully assessed.
This paper is structured as follows: Section 2
summarizes previous works on the TP topic. Section
3 and Section 4 present the operational scenario
defined for the methodology design and validation
and the developed methodology, respectively.
Section 5 discusses the preliminary methodology
evaluation results. Conclusions are in Section 6.
2 RELATED WORK
The evolution towards trajectory-based ATM has led
in recent years to a great deal of interest in the
development of methodologies for predicting aircraft
trajectories. The position of an aircraft in its trajectory
can be estimated using physical models of the
dynamics of the aircraft subject to the different forces
acting on it (gravity, drag, etc.). These model-based
methods require the solution of differential equations
with the precise estimation of a number of parameters
characterizing the response of the aircraft. Aircraft
databases provide theoretical model specifications
and related specific datasets to simulate the behaviour
of any aircraft and is often used for aircraft TP (Nuic
et al., 2010). Point mass models are widely used to
simulate aircraft motion (Schuster, 2015), (Fukuda et
al., 2010). By combining the calculation model, intent
of the aircraft and environmental conditions the
accuracy of the predicted trajectory can be improved
(Alligier et al., 2013), (Zhang et al., 2018). Most of
the relevant parameters in model-based TP methods
are difficult to measure with a satisfying level of
accuracy, in particular the weather data and the
aircraft mass change during flight. Instability in the
predicted position of the aircraft may arise, limiting
the applicability of these techniques to short-term or
to portions of the overall flight.
ML methods are gaining more and more attention
given the resurgence of interest in the field of AI with
the successful application of neural nets in the field of
computer vision, natural language processing,
automatic translation and others. As an alternative to
model-based solutions a data-driven approach
represents a viable solution to the problem of TP
(Wang et al., 2017), (Fernandez et al., 2017). It uses
a collection of past flown trajectories to statistically
predict the behaviour of future flights by exploiting
all the information implicitly included in the
historical data. A stepwise regression method may be
used in TP integrating meteorological data to predict
the arrival time (de Leege et al., 2013). A direct linear
regression model using a dataset of radar trajectories
for short to mid-term aircraft TP has been developed
and tested on a large database of flights over Europe
(Tastambekov et al., 2014). Deep Neural Nets also
have been exploited to address the problem of TP.
Casting this problem as a flight sequence estimation,
a recurrent Neural Net can be trained to predict
aircraft position in discrete time steps (Wu et al.,
2017), (Park et al., 2018). A comparative study
showed that deep learning algorithms have
impressive performance when compared with other
traditional approach (Guan et al., 2016). With the
improving quality and growing volume of the data
collected in ATC systems, data-driven methods have
become mainstream in current aircraft TP research
and may allow overcoming the limitations of model-
based approach. The problem of TP when
uncertainties in the input variables are considered has
emerged in the recent years, and research activities
are on-going on the topic. It is one of the main
objectives of this paper. In previous work this
problem has been faced by using model-based
approach, coupled with probabilistic or uncertainty
propagation methodologies (Rodriguez-Sanz et al.,
2019), (Rivas et al., 2017), and data-driven approach
(Ma and Tian, 2020), (Zeh et al., 2020), (Zhang et al.,
2020).
3 OPERATIONAL SCENARIO
The design and validation of the TP methodology
require the definition of an operational scenario and
the collection of all the relevant data (historical data,
A Data-Driven Methodology for Pre-Flight Trajectory Prediction
189

in terms of flown trajectories and related forecasts).
The scenario definition includes the selection of the
considered airspace, routes and aircraft, the
identification of the parameters that affect the flight
plan, and the definition of the time frame in which the
TP shall be carried out. All the data that characterize
the scenario are generated in simulation, providing a
wide and complete database. The simulated data are
computed using some assumptions that however do
not affect the generality of the developed
methodology. The following subsections detail both
the considered scenario and the process for simulated
data generation.
3.1 Scenario Definition
Two routes within the European airspace were
selected: London Heathrow Airport (ICAO code:
EGLL) to Athens Eleftherios Venizelos Airport
(ICAO code: LGAV) and London Gatwick Airport
(ICAO code: EGKK) to Malta International Airport
(ICAO code: LMML). Both routes are executed by
several airliners, fly through different national
airspaces and go across different airspace sectors. It
is assumed that each route can be performed using
one out of twelve possible flight plans (three different
lateral flight plans which can be performed at four
different cruise flight levels), defined by departure
and destination airports and a list of waypoints (WPs).
A generic short/medium range aircraft has been
chosen to perform the flights, with take-off weight
varying in the range 50-80 tons. Actually, there is a
large number and types of parameters that can affect
flight plan selection and request for a flight plan
change both during pre-flight planning and flight
execution. The defined scenario considers two of
these parameters, that are relevant in the strategic and
pre-tactical phases, namely actual aircraft take-off
weight (TOW) and weather conditions. In fact, the
actual TOW affects the climbing performance of the
aircraft (Zeh et all., 2020), (Uzun and Koyuncu,
2017), and the selection of the optimal flight level, as
described in (AIRBUS, 1998). The effects of weather
conditions on the performed flight plan are widely
known and reported in several works in the literature
(Rivas, Franco and Valenzuela, 2017), (de Leege, van
Paassen and Mulder, 2013), (Sankararaman and
Daigle, 2017). For the sake of simplification, other
effects such as the pilot intent, FMS performance,
ATC tactical intervention, are not considered in the
generation of simulated data.
The methodology shall be applicable in strategic
and pre-tactical phases, therefore a time window of
15 days before the scheduled date of flight (denoted
as Tf) is considered. In details, TP is performed at
three relevant dates: 15 days, 5 days and 1 day before
Tf, denoted with Tf-15, Tf-5 and Tf-1, respectively.
Simulated data concerning meteorological conditions
and estimated TOW, including related uncertainties,
are computed in these dates and in the day of flight.
3.2 Simulated Data Generation
The information about a huge number of flights shall
be available to design and validate a data-driven TP
methodology. For each flight the following data are
required:
the set of possible flight plans that can be flown
along the selected route;
the weather forecasts (and their probabilistic
characterization) along the flight route, in each
date of the TP computation and the actual
weather conditions on the day of the flight;
the TOW estimations (and their probabilistic
characterization) in each date of the TP
computation and the actual TOW during the
flight;
the actual flown trajectory the day of flight.
The set of possible flight plans for each route was
selected through the analysis of the data available on
the website https://www.flightradar24.com and
defined by a list of WPs downloaded from the website
www.flightplandatabase.com.
The ERA5 database of the European Centre of
Medium-range Weather Forecast-ECMWF (ERA5,
2021) was used to get 3D (longitude, latitude,
pressure altitude) weather data. Several datasets,
including wind intensity and direction and
atmospheric temperature, were used; they refer to all
the days of October and November from 1979 to 2013
at 2pm. Weather data are evaluated in each WP of all
the possible flight plans for the selected route,
through an interpolation of the grid provided by
ERA5. The ERA5 also provides the uncertainties for
the weather forecasts (Haiden et al., 2019) that apply
back till to 15 days before the date, and this is also a
leading reason for selecting 15 days as the time range
of our scenario. In the defined scenario, along with
the forecast at Tf-15, Tf-5 and Tf-1 dates, an
uncertainty is associated to each variable that
characterize the weather conditions, as provided in
(Haiden et al., 2019). It is assumed that the forecast
of the atmospheric parameters are stochastic variables
with a Uniform distribution. Once the atmospheric
parameters are available, the No-Fly Zones can be
computed as the airspace region where wind intensity
exceeds a pre-defined threshold.
VEHITS 2022 - 8th International Conference on Vehicle Technology and Intelligent Transport Systems
190

The TOW forecast and actual values vary among
two precise limits, the Operating Empty Weight
(OEW) and the Maximum Take-Off Weight
(MTOW). These values for most of the aircraft are
available in the literature (AIRBUS, 1998). The TOW
forecast at each prediction date is obtained through a
random draw, assuming a Uniform stochastic
distribution within the allowable range. The
uncertainty on the estimated value depends on how
much in advance with respect to the scheduled flight
date the estimation is computed (it decreases while
approaching the flight date) and it is defined as a
percentage of the whole range of variation.
Computed weather conditions and take-off
weight on the day of flight are inputs for the selection
of the flown flight plan among the possible options.
Specifically, as detailed before, the presence of the
No-Fly Zones is determined by the weather, whereas
the TOW defines, for a given aircraft and cost index
selected by the operator, the climbing performance,
the optimal cruise altitude and the optimal Mach
number, denoted as ECON Mach (AIRBUS, 1998). It
is worthy to remark that the weather conditions could
also contribute to determine the optimal flight level,
because the relation between TOW and optimal cruise
altitude (flight level), for a fixed cost index, varies
with the atmospheric temperature. Based on these
considerations, the following rules apply to select the
most suitable flight plan (among the available ones
for the considered route):
the selected lateral flight plan shall avoid the
NFZs;
the selected flight level shall be the optimal one
with respect to the take-off weight.
The definition of the 4D flight plan requires the
computation of the time of arrival in each WP. It is
performed through kinematic equations, assuming
that the flight is executed flying at ECON Mach. In
computing the time to reach the WPs in the first legs
of a flight plan, the climb performance of the aircraft
is also considered by adding to the estimated time an
additional delay. This climb performance is available
in the open literature for some aircraft models
(AIRBUS, 1998).
Using the data generation process above
described, 2052 simulated flights were computed for
the route from London to Athens, and 2023 simulated
flights for the route from London to Malta. Globally,
there are 20 variables comprised in the simulated data
related to aircraft state, weather condition, take-off
weight and the relative uncertainties. For each
simulated flight these variables are provided at each
prediction date (predicted values of the variables and
related uncertainties) and at the date of flight (actual
flown values of the variables). Table I shows the list
of the variables.
Table 1: List of simulated variables.
Variable Descri
p
tion Units
WP_ID Way
p
oint (WP) Identifie
r
-
Lon WP longitude deg
Lat WP latitude de
g
T Temperature
K
VnW
North component of wind
s
p
eed on WP
m/s
VeW
East component of wind
s
p
eed on WP
m/s
VdW
East component of wind
s
p
eed on WP
m/s
W Take-off weight kg
FL Flight level 100s ft
PrFL
Probability associated to the
flight level
-
M Mach numbe
r
-
PrM
Probability associated to the
Mach numbe
r
-
Vg
Speed with respect to the
groun
d
m/s
ETime
Time needed to cover the
distance between two
consecutive WPs
(
ETA
)
s
4 METHODOLOGY
DEVELOPMENT
The development of the methodology, named P4T,
was carried out in three phases: domain and data
understanding, data preparation, and training of the
models.
4.1 Domain and Data Understanding
The domain understanding included the fixing of the
objectives of the data analysis goals and the
assessment of the situation. In particular, it concerned
the mapping from domain issues to data analysis
problems. As a result, the domain objective in the P4T
methodology, consisting in the prediction of the flight
path, has been translated into a data analysis
objective, which consists of a multiclass classification
with respect to the flight plan prediction (both lateral
and vertical), and of a regression, regarding the
estimation of the time of arrival on the WPs of the
flight plan.
For the lateral and vertical flight plan, the problem
to address can be stated as: predict which flight plan,
among N possible ones, will be selected for the
A Data-Driven Methodology for Pre-Flight Trajectory Prediction
191

execution of the flight. The input variables considered
are: forecast and related uncertainties of weather
conditions (temperature and wind speed components)
at each WP of the flight plan and of take-off weight.
The prediction of the time of arrival on the WPs
(ETA) is a classical regression problem having as
input variables the sequence of the WPs, the forecast
of temperature and horizontal wind direction (east
and north components) at each WP, and of take-off
weight. The examination of the simulated data has
showed that there is a one-to-one correspondence
between the flight level and the optimal cruising
Mach number of the aircraft, so that, once established
the value of the flight level, the Mach is uniquely
defined. This is perfectly reasonable in a first
approximation, taking apart the possible variation due
to the necessity to compensate for the effects of the
wind speed along the route. So, temperature and take-
off weight contain all the information to predict the
cruising airspeed. For this reason, in the regression
model for the estimation of ETA, these variables are
considered as input to the model and not the estimated
cruising speed or flight level.
4.2 Data Preparation
Different strategies were used to construct the
datasets needed in the modelling phase for lateral
flight plan and flight level classifications and for the
estimation of the time of arrival.
Regarding the prediction of the lateral flight plan,
separate datasets were built for each of the selected
route and for each time frame before the estimated off
block time (EOBT). Since it is assumed that the
definition of the lateral flight plan and the choice of
the cruise flight level may be taken as independent,
different datasets for the prediction of these two target
variables were built. Once fixed the route and the time
frame, the simulated dataset provides for each flight,
the alternative flight plans along with the related
forecasted weather conditions, as well as the
estimated take-off weight. The datasets for the
prediction of the lateral flight plan contain vectors
with the following structure:
𝑇
()
,𝑉
()
,𝑉
()
,𝑉
()
,…,𝑇
()
,𝑉
()
,𝑉
()
,𝑉
()
(1)
where 𝐿 is the number of WPs in the flight plan. The
components of these vectors are only the weather
variables, i.e. the temperature 𝑇 and the three
components of the wind speed along the three
directions north 𝑉
, east 𝑉
, and down 𝑉
.
In order to consider the uncertainties, the value of
the weather variables used to construct the input
vectors for modelling is drawn from a gaussian
distribution centred on the simulated value and with
standard deviation σ=∆/3, where ∆ is the associated
uncertainty. The choice of σ is made to have a
gaussian ample enough to take all the interval of
uncertainty of the weather variable, i.e. 6 σ=2 ∆. This
sampling is repeated for a fixed number of times.
Then, for the components of the vector (1), we have:
𝑇
(
)
~
𝒩
(𝑇
(
)
,∆𝑇
(
)
/3)
(2)
𝑉
()
~
𝒩
(𝑉
(
)
,∆𝑉
(
)
/3)
(3)
where 𝑖=1,…,𝐿, 𝑗=𝑁,𝐸,𝐷, and 𝑇
()
and 𝑉
()
are
the values of T and V
j
at WP i-th as provided by the
available input data. The target variable for the training
of the models is the label corresponding to the lateral
flight plan used for the execution of the flight.
The procedure used to construct the dataset for the
prediction of the flight level is similar. The flight
level is a characteristic of the flight, not of the single
flight plan, and it is assumed that the choice of the
flight level depends mainly on the take-off weight and
on the mean temperature in the zone of flight.
The dataset for the training of the models for the
prediction of the flight level is made up of vectors
with the following simple structure:
(
𝑇
,𝑊
)
(4)
where 𝑇
is calculated by taking all the WPs of all the
possible lateral flight plans, and 𝑊 is a value
repeatedly drawn from a gaussian distribution centred
on the value of the take-off weight, denoted as 𝑊
, as
provided by the input data and having 1/3 of the
uncertainty ∆𝑊 as standard deviation. Then, for the
target variable, to each possible flight level is given
as label an integer from 1 to the number of possible
flight levels. The target variable for the training of the
model is the label corresponding to the flight level
used for the execution of the flight.
The dataset for the regression problem of
estimating the time of arrival on the WPs of the lateral
flight plan was built starting from the data of the
simulated flights, i.e. those referring to the day of
flight (see Table 1). These variables refer to the flight
plan used during the execution of the flight and carry
no uncertainties. Therefore, a data-driven model of
the aircraft dynamics was built by exploiting one
dataset for each of the two routes considered. Each
dataset contains rows with the following structure:
(
𝑑,𝑏,𝑇,𝑉
,𝑉
,𝑊
)
(5)
where 𝑑 is the distance between two consecutive
WPs of the same flight calculated along a loxodrome,
b is the track angle between the two WPs, 𝑇, 𝑉
and
VEHITS 2022 - 8th International Conference on Vehicle Technology and Intelligent Transport Systems
192

𝑉
are evaluated at the starting WP. The dependency
on other estimated parameters, such as the flight level
or the Mach number, is not introduced into the
regression model since the temperature and the take-
off weight should contain enough information to let
the model gain a knowledge about the cruise speed of
the aircraft. The analysis focused on the cruising
phase of the flight, leaving out the climbing from the
departure airport to the cruising flight level and the
descending phase to the arrival airport.
The modelling datasets obtained with these
procedures are split into training and test sets. The
training sets are used for the construction and
optimization of the predictive models, while the test
sets are kept apart for the final evaluation of the
performance of the models.
4.3 Modeling
In order to select the best model for the problem at
hand, part of the available training dataset is used as
a validation dataset useful for tuning the model’s
hyperparameters.
In the development of the methodology both
holdout and a k-fold cross-validation (with k=10)
have been used, obtaining very similar results, so in
the following only the results for the cross validation
are reported, separately for the prediction of the flight
plan and the prediction of the ETAs.
The three timeframes in which TP is carried out
have been dealt with the same procedure and there
were not special difficulties and limitations
encountered during the training of the models.
An information-gain based filter has been used to
reduce the number of input variables to the most
significant ones. Several different models were tested
in the development of the methodology varying their
specific hyperparameters: inductive decision trees
with variable depth, random forests with variable
number of decision trees, Bayesian Networks with
different number of parent nodes and Neural
Networks with variable number of units in the hidden
layer. We found that the models showing the best
performance in classification were inductive decision
trees and random forests (Tan et al., 2019). Decision
trees were used for both the route and for almost all
the timeframes for the prediction of both the
horizontal flight plan and the flight level with three
exceptions, all regarding the prediction of the lateral
flight plan: a random forest with 20 decision trees was
used for the London-Malta route at Tf-5 and two
random forests with 250 decision trees were used for
both the routes one day before EOBT. In Table 2 and
3 are reported the results obtained for the accuracy in
the prediction of the lateral flight plan. The training
datasets are substantially balanced, especially the one
for the London-Malta route, while the one for the
London-Athens route presents a slight imbalance in
favour of the first lateral flight plan, as highlighted in
Table 4. As can be seen from the tables, the ability of
the models to make correct predictions for the long
term, 15 days before take-off, is better than that of a
classifier that assigns labels randomly. In this time
frame, for the London-Athens route, the model tends
to prefer the first plane of lateral flight, this could be
a further sign of imbalance in the dataset. The results
improve, however, rapidly as the temporal distance
from EOBT decreases, a sign that the models have
been able to effectively learn the information useful
for the classification.
Table 2: Results for horizontal flight plan prediction.
Route
Accuracy
Tf-15 Tf-5 Tf-1
London
–
Athens 38.5% 53.4% 99.9%
London
–
Malta 35.8% 81.2% 99.9%
Table 3: Results for flight level prediction.
Route
Accuracy
Tf-15 Tf-5 Tf-1
London
–
Athens 46.7% 69.9% 88.7%
London
–
Malta 44.2% 72.3% 90.3%
Table 4: Composition of the training dataset for horizontal
flight plan prediction.
Flight plan London – Athens London – Malta
1 36.6% 32.2%
2 30.1% 33.0%
3 33.3% 34.8%
Table 5: Composition of the training dataset for flight level
prediction.
Flight level London – Athens London – Malta
330 23.5% 25.0%
350 31.7% 29.6%
370 27.1% 27.7%
390 17.7% 17.7%
For the flight level, the training datasets show a
more marked imbalance (see Table 5), once again
lower in the case of the London-Malta route. The
models perform better than the random classifier
starting from 15 days before EOBT and the rate of
correct classification increases steadily approaching
the day of the flight.
Using one-hot encoding the components of the
output vectors are all positive numbers that sum to 1
and thus may be interpreted as a probability
A Data-Driven Methodology for Pre-Flight Trajectory Prediction
193
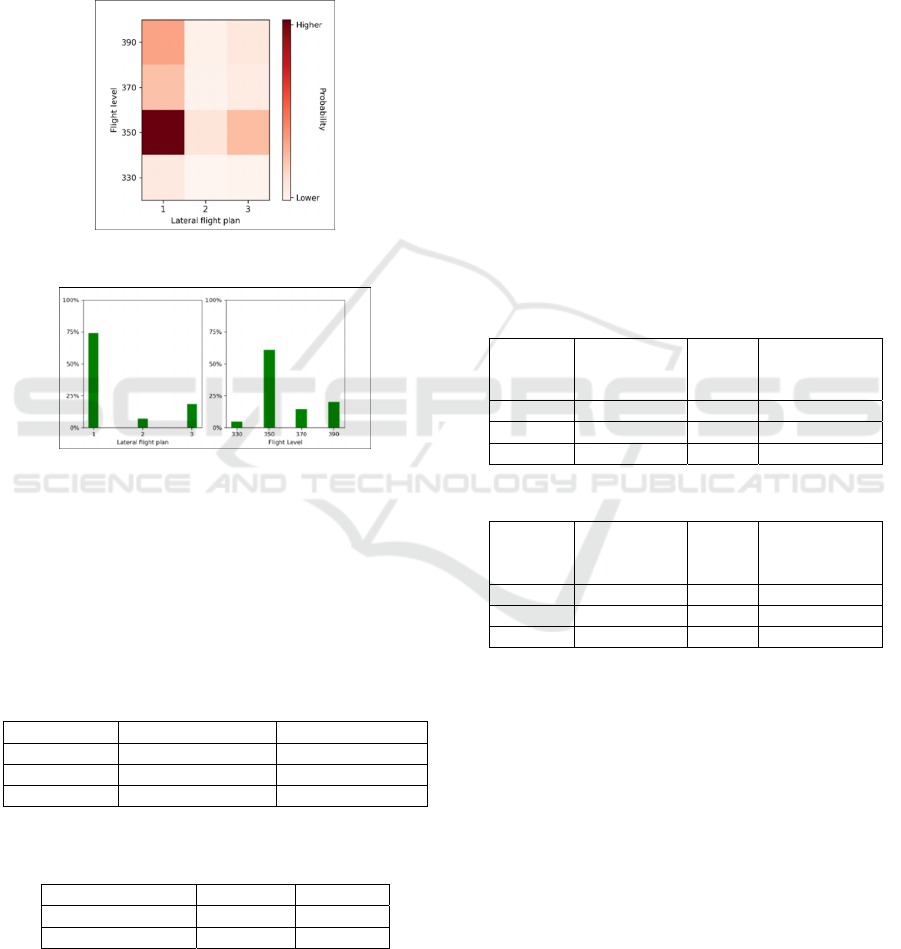
distribution over the possible lateral flight plans (flight
levels) given the vector of inputs. The output of the
model is the lateral flight plan or flight level to which
corresponds the highest probability. Since the choice
of the lateral flight plans and of the flight level are
considered as independent, the product of these proba-
bilities gives the overall probability for the selection of
a flight plan (lateral + vertical), that can be represented
as a heat-map (Figure 1) or a bar plot graph (Figure 2).
Figure 1: Heat-map representation of the joint probability.
Figure 2: Bar plot representation of the joint probability.
As said above, the dataset used for the prediction
of the time of arrival was built starting from the data
relative to the executed flight and carry no
uncertainties. The datasets were almost balanced in
terms of the flight plan used for the flights, for both
the two selected routes (Table 6).
Table 6: Composition of the training dataset for prediction
of the time of arrival.
Fli
g
ht
p
lan London – Athens London – Malta
1 36.2% 32.0%
2 30.1% 33.0%
3 33.7% 35.0%
Table 7: Training results for prediction of the time of
arrival.
Route MSE (s
2
) MAE (s)
London
–
Athens 10.5 1.8
London
–
Malta 4.8 1.4
Also, four different regression algorithms were
tested, optimizing their respective hyperparameters
against a validation dataset: decision trees with
variable depths, random forests with different number
of decision trees, AdaBoost regressors based on
decision trees by varying the depth of the trees and
the number of estimators, artificial Neural Networks
with variable number of hidden layer units. The
models giving the best performance for both the
London-Athens route and the London-Malta route
were two random forest regressor models with 150
estimators, the MSE (Mean Squared Error) and MAE
(Mean Absolute Error) are reported in Table 7.
5 METHODOLOGY
EVALUATION
The evaluation of the performance of a model is of
paramount importance to assess the real capability of
the model to be used in a production environment. To
this end part of the available data is to be kept apart
in a test dataset not used in any step of the
training/validation process.
Table 8: Test results for the route London-Athens.
Time
before
EOBT
Horizontal
flight plan
Flight
level
Flight plan
(horizontal +
vertical)
Tf-15 31% 48% 12%
Tf-5 63% 67% 42%
Tf-1 78% 88% 68%
Table 9: Test results for the route London-Malta.
Time
before
EOBT
Horizontal
flight plan
Flight
level
Flight plan
(horizontal +
vertical)
Tf-15 34% 48% 13%
Tf-5 76% 66% 50%
Tf-1 83% 89% 74%
The test dataset for the evaluation of the models
trained in the P4T methodology comprise 100
randomly chosen flights for each of the selected
routes, with data referring to 15 days, 5 days and 1
day before the EOBT and to the day of execution of
the flight. It is worth pointing out a major difference
between the training/validation dataset and the test
dataset. As described in the previous paragraph, the
training dataset is built by sampling the input
variables from certain distributions defined by their
respective uncertainty, so from each simulated flight
in the training set we get M different records
corresponding to the same target flight plan. The
dataset obtained by this procedure is then split
randomly into a training and a validation dataset,
these two sets are disjoint but it may be possible that
VEHITS 2022 - 8th International Conference on Vehicle Technology and Intelligent Transport Systems
194

records referring to the same flight may be present in
both sets. The test dataset, instead, is made up by all
the records of all the flights taken apart for the
evaluation of the models. Since the choice of the
lateral flight plan and of the flight level are considered
as independent, the prediction of the flight plan is a
two steps process that can be performed in parallel.
The M vectors obtained through the sampling
procedure are used as input to the model for the
prediction of the lateral flight plan to obtain M
different predictions, the final output of the model is
the one recurring most often (majority voting). For
the prediction of the flight level there is a unique
vector as input to the model and the output is the most
probable flight level (one-hot encoding).
The performance of the predictive models on the
test dataset are presented in Table 8 for the route from
London to Athens and in Table 9 for the route from
London to Malta. It is worthy to note that a classifier
that chooses the lateral flight plan and the flight level
completely randomly should have an accuracy of
about 8.33%, so even in the long-term case Tf-15 the
accuracy in predicting the flight plan (horizontal and
vertical) is still significantly better than a random
classifier. These results confirm the overall good
performance of the models, in particular the accuracy
of the prediction increases remarkably as the time of
the departure closes in and the forecast values of the
input variables get closer to the values experienced
during the execution of the flight and the
corresponding uncertainties get smaller.
A sequence of WPs is needed as input to test the
performance of the regression model for estimating the
arrival times. These WPs are provided by the model for
the lateral flight plan prediction. The same flights used
to test the models for the prediction of the flight plans
were considered. To assess the performance of the
regression model, the predicted and actual flight times
were compared. But, since the predicted flight plan
may differ from the actual flight plan, instead of
comparing the arrival times on the individual WPs, the
overall duration of the cruise phase was compared.
In Figure 3 there are the histograms of the
absolute values of the difference between the actual
and the predicted duration of the cruise flight for the
route from London to Malta for all the considered
time frames before the EOBT. For this route, the
cruise flight extends for 21 WPs with a duration that
ranges from about 1.5 to about 2.5 hours. It is evident
that the performance of the model gets better
approaching the day of the flight. A similar pattern is
obtained for the route London-Athens: approaching
the EOBT the number of flights with a prediction
error in the range 0-5 minutes increases steadily, with
a corresponding reduction in the number of flights
with high prediction errors. It is expected that the
error in time prediction is related to the error in the
prediction of the horizontal flight plan. In fact, to give
an idea of the improving performance of the
regression model when the horizontal flight plan is
correctly predicted, Figure 4 shows the absolute value
of the error limited only to the flights with a correct
prediction of the lateral flight plan for the route
London-Malta; similar results were obtained for the
other route. For both the routes, the error doesn’t
exceed 360 seconds (6 minutes), and the number of
flights with a value of the error below 120 s increases
remarkably approaching the day of the flight.
Another view of the results is presented in Figure
5, which includes three scatter plots for the London-
Malta route, one for each considered time frame,
going from left to right, Tf-15, Tf-5 and Tf-1. The
plots report the actual duration of the cruise phase of
the flight on the x-axis and the predicted duration on
the y-axis. Each point represents a flight with a color
that depends on the correctness of the prediction of
the 3D flight plan: violet both horizontal and vertical
flight plan are correctly predicted, blue only the
vertical flight plan prediction is correct, light blue
only the horizontal flight plan prediction is correct,
yellow both are incorrectly predicted. The nearer the
point to the bisector, line in red, the lesser is the error
in the prediction of the duration of the cruise flight.
The figure confirms that if both lateral flight plan and
flight level or if only lateral flight plan are correctly
predicted then the error on the predicted duration is
very low. Very similar results were obtained for the
route from London to Athens.
6 CONCLUSIONS AND FUTURE
WORKS
This paper presented a data driven methodology for
trajectory prediction on long, medium and short
terms, developed within the framework of the
PIU4TP project. Its main peculiarity is the capability
to manage the uncertainties that by nature affect the
input data to the trajectory prediction process.
The proposed approach was developed and tested
using a simplified use case, based on simulated data.
Specifically, only two factors that influence the
selection of the optimal flight plan were considered,
that is, weather conditions and take-off weight. Indeed,
the objective is to demonstrate a proof of concept and
to provide evidences of the proposed methodology
applicability and potential benefits arising from its use.
A Data-Driven Methodology for Pre-Flight Trajectory Prediction
195
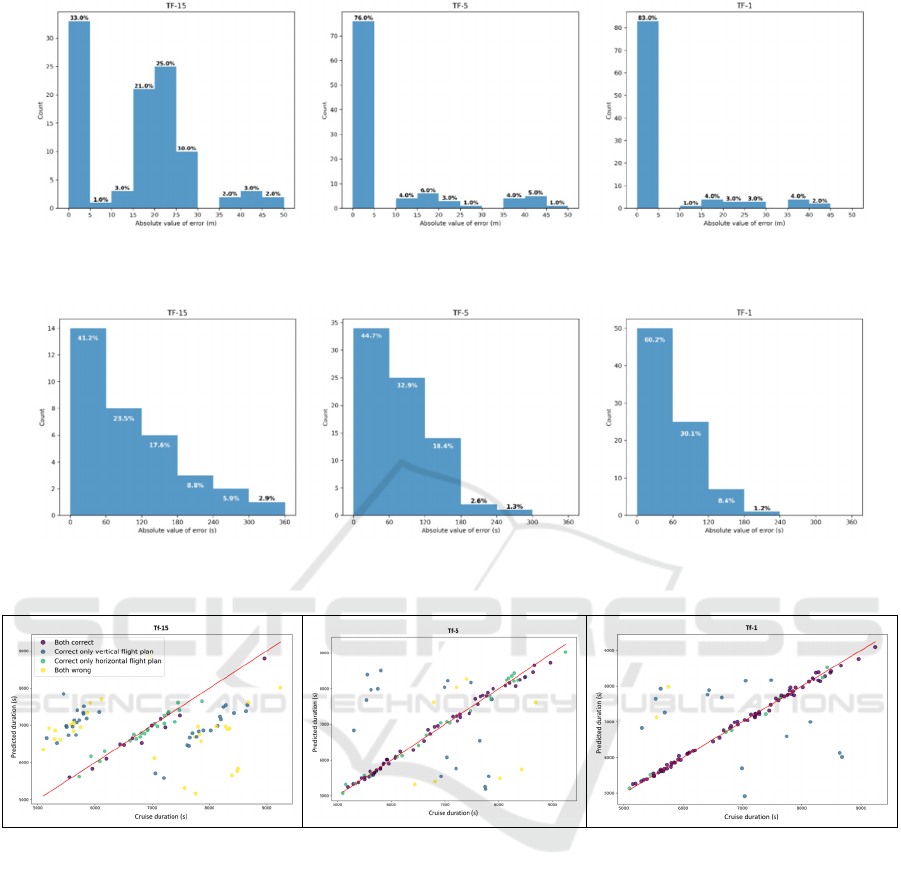
Figure 3: London-Malta route, histograms of the absolute difference between actual and predicted duration, in minutes (m),
of the cruise flight.
Figure 4: London-Malta route, histograms of the absolute difference between actual and predicted duration, in seconds (s), of
the cruise flight limited only to the flights with a correct prediction of the flight plan.
Figure 5: London-Malta scatter-plots of the actual vs. the predicted duration of the cruise flight.
The simulated data were produced within the
framework of the PIU4TP project by defining suitable
simulation models and exploiting the data found in
the open access databases. Preliminary assessment of
the methodology highlighted that it is able to catch
the information that are available in the input data,
including the related uncertainties, and to exploit
them to reliably predict in advance the flown
trajectory. The methodology’s output includes a
complete spatial prediction of the flight plan
(horizontal and vertical) enriched with an estimation
of the time of flight (limited to the cruise phase of the
flight). The probability of the prediction is provided,
too. The accuracy of the prediction depends on the
time in advance with which it is computed and
increases sharply as the time approaches the day of
the flight, reaching values around 70% one day before
the EOBT. This behaviour is due to the weather
forecasts improve and the uncertainties on the input
data reduce as the EOBT approaches. When the three-
dimensional spatial flight plan is correctly predicted,
the estimation of the duration of the cruise phase of
the flight is very accurate, too, with a worst-case error
less than 6 minutes also on long term prediction.
Finally, the achieved percentage of correct
predictions for the horizontal flight plan at Tf-1 (from
78% to 83%) is in line with the ones presented in
(Cordero et al., 2018), where the success rate of the
predictions performed 8 hours before EOBT varies
between 82% and 90%. It shall be considered that in
the two works the predictions are performed at
different time frames (24 hours versus 8 hours before
VEHITS 2022 - 8th International Conference on Vehicle Technology and Intelligent Transport Systems
196

flight schedule) and that different scenarios are
considered.
In order to further mature the concept, future
research shall focus on more complex use cases,
which consider a wider set of input parameters, and
analyze actual flight data.
ACKNOWLEDGEMENTS
The PIU4TP project has received funding from the
SESAR Joint Undertaking under the European
Union’s Horizon 2020 research and innovation
programme under grant agreement No 783287.
REFERENCES
AIRBUS (1998). Getting to grips with the cost index. In
Flight Operations Support & Line Assistance, Issue II.
Alligier, R., Gianazza, D., and Durand, N. (2013). Learning
the aircraft mass and thrust to improve the ground-
based trajectory prediction of climbing flights. In
Transportation Research Part C: Emerging
Technologies, Vol. 36, pp. 45-60.
Cordero, J. M., et al. (2018). Traffic Characterization for a
Dynamic and Adaptive Trajectory Prediction Data-
Driven Approach. In 10
th
SESAR Innovation Days.
de Leege, A., van Paassen, M., Mulder, M. (2013). A
machine learning approach to trajectory prediction. In
AIAA Guidance, Navigation, and Control (GNC)
Conference. AIAA.
Engage Thematic challenge 2 (2019). Data-driven
trajectory prediction. Engage KTN, Edition 3.0.
ERA5 (2021). Reanalysis dataset. At
https://www.ecmwf.int/en/forecasts/datasets/reanalysis
-datasets/era5. ECMWF.
Fernández, E. C., et al. (2017). DART: A Machine-
Learning Approach to Trajectory Prediction and
Demand-Capacity Balancing. In Seventh SESAR
Innovation Days. SESAR.
Fukuda, Y., Shirakawa, M., Senoguchi, A. (2010).
Development and evaluation of trajectory prediction
model. In Proceedings of 27th International Congress
of the Aeronautical Sciences (ICAS).
Guan, X., Lv, R., Sun, L., Liu, Y. (2016). A study of 4D
trajectory prediction based on machine deep learning.
In Proceedings of the 2016 12thWorld Congress on
Intelligent Control and Automation (WCICA).
Haiden, T., et al. (2019). Evaluation of ECMWF forecasts,
including the 2019 upgrade. In ECMWF Technical
Memoranda. ECMWF
Ma, L., Tian, S. (2020). A hybrid CNN-LSTM model for
aircraft 4D trajectory prediction. In IEEE Access, vol.
8, pp. 134668-134680. IEEE.
Nuic, A., Poles, D., Mouillet, V. (2010). BADA: An
advanced aircraft performance model for present and
future ATM systems. In International Journal of
Adaptive Control & Signal Processing, Vol. 24, pp.
850- 866.
Park, S.H.; Kim, B.; Kang, C.M.; Chung, C.C.; Choi, J.W.
(2018). Sequence-to-sequence prediction of vehicle
trajectory via LSTM encoder-decoder architecture. In
Proceedings of the 2018 IEEE Intelligent Vehicles
Symposium (IV).
Rivas, D. Franco, A., Valenzuela, A. (2017). Analysis of
aircraft trajectory uncertainty using Ensemble Weather
Forecasts. In Proceedings of 7
th
European Conference
for Aeronautics and Space Sciences (EUCASS).
Rodríguez-Sanz, A., et al. (2019). 4D-trajectory time
windows: definition and uncertainty management. In
Aircraft Engineering and Aerospace Tech., Vol. 91 No.
5, pp. 761-782.
Sankararaman, S., Daigle, M. (2017). Uncertainty
quantification in trajectory prediction for aircraft
operations. In AIAA Guidance, Navigation, and Control
(GNC) Conference. AIAA.
Schuster, W. (2015). Trajectory prediction for future air
traffic management–complex manoeuvres and taxiing.
In Aeronaut. J., Vol. 119 No. 1212, pp. 121–143.
Tan, P. N., Steinbach, M., Karpatne, A., Kumar, V. (2019).
Introduction to Data Mining. Pearson. 2
nd
edition.
Tastambekov, K., Puechmorel, S., Delahaye, D., Rabut, C
(2014). Aircraft trajectory forecasting using local
functional regression in Sobolev space. In Transp. Res.
Part C Emerg. Technol., Vol. 39, pp. 1–22.
Uzun, M., Koyuncu, E. (2017). Data-driven trajectory
uncertainty quantification for climbing aircraft to
improve ground-based trajectory prediction. In
ANADOLU Univ. J. Sci. Technol. - Appl. Sci. Eng., pp.
323–345.
Wang, Z., Liang, M., Delahaye, D. (2017). Short-term 4D
Trajectory Prediction Using Machine Learning
Methods. In Seventh SESAR Innovation Days. SESAR.
Wu, H.; Chen, Z.; Sun, W.; Zheng, B.; Wang, W. (2017).
Modeling Trajectories with Recurrent Neural
Networks. In Proceedings of the Twenty-Sixth
International Joint Conference on Artificial
Intelligence (IJCAI).
Zazzaro, G., et al. (2020). P4T: A Methodology to Support
the Flight Trajectory Prediction. In Tenth SESAR
Innovation Days. SESAR.
Zeh, T., Rosenow, J., Alligier, R., Fricke, H. (2020).
Prediction of the propagation of trajectory uncertainty
for climbing aircraft. In Proceedings of AIAA/IEEE
39th Digital Avionics Systems Conference (DASC).
Zhang, J., Liu, J., Hu, R., Zhu, H. (2018). Online four-
dimensional trajectory prediction method based on
aircraft intent updating. In Aerosp. Sci. Technol., Vol.
77, pp. 774–787.
Zhang, X., Mahadevan, S. (2020). Bayesian neural
networks for flight trajectory prediction and safety
assessment. In Decision Support Systems, Vol. 131.
A Data-Driven Methodology for Pre-Flight Trajectory Prediction
197
