
An Evolutionary-based Neural Network for Distinguishing between
Genuine and Posed Anger from Observers’ Pupillary Responses
Fan Wu
1
, Md Rakibul Hasan
2 a
and Md Zakir Hossain
3,4 b
1
School of Computing, Australian National University, Canberra ACT 2600, Australia
2
Department of Electrical and Electronic Engineering, BRAC University, Dhaka 1212, Bangladesh
3
CSIRO Agriculture & Food, Black Mountain, Canberra ACT 2600, Australia
4
Biological Data Science Institute, School of Biology, Australian National University, Canberra ACT 2600, Australia
Keywords:
Neural Network, Evolutionary Algorithm, Neural Network Pruning, Anger Veracity, Pupillary Response.
Abstract:
Future human-computing research could be enhanced by recognizing attitude/emotion (for example, anger)
from observers’ reactions (for example, pupillary responses). This paper analyzes observers’ pupillary re-
sponses by developing neural network (NN) models to distinguish between genuine and posed anger. Any
model’s relatively high classification accuracy means the pupillary responses and observed anger (genuine
or posed) are deeply connected. In this connection, we implemented strategies for tuning parameters of the
model, methods to optimize and compress the model structure, analyze the similarity of hidden units, and
decide which of them should be removed. We achieved the goal of removing the network’s redundant neurons
without significant performance decline and improved the training speed. Finally, our evolutionary-based NN
model showed the highest accuracy of 86% with a 3-layers structure and outperformed the backpropagation-
based NN. The high accuracy highlights the potential of our model to use in the future for distinguishing
observers’ reactions to emotion/attitude recognition.
1 INTRODUCTION
With the increase of technology utilization like smart-
phones and the Internet, computing appears not only
as traditional desktop computers but also in myriad
applications for the betterment of humans, such as
smart classrooms, smart sensing wearables for health-
care, wellness, and sports. Research in human com-
puting is emerging with a particular interest in rec-
ognizing, processing, and responding to users’ non-
verbal cues like emotions (Lim et al., 2020). Users’
emotions could be estimated from various reactions
such as pupillary response, facial expressions (Hos-
sain and Gedeon, 2017), and speech (Han et al.,
2014).
Anger is one of the strongest emotions, and
this characteristic makes anger easily felt by others
(Kannis-Dymand et al., 2019). However, anger seems
to be easily acted out. People are generally poor at
distinguishing genuine and acted anger, and their ac-
curacy is only around 65% (Qin et al., 2018). Au-
a
https://orcid.org/0000-0003-2565-5321
b
https://orcid.org/0000-0003-1892-831X
thors in (Qin et al., 2018) classified genuine and acted
anger using pupillary dilation signals in a combina-
tion of NNs and crowd prediction techniques, through
which they introduced their Misaka networks (collec-
tion of multiple NNs, and later their aggregation for
the final outcome). (Jin et al., 2020) compared anger
veracity classification performance between a fully-
connected NN and a long-short term memory net-
work utilizing observers’ pupillary responses. They
further applied an outlier detection technique to im-
prove performance. Their NN model employed two
hidden layers consisting of 20 and 10 hidden units,
respectively. Further, they used a dropout layer and
a batch normalization technique to prevent overfit-
ting. With a genetic-based feature selection method to
select observer’s pupillary response features, (Huang
et al., 2020) showed a performance improvement of
a two-stream NN model having 60 hidden neurons in
each sub-stream, followed by another layer for final
prediction. Few works (Qin et al., 2018; Jin et al.,
2020; Huang et al., 2020) focused on improving per-
formance by incorporating more computational bur-
dens, such as more hidden units, layers, etc. Our
contribution is to find out the simplest model possi-
Wu, F., Hasan, M. and Hossain, M.
An Evolutionary-based Neural Network for Distinguishing between Genuine and Posed Anger from Observers’ Pupillary Responses.
DOI: 10.5220/0010985100003116
In Proceedings of the 14th International Conference on Agents and Artificial Intelligence (ICAART 2022) - Volume 2, pages 653-661
ISBN: 978-989-758-547-0; ISSN: 2184-433X
Copyright
c
2022 by SCITEPRESS – Science and Technology Publications, Lda. All rights reserved
653

ble along with preserving a reasonable performance
score. We have two specific novel contributions com-
pared to the previous researches above—we further
prune our developed simple NN model by removing
redundant neurons, and we utilize evolutionary algo-
rithm (EA) training.
Other than anger, there are several works on
other emotion / facial expression recognition as well.
For example, (Hossain and Gedeon, 2017) classified
posed and genuine smiles from observers’ periph-
eral physiology (blood volume pulse, galvanic skin
response, and pupillary response), and (Irani et al.,
2016) recognized human stress using their facial im-
ages. Furthermore, authors in (Han et al., 2014) em-
ployed NN to estimate emotional state from speech
signals.
In this current paper’s scenario, instead of using
volunteers’ subjective judgment, we use their pupil-
lary responses as an objective discriminating result.
We utilize a set of data from (Chen et al., 2017)
containing information about perceivers’ pupillary re-
sponse when they were watching genuine or posed
anger videos. Consistently, we build up a NN model
to train on the collected data. If the model has a good
performance, we can say that perceivers can discrim-
inate between the two kinds of anger physiologically
and unconsciously. Also, we implement some net-
work optimization and reduction methods according
to (Wang, 2018) for improving our NN as good as
possible. This good result helps prove people’s ability
to discriminate posed and acted anger physiologically.
Besides using a usual backpropagation method to
train the NN, we also implement an EA to optimize
the network. The basic idea of using EA is that the tra-
ditional method gives us a model that does not reach
very high accuracy. We want to find whether the per-
formance problem can be attributed to the learning
being constrained to a local minimum or the best per-
formance of the NN model on this dataset has been
reached. Since (Korolev, 2010) showed that EA, as a
general method, can have a good effect on multiple-
minimum problems, we decided to implement EA.
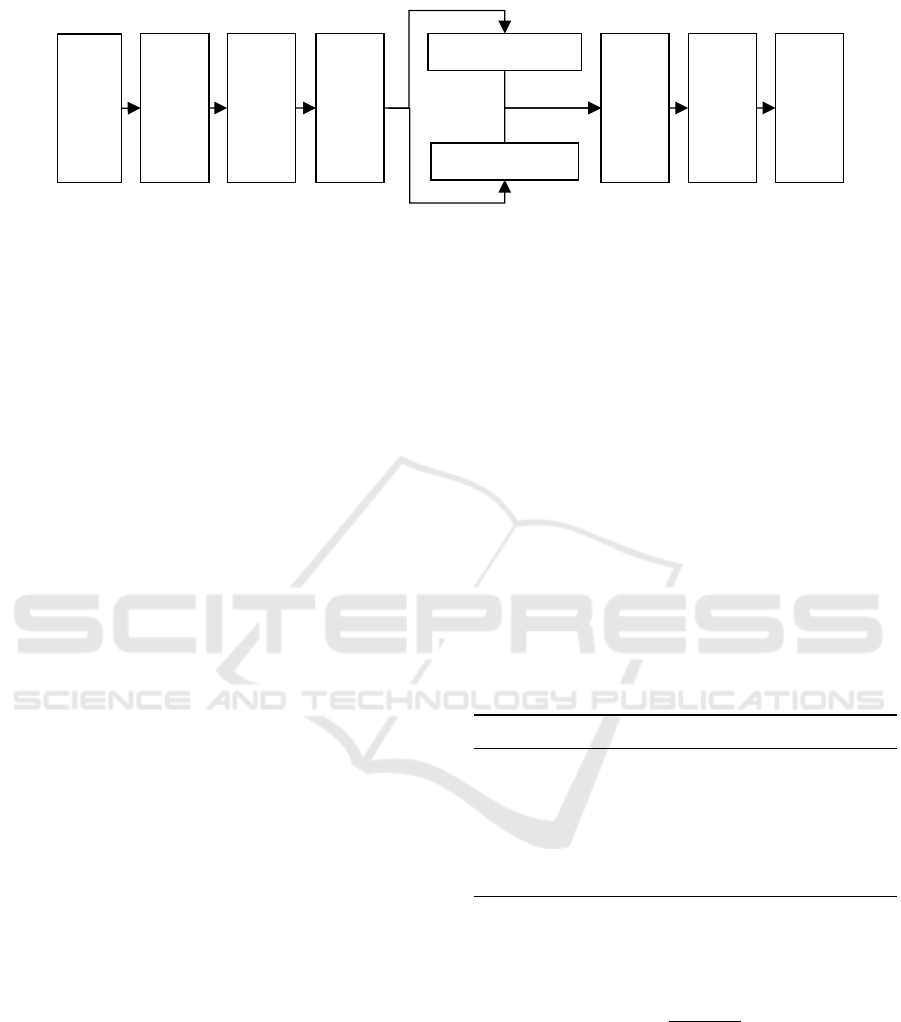
Figure 1 depicts the steps involved in this work.
An EA cannot be used on a classification problem
directly. For a NN with a fully-known structure, we
can generally regard the collection of all weights and
biases in the network as an individual, which means
every individual in the population corresponds to one
NN with that same structure. After that, we can apply
an EA to optimize the individual (NN).
After we train the model, we also want to optimize
its structure. The best structure of a NN usually can-
not be decided at first (Kowalski and Kusy, 2018). We
can initialize a NN with more extra neurons and then
reduce its redundancy (Tung and Mori, 2020). Re-
ducing the redundancies is beneficial, but this is diffi-
cult to decide which neuron should be removed. One
implemented strategy in (Wang, 2018) is to analyze
the output from the target hidden layer of the NN and
use the analysis result to decide which neurons to be
deleted.
2 METHOD
The outline of the technique implemented on the
dataset in this paper is divided into three parts. They
are explained as follows.
i. Developing a NN prediction model considering
observers’ pupillary responses: The network is
implemented with three layers of neurons with
basic techniques, including backpropagation and
cross-entropy loss function.
ii. Incorporating EA as a substitutional method to
optimize the NN model: We apply EA opti-
mization instead of backpropagation training and
compare the performance between EA and back-
propagation.
iii. Applying an appropriate pruning technique in the
NN model for data compression and reduction
(Gedeon and Harris, 1992; Wang, 2018): We
systematically reduce the number of hidden units
from our developed NN model to develop a sim-
ple yet effective model.
2.1 Classification of Genuine or Posed
Anger
The Anger dataset is collected from the literature
(Chen et al., 2017). Before describing specific meth-
ods to accomplish the classification task, a detailed
inspection of the dataset is given in the following sub-
section.
2.1.1 Data Inspection
The dataset is utilized to figure out the relationship
between humans’ unconscious physiological charac-
teristics and the observed anger videos. The experi-
ment where the data comes from asks 20 volunteers to
watch 20 videos. Among the 20 videos, there are 10
videos with genuine anger and 10 videos with posed
anger. All the videos came from YouTube, and the ex-
periment designer made the videos of genuine anger
from documentaries and news, while the posed anger
videos were made from movies. All other factors that
may potentially influence the volunteers’ judgment
ICAART 2022 - 14th International Conference on Agents and Artificial Intelligence
654
Genuine
or
Posed
Anger
videos
Observer
Pupillary
response
Neural
network
classifier
Back propagation
Optimization
Evolutionary Algorithm
Optimization
Trained
Network
Hidden
layer
Compres
sion
Target
Neural
network
Figure 1: Flowchart to obtain the target neural network architecture either via backpropagation optimizing or evolutionary
algorithm optimizing.
are removed as much as possible. For example, the
resolution of the videos was kept the same, and the
actors in the posed anger movies were not famous.
Therefore, the possibility of volunteers knowing the
actor and perceiving the acted anger in the movie was
reduced. Now, the dataset may seem small. However,
a similar work on genuine smile detection from ob-
servers’ physiological states also collected data from
20 observers watching 19 video samples (Hossain and
Gedeon, 2019). Furthermore, they reported accuracy
with increasing the number of observers and the num-
ber of training videos. Their research reveals that the
accuracy did not improve much at around 16–19 ob-
servers, and there was no increase in accuracy at all
after 14 videos. Therefore, around 16 observers and
14 videos appeared as the minimum number of ob-
servers and video samples required for satisfactory
performance. Thus, our dataset size having 20 ob-
servers and 20 videos is reasonable.
Six features/dimensions were extracted from the
dataset. The Mean and the Std refer to the mean
and standard deviation of observers’ pupillary re-
sponse. Diff1 and Diff2 refer to the change of ob-
server’s left and right pupil size, respectively. Fur-
thermore, PCAd1 and PCAd2 denote the orthogonal
linear transformation with the first and second princi-
pal components, respectively.
Figure 2 illustrates the density plots of all six di-
mensions from where we can find some clues, such
as different dimensions of data have different distri-
butions when they belong to genuine or posed la-
bels. Five dimensions out of six (except PCAd1) seem
to have similar density plots of the genuine and the
posed labels, which means they may contribute less
to the classification. Only input dimension PCAd1
shows noticeable differences between the two kinds
of data. To solve this kind of classification problem,
there are some common choices, including k-nearest
neighbor (KNN), support vector machine (SVM), and
NN according to (Hossain and Gedeon, 2017). How-
ever, for this dataset, the difference showed in PCAd1
may not support the KNN and SVM to perform well
in classifying the data. Compared with SVM and
KNN, authors of (Hossain and Gedeon, 2017) also
mentioned that the final accuracy result with the NN
was the best on their smile dataset. Thus, we decided
to build a NN for this anger classification problem.
Accordingly, our developed NN model represents the
genuine and posed labels as 0 and 1, respectively.
2.1.2 Data Preprocessing
Table 1 reports the average and standard deviation of
the six dimension input patterns, which needs pre-
processing. Otherwise, the learning process will be
significantly degraded since the Mean dimension can
have big weights when the training is in an early
phase.
Table 1: The average and standard deviation of six dimen-
sions of input data.
Dimension Average Standard Deviation
Mean 0.88909015 0.04603393
Std 0.10246244 0.06934124
Diff1 0.00842139 0.0065422
Diff2 0.20957463 0.08669128
PCAd1 0.03070341 0.01101771
PCAd2 0.12138183 0.0235699
Suitable data preprocessing can improve the per-
formance of data-driven models (Tang et al., 2020).
We conduct data preprocessing according to Equa-
tion (1).
x
0
=
x − x
mean
σ
x
(1)
where, x is the raw data before preprocessing, x
mean
and σ
x
are the mean and standard deviation of x, re-
spectively. The standardized data x
0
was considered
as input in the NN model.
One of the benefits of data preprocessing is speed-
ing up the training process. The Anger dataset takes
around 20000 epochs to converge without data pre-
processing with the same NN model, optimizer, and
loss function. On the other hand, it only takes 5000
An Evolutionary-based Neural Network for Distinguishing between Genuine and Posed Anger from Observers’ Pupillary Responses
655
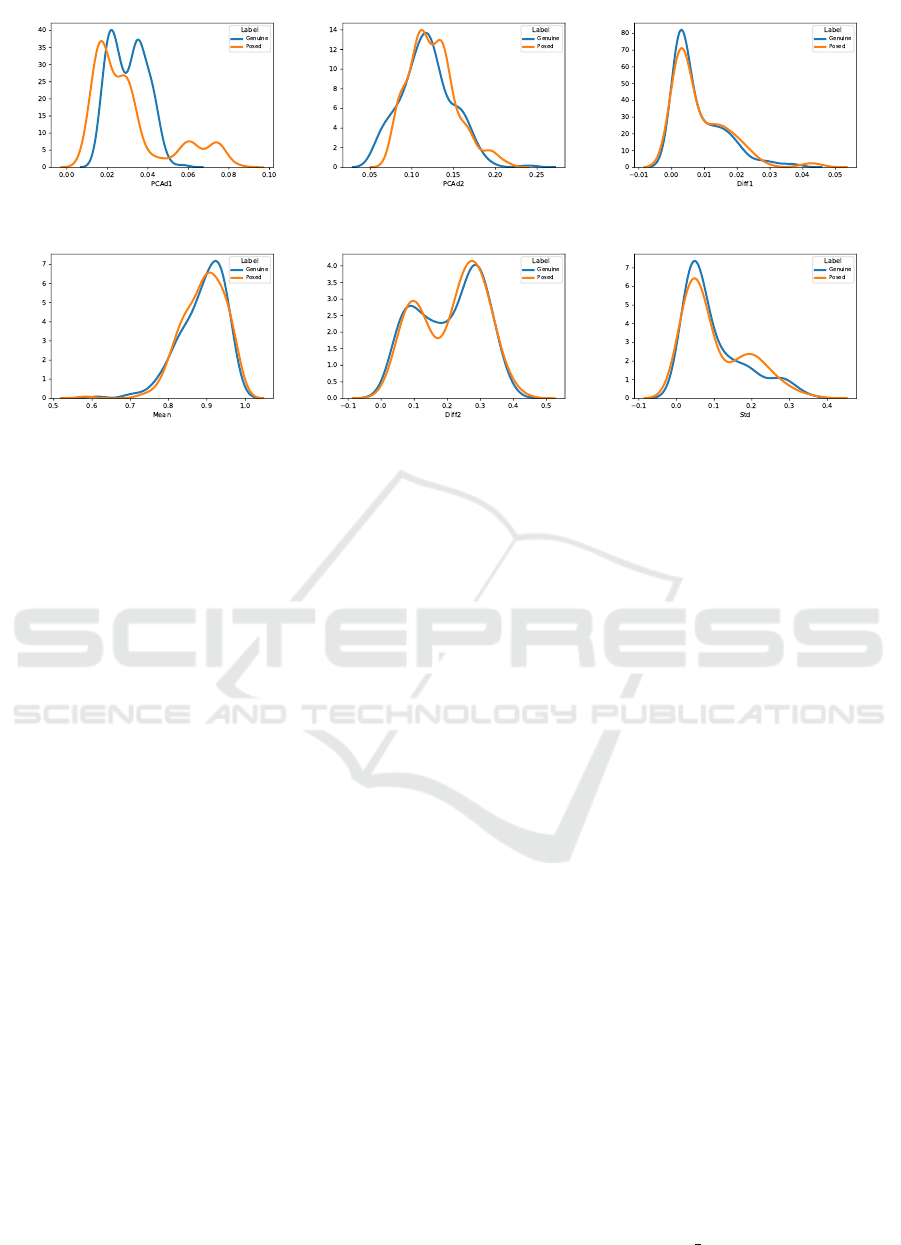
(a) PCAd1. (b) PCAd2. (c) Diff1.
(d) Mean. (e) Diff2. (f) Std.
Figure 2: Density plots for different input dimensions of genuine and posed labels.
epochs to converge after the above preprocessing.
One interesting thing is that although the learning rate
is the same for both cases, the reduction of the train-
ing loss for the model without data preprocessing is
very little in the first 5000 epochs. After 5000 epochs
of training, the reduction comes to a relatively nor-
mal speed. This phenomenon implies that the model
may consume much time in adapting to the unbal-
anced data.
2.1.3 Basic Neural Network Model
Except for input neurons, the built network has three
layers of neurons with 6, 6, and 1 neuron, respec-
tively. At first, the number of hidden neurons was
set to 10; however, it was reduced through systematic
performance tests.
The first and second hidden layers use activa-
tion function ReLU, and the last layer has activa-
tion function Sigmoid for classification purposes. The
loss function is binary cross-entropy which fits binary
classification problems along with Sigmoid function.
The optimization method is stochastic gradient de-
scent (SGD).
2.2 Evolutionary Algorithm on
Optimizing Neural Network
2.2.1 Coding of Individuals
The target NN, as mentioned above, has four layers
with an input of six units, two hidden layers of six
units each, and an output layer of one unit. Therefore,
to fully store weights and biases of the network, each
individual in the population needs to have a length
according to Equation (2).
L = Units
input
×Units
hidden1
+Units
hidden1
+Units
hidden1
×Units
hidden2
+Units
hidden2
+Units
hidden2
×Units
out put
+Units
out put
(2)
Since the network is fully connected, there are
(6 × 6) weights between the input layer and second
layer (i.e., first hidden layer), (6 × 6) weights be-
tween the second and third layers, and (6×1) weights
between the third and last layer ((i.e., output layer).
Additionally, we have (6 + 6 + 1) biases to store.
Therefore, the length of the individual code should be
91, consisting of all weights and biases. Individuals
should have a form according to Equation (3).
X
t
i
=
x
t
i1
, . . . , x
t
ik
, . . . , x
t
in
i = 1, 2, . . . , N (3)
where, x
t
ik
= real numbers of weights or bias, t = gen-
eration of the individual, i = number of individuals,
n = number of genes (91), and N = number of popu-
lations.
2.2.2 Evaluation Function (Decoding of
Individuals)
To evaluate an individual in the population, we ex-
tract real numbers from it and assign the real num-
bers’ value to NN parameters.
After assigning the values, we have the new net-
work with weights and biases optimized by the EA.
Then we apply the evaluate accuracy method, which
is used in the backpropagation optimization to get the
ICAART 2022 - 14th International Conference on Agents and Artificial Intelligence
656

accuracy on the whole dataset. Then we take it as the
fitness of this particular individual. Accordingly, we
need to maximize the fitness function during the pro-
cess of EA.
2.2.3 Population Initialization
Every individual is initialized by a random number
generator that generates 91 real numbers with stan-
dard normal distribution. As such, we generate 100
individuals as the initial population.
2.2.4 Selection
We use tournament selection to select the best indi-
viduals from the total population, where the tournsize
parameter is set to three. Therefore, every time, we
randomly pick up three individuals from the popula-
tion and choose the individual with the best fitness to
the pool of offspring. The procedure will repeat until
the required number of individuals has been selected.
2.2.5 Crossover
We have used blend crossover to realize gene transfer
in the population.
2.2.6 Mutation
For every gene (real number) in the mutated individ-
ual, there will be an independent probability that this
gene will change to a random number selected ac-
cording to the Gaussian distribution with the mean
value unchanged. The variance of the Gaussian dis-
tribution is set to 0.1, and the independent probability
is 0.4.
2.2.7 General Settings
For the EA, we initialize the population as 100 indi-
viduals. The crossover probability is 0.8, the muta-
tion probability is 0.4, and we set the algorithm will
run for 800 generations.
2.3 Compression on Hidden Layer
After implementing a NN classifying genuine and
posed anger and using an EA to optimize it, we want
to address the problem that if the 6, 6, 1 layer structure
of the network has some redundancies. So, we con-
duct the following analysis and techniques to reduce
the hidden layer units of the trained NN.
2.3.1 Distinctiveness Analysis
This analysis is towards the activation matrix, which
is the output matrix of a particular layer of neurons
when all training input enters the model. Every col-
umn of the matrix is a vector that corresponds to a
neuron. Thus, we can analyze the distinctiveness be-
tween units according to these vectors. The steps im-
plementing this analysis are shown below:
i. We calculate the activation matrix for the hidden
units in the layer to be analyzed, which is the sec-
ond hidden layer.
ii. We know that every column in the activation
matrix corresponds to one hidden unit’s output.
Thus, by analyzing the similarities between these
columns, we can get the distinctiveness of hidden
units. We use cosine similarity (Equation (4)) to
measure distinctiveness.
cos similarity =
V
i
·V
j
kV
i
k · kV
j
k
(4)
where, V
i
and V
j
are the i
th
and j
th
column vectors
of the activation matrix.
iii. For every two hidden units in the second hid-
den layer, we analyze their similarities. Then we
record the most similar two units’ index i and j.
2.3.2 Pruning Network
After finding two similar hidden units, we deleted the
first unit and added its weights and bias to the second
unit. We delete one of the most similar two hidden
units in the second hidden layer whenever we prune
the network. Then we fine-tune the network with
1000 epochs using backpropagation training.
3 RESULT AND DISCUSSION
3.1 Neural Network and Its Basic
Optimization
At first, the model is trained with not-preprocessed
data. After training several times with different learn-
ing rates, and finally at 0.05 with a momentum of 0.8,
the best test accuracy is not higher than 55% as shown
in Figure 3a. First useful optimization is to change the
activation function from ReLU to tanh. After using
tanh as the first two layers’ activation function, test
accuracy can reach around 58% as Figure 3b depicts.
Then the data is preprocessed, and thus the speed
of learning is found much higher. After using differ-
ent activation functions, ReLU retrieves the best func-
tion position. With preprocessed data, ReLU function,
An Evolutionary-based Neural Network for Distinguishing between Genuine and Posed Anger from Observers’ Pupillary Responses
657
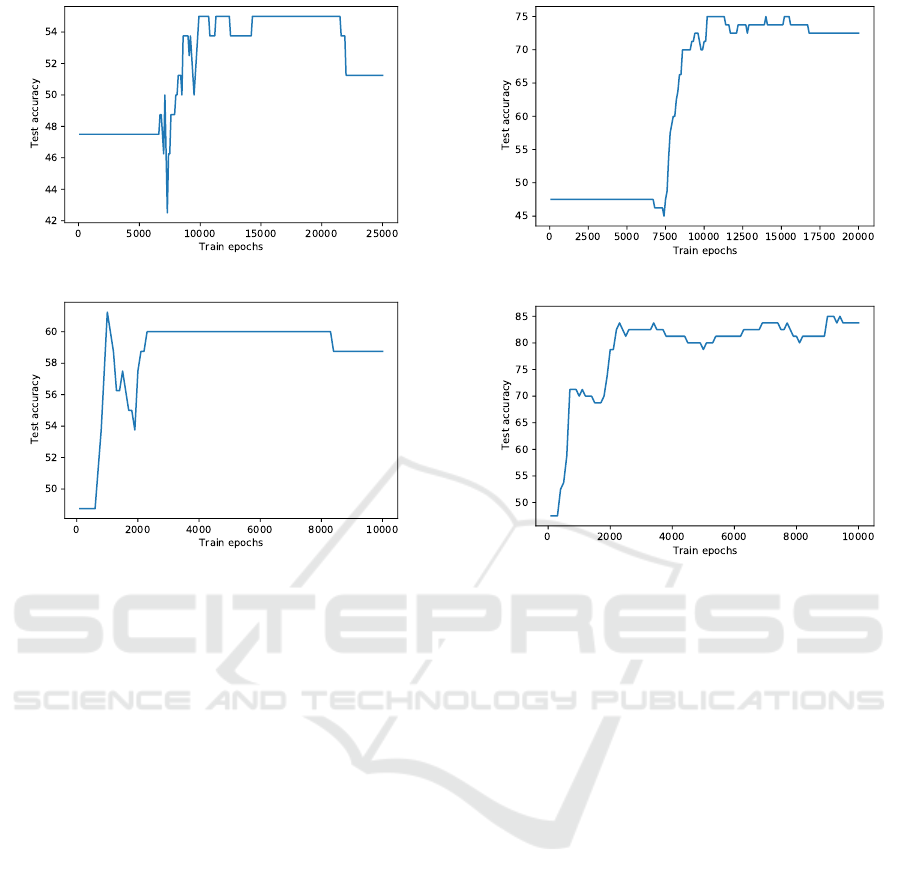
(a) ReLU.
(b) tanh.
Figure 3: Test accuracy with not-preprocessed data at two
different activation functions.
and learning rate of 0.001, the model can achieve the
best test accuracy of around 75% (Figure 4a). How-
ever, tanh does not have a good performance in this
case. After preprocessing the data, one of the most
important factors of the model which we can tune
is the learning rate, and the final progress is made
by raising this learning rate. When the learning rate
is higher than 0.01 (0.017 in Figure 4b) with a mo-
mentum of 0.9, the best test accuracy can reach 85%
shown in Figure 4b.
3.2 Evolutionary Algorithm for
Optimization
The design of EA for optimizing the NN is presented
previously in Section 2.2. The accuracy with that EA
optimization is shown in Figure 5.
Since we randomly initialize all weights and bi-
ases of the network, the mean accuracy of individuals
at initial generation is 50%. Then with the progress
of evolution, the best accuracy raises to around 86%.
For this optimization method, we can use the best in-
dividual in the last generation of the population as the
final weights and biases for our NN. Therefore, we
can conclude that the EA has trained the model to an
accuracy of 86%.
(a) Learning rate = 0.001.
(b) Learning rate = 0.017.
Figure 4: Test accuracy with preprocessed data and ReLU
activation function at two different learning rates.
3.3 Neural Network Pruning
While implementing the hidden-layer pruning pro-
cess, we investigate the influence of pruning hidden
units on the model’s performance. To demonstrate the
pruning process, Figure 6a to 6d shows the accuracy
results of the network after pruning one, two, three,
and four hidden units, respectively. Without pruning,
the network is first trained 10000 epochs of backprop-
agation. Then every time, we prune one hidden layer
unit from the network and train another 1000 epochs.
According to the pruning result, although the net-
work with six hidden units can learn well, there is
still space to optimize the model since some hidden
units are redundant. When we reduce the number
of hidden units to three, the model’s performance re-
mains around 90% of its peak. However, when we
deleted the fourth unit, the performance declined sig-
nificantly. Therefore, we can conclude that this model
may need at least three hidden units in the hidden lay-
ers to learn from data. This analysis supports the con-
clusion in (Gedeon and Harris, 1992) that when we
want to compress an image with a large scaler, the
quality will decline because the remaining units in the
hidden layer are not enough to store the majority of
information of the image.
ICAART 2022 - 14th International Conference on Agents and Artificial Intelligence
658
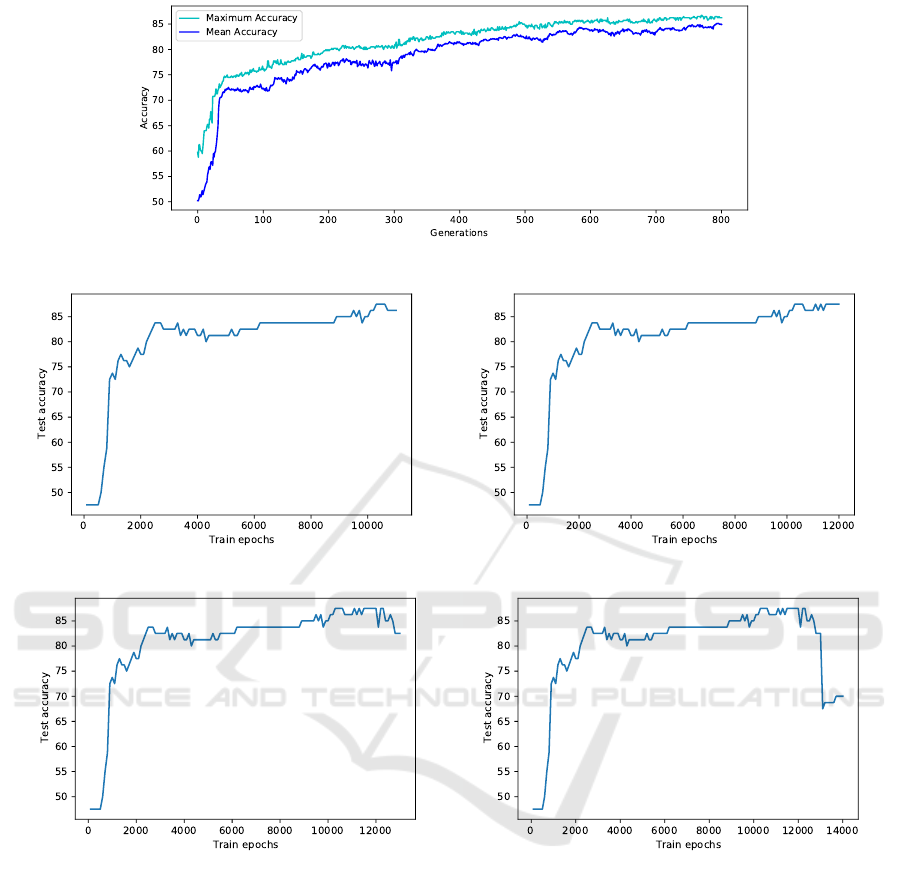
Figure 5: Accuracy of the neural network model optimized by evolutionary algorithm.
(a) One unit pruned. (b) Two units pruned.
(c) Three units pruned. (d) Four units pruned.
Figure 6: Accuracies with the pruning process on the hidden layer. Each time, one hidden unit is removed, and the model is
trained for another 1000 epochs of backpropagation.
4 COMPARISON AND
LIMITATIONS
Firstly, we can compare the backpropagation training
method and EA results on the NN. After tuning sev-
eral hyperparameters of the backpropagation method,
the model after 10000 epochs of training can reach an
accuracy of 85%. On the contrary, the EA achieves an
accuracy of 86% with 800 generations of evolution.
These two similar accuracies can address the prob-
lem we mentioned in the Introduction section: can the
backpropagation method obtain 85% accuracy due to
being constrained by some local minimum? We can-
not conclude with complete certainty, but the answer
can be ‘no’ because EA usually has a good perfor-
mance on finding the global best solution, and its best
accuracy is still around 85%.
Table 2 reports a performance comparison among
NN-based anger veracity recognition using the same
Anger dataset we utilized in this study.
The table reveals that (Huang et al., 2020) re-
ported around 93.6% accuracy. They achieved this
An Evolutionary-based Neural Network for Distinguishing between Genuine and Posed Anger from Observers’ Pupillary Responses
659

Table 2: Performance comparison among similar NN-based
works that utilized the same Anger dataset.
Reference Accuracy
(Huang et al., 2020) 93.6%
Proposed 86.0%
(Qin et al., 2018) 83.3%
(Jin et al., 2020) 79.7%
score using a two-stream NN-based model, where
each sub-stream has 60 hidden neurons followed by
a single fully-connected final prediction layer. It is
worth noticing that we used a simpler feedforward
single stream architecture with only twelve hidden
units, which is at least ten times less than what they
used. We aimed to achieve reasonable accuracy using
minimum computational burden (hidden units). We
fulfill our aim by accomplishing a reasonably good
performance (86%) with a simple structure after tun-
ing the hyperparameter and hidden layer compres-
sion.
5 CONCLUSION AND FUTURE
WORK
Anger is one of the many powerful emotions of hu-
mans, and finding its authenticity is essential in emo-
tion recognition and human-centered computing ar-
eas. We have developed a simple NN to classify real
and posed anger based on observers’ pupillary re-
sponses. Our research indicates that the anger classi-
fication is achievable by employing this simple struc-
tured NN. We have optimized the NN in two ways,
namely backpropagation and EA. With some rea-
sonable adjustment during testing the network, we
have developed a model that provided as high as
86% accuracy. This high accuracy proved that per-
ceivers’ pupillary response patterns could reflect the
anger they saw as genuine or posed even though the
perceivers are unconscious. Furthermore, our study
shows that three neurons can be removed without sig-
nificant performance degradation through NN prun-
ing.
To ensure the superiority of our proposed ap-
proach, future works will include alternative mod-
els to benchmark and various statistical tests, for ex-
ample Augmented Dickey-Fuller test, Kolmogorov-
Smirnova test, and Shapiro-Wilk test (Fan et al.,
2021) to validate. To build a relationship between
emotion and speech, authors in (Han et al., 2014) have
developed an efficient single-hidden-layer NN (called
extreme learning machine) for emotion recognition
based on utterance level speech features. Therefore,
for future work, we shall design and optimize a net-
work that uses people’s speech emotion to predict
whether their facial emotion is genuine or not, which
could be interesting. Moreover, we can also imple-
ment advanced network pruning techniques, such as
using thresholds and structured filter level pruning
(Luo et al., 2017).
REFERENCES
Chen, L., Gedeon, T., Hossain, M. Z., and Caldwell, S.
(2017). Are you really angry? detecting emotion ve-
racity as a proposed tool for interaction. In Proceed-
ings of the 29th Australian Conference on Computer-
Human Interaction, OZCHI ’17, page 412–416, New
York, NY, USA. Association for Computing Machin-
ery.
Fan, G.-F., Yu, M., Dong, S.-Q., Yeh, Y.-H., and Hong, W.-
C. (2021). Forecasting short-term electricity load us-
ing hybrid support vector regression with grey catas-
trophe and random forest modeling. Utilities Policy,
73:101294.
Gedeon, T. and Harris, D. (1992). Progressive image
compression. In [Proceedings 1992] IJCNN Inter-
national Joint Conference on Neural Networks, vol-
ume 4, pages 403–407.
Han, K., Yu, D., and Tashev, I. (2014). Speech emotion
recognition using deep neural network and extreme
learning machine. In Fifteenth annual conference of
the international speech communication association
(INTERSPEECH), pages 223–227.
Hossain, M. Z. and Gedeon, T. (2017). Classifying posed
and real smiles from observers’ peripheral physiol-
ogy. In Proceedings of the 11th EAI International
Conference on Pervasive Computing Technologies for
Healthcare, PervasiveHealth ’17, page 460–463, New
York, NY, USA. Association for Computing Machin-
ery.
Hossain, M. Z. and Gedeon, T. (2019). Observers’ physi-
ological measures in response to videos can be used
to detect genuine smiles. International Journal of
Human-Computer Studies, 122:232–241.
Huang, C., Zhu, X., and Gedeon, T. (2020). A genetic
feature selection based two-stream neural network for
anger veracity recognition. In Yang, H., Pasupa, K.,
Leung, A. C.-S., Kwok, J. T., Chan, J. H., and King,
I., editors, Neural Information Processing, pages 3–
11, Cham. Springer International Publishing.
Irani, R., Nasrollahi, K., Dhall, A., Moeslund, T. B., and
Gedeon, T. (2016). Thermal super-pixels for bimodal
stress recognition. In 2016 Sixth International Con-
ference on Image Processing Theory, Tools and Appli-
cations (IPTA), pages 1–6.
Jin, R., Zhu, X., and Fu, Y.-S. (2020). Identifying anger ve-
racity using neural network and long-short term mem-
ory with bimodal distribution removal. In Yang, H.,
Pasupa, K., Leung, A. C.-S., Kwok, J. T., Chan, J. H.,
and King, I., editors, Neural Information Processing,
ICAART 2022 - 14th International Conference on Agents and Artificial Intelligence
660

pages 240–247, Cham. Springer International Pub-
lishing.
Kannis-Dymand, L., Salguero, J. M., Ramos-Cejudo, J.,
and Novaco, R. W. (2019). Dimensions of anger
reactions-revised (dar-r): Validation of a brief anger
measure in australia and spain. Journal of Clinical
Psychology, 75(7):1233–1248.
Korolev, L. (2010). Evolutional computations and neuronet
and genetic algorithms—formal statements. Journal
of Mathematical Sciences, 168(1):80–88.
Kowalski, P. A. and Kusy, M. (2018). Sensitivity analysis
for probabilistic neural network structure reduction.
IEEE Transactions on Neural Networks and Learning
Systems, 29(5):1919–1932.
Lim, J. Z., Mountstephens, J., and Teo, J. (2020). Emo-
tion recognition using eye-tracking: Taxonomy, re-
view and current challenges. Sensors, 20(8):1–21.
Luo, J.-H., Wu, J., and Lin, W. (2017). Thinet: A filter level
pruning method for deep neural network compression.
In 2017 IEEE International Conference on Computer
Vision (ICCV), pages 5068–5076.
Qin, Z., Gedeon, T., Chen, L., Zhu, X., and Hossain, M. Z.
(2018). Artificial neural networks can distinguish gen-
uine and acted anger by synthesizing pupillary dila-
tion signals from different participants. In Cheng, L.,
Leung, A. C. S., and Ozawa, S., editors, Neural Infor-
mation Processing, pages 299–310, Cham. Springer
International Publishing.
Tang, S., Yuan, S., and Zhu, Y. (2020). Data preprocess-
ing techniques in convolutional neural network based
on fault diagnosis towards rotating machinery. IEEE
Access, 8:149487–149496.
Tung, F. and Mori, G. (2020). Deep neural network com-
pression by in-parallel pruning-quantization. IEEE
Transactions on Pattern Analysis and Machine Intel-
ligence, 42(3):568–579.
Wang, Z. (2018). Abalone age prediction employing a cas-
cade network algorithm and conditional generative ad-
versarial networks. Research School of Computer Sci-
ence, Australian National University, Canberra.
An Evolutionary-based Neural Network for Distinguishing between Genuine and Posed Anger from Observers’ Pupillary Responses
661
