
End-user Development for Smart Spaces: A Comparison of Block and
Data-flow Programming
Marcel Altendeitering
1
and Sonja Schimmler
2
1
Fraunhofer ISST, Dortmund, Germany
2
Fraunhofer FOKUS, Berlin, Germany
Keywords:
Block Programming, Data-flow Programming, Visual Languages, Smart Spaces.
Abstract:
Block and data-flow programming are well-known concepts for enabling end users to visually create their own
customized solutions. They both offer comprehensive visual interfaces and are becoming popular within the
smart spaces domain. However, there is currently no systematic, comparative evaluation of the two concepts
in the domain. In this user study, we implemented two prototypes for block and data-flow programming and
compared their performance on typical usage scenarios in common smart spaces. We used a mixed methods
approach of quantitative and qualitative analysis to gain an in-depth understanding of the user experience.
Our results show that data-flow programming is overall better received by users than block programming
and is considered being state-of-the art and visually more appealing. For block programming, our results
reveal that participants appreciate the playful character and the feedback provided. Our study contributes
to the improvement of block and data-flow solutions in place and discusses aspects relevant to the future
advancement of end-user development in smart spaces.
1 INTRODUCTION AND
RELATED WORK
Smart spaces that support people in their daily lives
are more and more becoming a reality (Mennicken
et al., 2014). The availability of affordable hardware
fosters the introduction of smart devices in different
areas and tailored services are connecting these de-
vices in a useful manner (Jensen et al., 2018). How-
ever, the smart spaces that surround our modern lives
are inherently complex and make it difficult to design
one-size-fits-all solutions (Mennicken et al., 2014).
Not all services that the inhabitants of smart spaces
(e.g., smart homes, smart cities, etc.) desire are
known a priori. End users have the best knowledge
of their requirements, can build the functions they de-
sire, and invent novel services that were not intended
by system designers (Coutaz et al., 2010; Jensen et al.,
2018; Mennicken et al., 2014).
At the same time, users of smart spaces want to
be in control and have the ability to regulate all as-
pects of their lives with cyber-physical technologies
surrounding them (Davidoff et al., 2006). However,
existing solutions for configuring smart spaces are of-
ten considered as being too complicated or not offer-
ing sufficient functionalities (Reisinger et al., 2017;
Altendeitering and Schimmler, 2020).
To address these problems, low code visual pro-
gramming languages have become wide-spread meth-
ods for interacting with smart spaces as they enable
end-users without coding knowledge to create cus-
tomized solutions (Reisinger et al., 2017; Altendeit-
ering and Schimmler, 2020). To provide adequate us-
ability and accessibility, it is important to utilize a vi-
sual language that is suitable for a specific user group.
Otherwise, inexperienced users could face barriers
that hinder them from fully exploiting the possibili-
ties offered by smart spaces (Davidoff et al., 2006).
In literature and practice, form-filling (e.g.,
(IFTTT, 2021)), data-flow (e.g., (Node-RED, 2021)),
and block programming (e.g., (Blockly, 2021;
Scratch, 2021)) are well-established visual program-
ming concepts. These approaches have in com-
mon that they try to reduce the semantic, syntac-
tic, and pragmatic barriers to programming inexpe-
rienced users are facing. They are different in their
expressiveness, visual representation and cognitive
style (Ur et al., 2014; Reisinger et al., 2017). Block
and data-flow programming tools come with a more
comprehensive visual interface as compared to form-
filling solutions and are becoming increasingly pop-
ular within the smart spaces domain (Altendeitering
Altendeitering, M. and Schimmler, S.
End-user Development for Smart Spaces: A Comparison of Block and Data-flow Programming.
DOI: 10.5220/0010983200003203
In Proceedings of the 11th International Conference on Smart Cities and Green ICT Systems (SMARTGREENS 2022), pages 15-22
ISBN: 978-989-758-572-2; ISSN: 2184-4968
Copyright
c
2022 by SCITEPRESS – Science and Technology Publications, Lda. All rights reserved
15

and Schimmler, 2020; Reisinger et al., 2017).
Several studies examined the differences between
programming paradigms in different scenarios. Most
of them focus on the differences between graphical
and textual approaches (e.g., (Stein and Hanenberg,
2011; Weintrop and Wilensky, 2015)). The two stud-
ies that come closest to the idea of our paper are
(Reisinger et al., 2017) and (Mason and Dave, 2017).
In the paper of (Reisinger et al., 2017), the authors
compared form-filling and data-flow programming
concepts using exemplary usage scenarios. They
found that data-flow excels form-filling through a bet-
ter comprehensiveness and usability. In the short pa-
per of (Mason and Dave, 2017), the authors inves-
tigated the differences between block and data-flow
programming, similar to our study. However, only
preliminary results were presented and no in-depth in-
vestigation of the two concepts was provided.
With our study we want to contribute such an in-
depth analysis and help researchers and practitioners
to distinguish the concepts and determine which one
is preferable. We, therefore, conducted a compar-
ative evaluation and implemented a visual language
in two exemplary prototypes for block and data-flow
programming that enable the creation of typical usage
scenarios in smart spaces. Specifically, we formulated
the following research question:
• Research Question: What are the differences in
user perception between block and data-flow pro-
gramming within smart spaces? Can known dif-
ferences be replicated?
The remainder of this article is structured as fol-
lows. In Section 2, we start by describing our re-
search methodology including the prototypes we re-
alized and the experimental setting. In Section 3, we
present the results of our study. We conclude with a
discussion of the results in Section 4.
2 RESEARCH METHODOLOGY
To answer the proposed research questions, we con-
ducted a mixed methods user study on two proto-
types for the visual programming paradigms under
investigation. We decided to apply a mixed meth-
ods approach of (1) quantitative and (2) qualitative
analysis to increase the robustness of our results by
triangulating different methods for the same phe-
nomenon (Graziano and Raulin, 1993; Zhao et al.,
2019). Specifically, we followed the example of
(Reisinger et al., 2017) and conducted a laboratory
user study with twelve participants, a sufficient num-
ber for finding most usability issues (Nielsen and
Landauer, 1993). Hereby, the participants were con-
fronted with three tasks based on typical usage sce-
narios in smart spaces and asked to solve these tasks
using both prototypes (Zhao et al., 2019).
2.1 Participants
Of the twelve participants five were female and seven
were male. Potential candidates were recruited from
the scope of a German smart spaces research project
and approached by email. The participants’ mean age
was 26.67 with a standard deviation (SD) of 3.61. The
group of participants had an average computer liter-
acy with a mean of 2.92 on a scale from 1 to 5. The
programming knowledge was slightly below average
with a mean of 2. Only one participant reported to
have high programming skills. All other participants
reported low to medium programming skills. Both,
the computer literacy and programming knowledge,
were self-reported by the participants.
Everyone was familiar with the concept of smart
spaces or smart homes. Two persons had heard of
Node-RED before, but did not use it on a regular ba-
sis. The other participants had not heard of either
Node-RED or Blockly before. Overall, our user group
is not representative for the general population, but
matches a typical smart spaces user group, which con-
sists of young adults with an interest in digital tech-
nologies and limited programming skills (Reisinger
et al., 2017; Altendeitering and Schimmler, 2020).
2.2 Experimental Setting
To evaluate the participants’ performance, we de-
fined three common usage scenarios for programming
smart spaces. We based these usage scenarios on use
cases that were presented in related studies (Altendei-
tering and Schimmler, 2020; Reisinger et al., 2017;
Mason and Dave, 2017). We decided to use generic
usage scenarios instead of concrete task descriptions
to gain a better understanding of the ease of use of
the two prototypes for inexperienced users. The three
scenarios vary in their difficulty, which we specified
as the amount of block or data-flow items that are re-
quired to realize the respective scenario (see Table 1).
For enabling the participants to realize the de-
scribed usage scenarios we created a visual language
and two prototypes for block and data-flow program-
ming. For this, we extended the standard vocabu-
lary of established solutions with custom blocks (for
block programming) and nodes (for data-flow pro-
gramming). Specifically, we created artifacts for
accessing the relevant data sources from the smart
spaces (i.e., Smart Parking, Smart Home, Smart Me-
SMARTGREENS 2022 - 11th International Conference on Smart Cities and Green ICT Systems
16

Table 1: Usage scenarios for smart spaces.
Scenario Elements
[Flow/Block]
Difficulty Description Custom Artifacts
Smart Parking (a) 6/7 easy
After work, I want to spend as lit-
tle time as possible looking for a
parking lot. Notify me on the way
home if there are free parking lots
available.
Energy consumption
sensor for TV, fridge,
and oven; Warning and
Information engine
Smart Home (b) 7/9 medium
I want the air quality in my apart-
ment to be good. Open a window
when the air quality inside is poor
and good outside.
Air Quality sensor inside
and outside; Open Win-
dow function; method
for determining whether
Air Quality is good
Smart Meter (c) 13/13 hard
The power consumption of my
three appliances (TV, fridge,
oven) is very high. Warn me if
I consume more than 10 kWh
and inform me which device
consumes the most.
Energy consumption
sensor for TV, fridge,
and oven; Warning and
Information engine
ter) and organized these in categories that are named
after the respective smart space. We implemented a
demo back-end to provide the data sources with ex-
emplary sensor streams. Additionally, we included a
separate category that contains useful artifacts (e.g.,
for determining whether the air quality is sufficient)
to simplify the usage of the two prototypes. Overall,
we included twelve new custom artifacts to enable the
creation of the usage scenarios (see Table 1).
To create a realistic experience, we used existing
solutions (e.g., (Xiaomi, 2021; Homee, 2021; Lox-
one, 2021)) as an example for the styling and naming
of our custom artifacts. All other required artifacts
remained in the standard categorization of the block
and data-flow programming solutions we used. Both
prototypes offered an open canvas and allowed partic-
ipants to freely combine blocks or nodes in their own
way. There was no pre-defined structure and all tasks
offered multiple ways to achieve the desired outcome.
We implemented the block-programming proto-
type on Google Blockly (Blockly, 2021). We decided
to extend Blockly as it is a well-established and eas-
ily extensible block programming language. Figure 1
shows an implementation of the smart home task.
For the data-flow programming prototype we used
Node-RED (Node-RED, 2021) as a basis. We chose
to use Node-RED as it has a broad community that of-
fers many extensions and custom developments and is
well documented. In addition to creating new nodes,
Node-RED offers the possibility to create sub-flows,
which are made up of existing Node-RED blocks. We
used this possibility instead of creating new nodes
wherever possible. Figure 2 displays a realization of
the smart home task using the Node-RED based data-
flow prototype.
2.3 Measures & Data Analysis
Following the described mixed methods approach,
our data analysis has two separate parts: quantitative
and qualitative analysis.
2.3.1 Quantitative
With our quantitative analysis we followed the exam-
ple of (Reisinger et al., 2017), who conducted a sim-
ilar study. It consists of six measures based on the
usability factors (UFs) proposed by (Nielsen, 1994)
(see Table 2).
For the Task Completion Time (measure 1) we
manually tracked the time the participants spent on
the prototype trying to solve the tasks at hand. To
determine the Task Completion Rate (measure 2), we
analyzed the participants’ final programs after com-
pletion. We defined this measures as the number
of elements used in the optimal solution minus the
number of corrective steps needed. For measures 3
and 4 the participants rated their Perceived Success
and the Perceived Difficulty of the respective pro-
totype on a 7-item Likert scale. For analysis, we
used a MANOVA with these measures as dependent
variables and the respective prototype as independent
variable (Graziano and Raulin, 1993).
We investigated measure 5 with a standardized
User Experience Questionnaire (UEQ) as introduced
by (Laugwitz et al., 2008). For an analysis of the UEQ
End-user Development for Smart Spaces: A Comparison of Block and Data-flow Programming
17
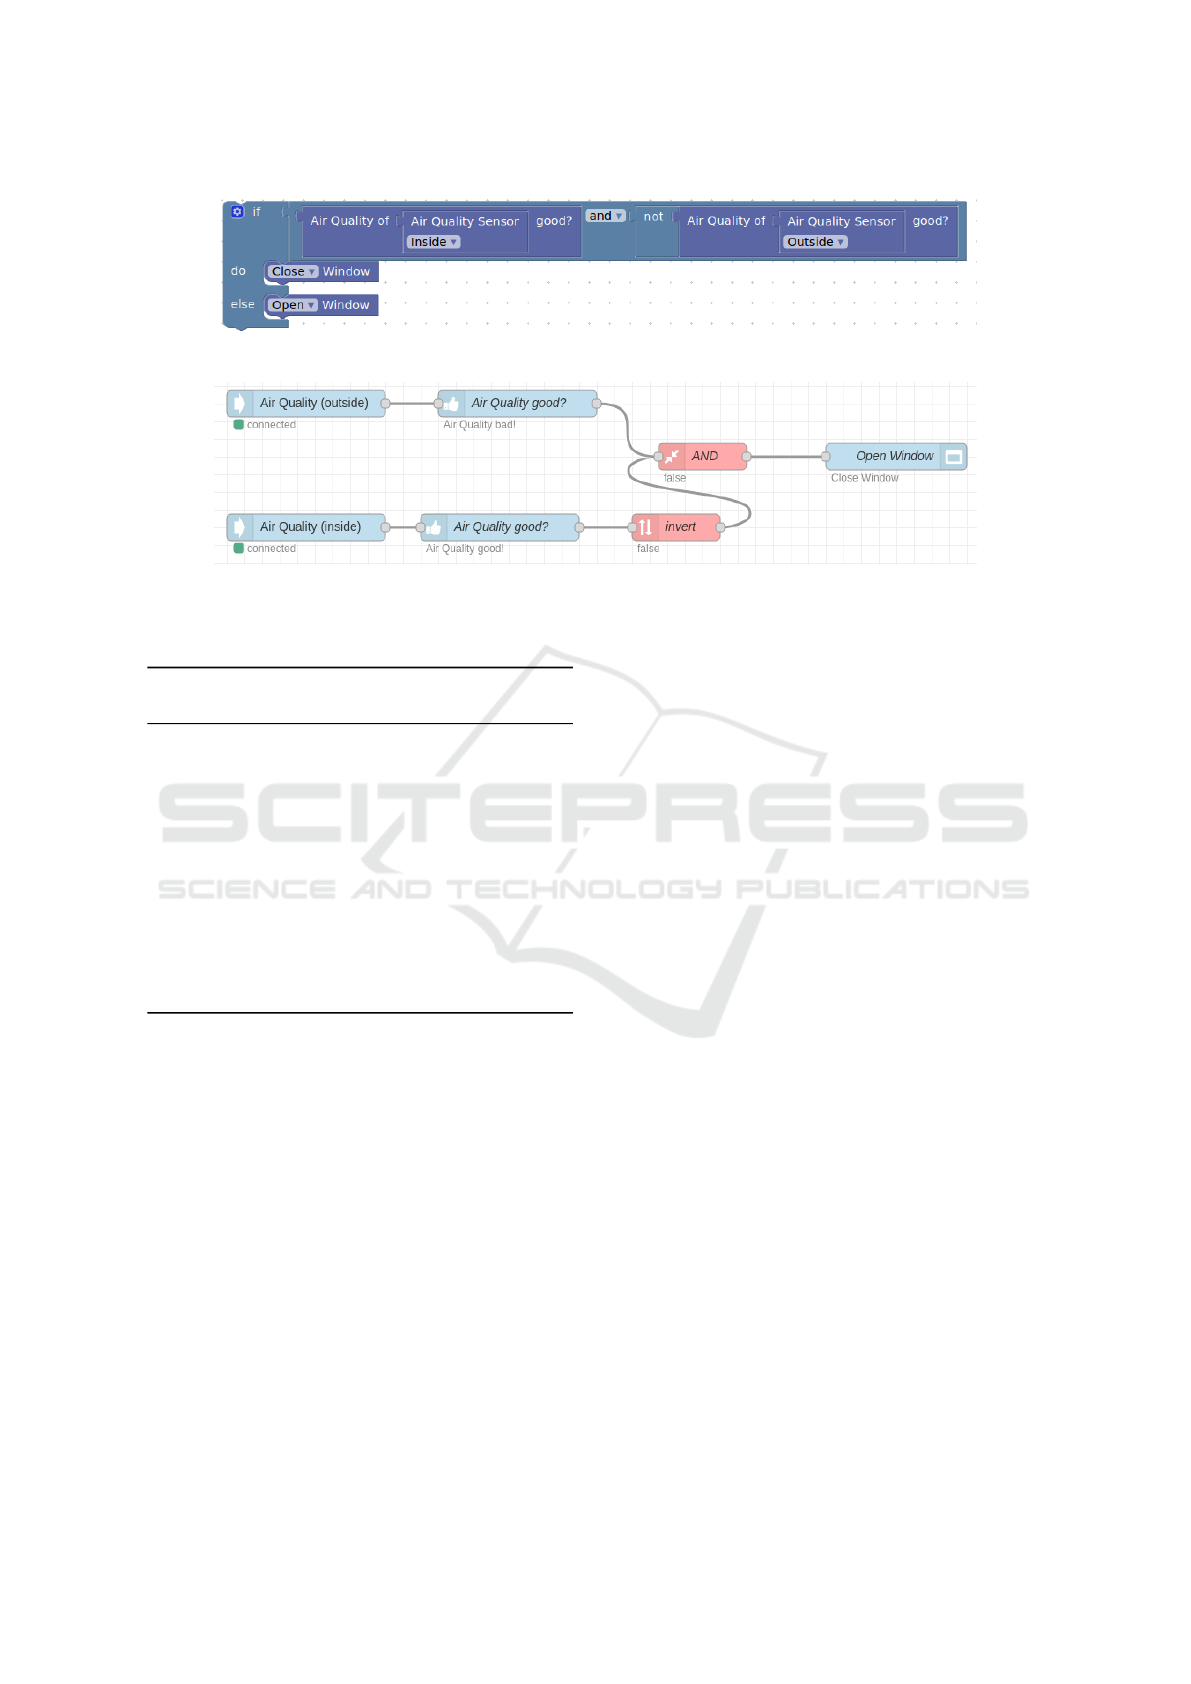
Figure 1: Block programming prototype showing the smart home task (b).
Figure 2: Data-flow programming prototype showing the smart home task (b).
Table 2: Six measures for performance and usability analy-
sis (based on (Nielsen, 1994)).
# Measure Usability Factor
(UF)
1 Task Completion Time Efficiency
2 Task Completion Rate Errors
3 Perceived Success Satisfaction, Learn-
ability
4 Perceived Difficulty Satisfaction, Learn-
ability
5 UEQ Satisfaction, Learn-
ability
6 Self-Assessment Memorability,
Learnability
we used descriptive statistical measures. These con-
tain the calculation of mean, standard deviation (SD),
and effect sizes (Graziano and Raulin, 1993). Effect
sizes were calculated with Cohen’s d (Cohen, 1992).
For the Self-Assessment (measure 6) we asked the
participants to draw two of their solutions, one for
each prototype, from memory and asked how confi-
dent they felt about the correctness of their drawing
on a 7-item Likert scale. A high recollection rate and
self-assessment is an important factor for visual pro-
gramming in smart spaces as it supports the coopera-
tive work with friends and families (Reisinger et al.,
2017; Davidoff et al., 2006).
2.3.2 Qualitative
The qualitative part of our data analysis adds an in-
depth analysis to the quantitative measures. Fur this
purpose, we added open questions on the positive and
negative experiences made while using the prototypes
to the questionnaires. This allowed us to gain an in-
depth understanding of the phenomenons the partic-
ipants experienced while using the prototypes (Zhao
et al., 2019). To systematically analyze these ques-
tions, we used content analysis as a common approach
for analyzing unstructured data like written text. By
repeatedly chunking different sentences into fewer re-
lated categories and sub-categories, it delivers a dense
description of the phenomenon under investigation
(Elo and Kyng
¨
as, 2008; Vaismoradi et al., 2013). Fol-
lowing (Vaismoradi et al., 2013), content analysis has
a low level of interpretation and is useful for gaining
insights in usability issues experienced by users of a
product or software.
For the content analysis two researchers indepen-
dently coded the answers for positive and negative
aspects. Afterwards, they iterative grouped related
codes that describe the same phenomenon into ab-
stract themes. Potential differences in the derived
codes and themes were clarified in subsequent discus-
sions between the two researchers.
2.4 Procedure
The participants had a one-hour time frame to com-
plete all tasks and questionnaires. They worked on
the tasks alone with one of the authors in the same
room for tracking the time needed and handing out the
tasks. Unnecessary or distracting items were removed
from the room to allow for a neutral setting (Bordens
and Abbott, 2002). We initiated the user study with a
short explanation of smart spaces and visual program-
ming to ensure a common understanding. Afterwards,
the participants started working on the three tasks in
SMARTGREENS 2022 - 11th International Conference on Smart Cities and Green ICT Systems
18
ascending difficulty. Hereby, six people started with
one prototype, while the remaining six started with
the other one.
Once they finished their tasks, the present author
noted quantitative measures, the participants rated the
perceived success and difficulty, and filled out the
UEQ. Moreover, they answered open questions on
both prototypes for qualitative analysis. After this
first iteration the participants repeated the same proce-
dure for the other prototype. Once they finished their
tasks and questionnaires, we started the measurement
of the self-assessment. At last, we requested the par-
ticipants to fill out a short demographic questionnaire
to enable the differentiation of the responses by gen-
der, age, and other factors. Overall, they worked on
scenarios a, b, and c twice, answered two question-
naires, and drew two solutions on paper.
3 RESULTS
With regard to the study’s procedure we found that,
overall, it was a good fit and helped us to be in accor-
dance with our research goal. We were able to gain
insights in the usability of the two prototypes and an
answer to our research question. However, in future
studies we would allow the users more time in using
the applications to investigate the learning effect and
select a more diverse user group. In the following
two sections we present our quantitative and qualita-
tive results in detail.
3.1 Quantitative Results
We summarized the results of measures 1-4 in Ta-
ble 3. An analysis of the Task Completion Time
shows that users needed almost a minute longer with
Blockly (7.52) as compared to Node-RED (6.67) to
realize all scenarios. The most important difference
between both prototypes is the Task Completion Rate,
which shows that users were significantly more suc-
cessful with the data-flow prototype. For Perceived
Success, Perceived Difficulty, and Self-Assessment we
did not observe significant differences between both
programming paradigms.
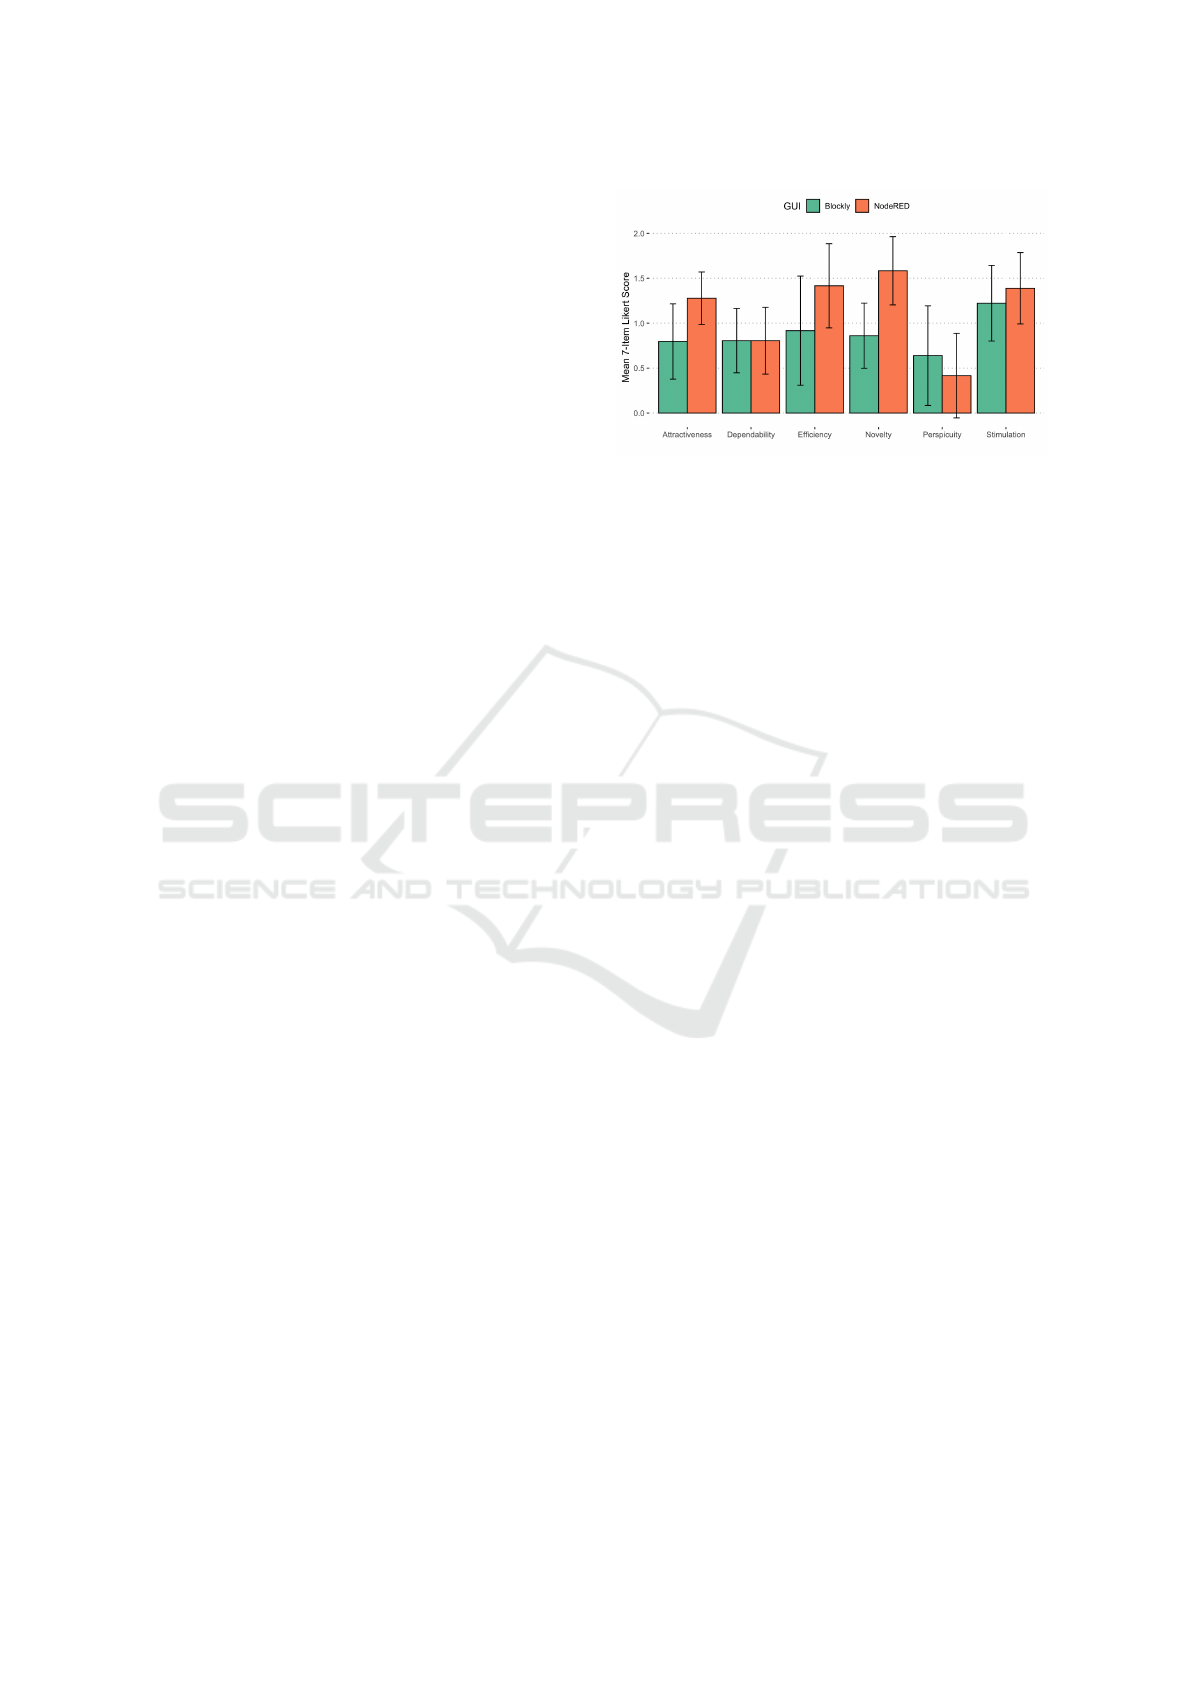
The results of measure 5 (UEQ) are shown in Fig-
ure 3. The UEQ included questions in six dimensions.
Only in the dimension Perspicuity (p = .69, |d| = .09)
the block approach (0.64) excels data-flow (0.42). In
all other dimensions, data-flow scored higher or sim-
ilar. In case of Attractiveness (p = .03, |d| = .5) and
Novelty (p = .01, |d| = .8) with a significant differ-
ence and medium effect size.
Finally, for the Self-Assessment (measure 6) we
Figure 3: Results for the UEQ (measure 5). Scores are bal-
anced (-3 to +3) and grouped by GUI with 75% confidence
interval.
observed that Node-RED scored (2.22) considerably
higher than Blockly (0.78), having a big gap between
the means (p = .09, |d| = .9). Scores were balanced
from -3 to 3. Although not statistically significant
the result shows an advantage for Node-RED over
Blockly that should be further investigated.
3.2 Qualitative Results
To visualize the results of our qualitative analysis,
we organized the themes, which we derived from the
open questions, as two word clouds. We chose to use
word clouds for visualization as they offer the reader
an easy and intuitive way for identifying the essen-
tial feedback for both programming paradigms. They,
furthermore, allow us to compare the balance between
positive and negative remarks for the data-flow and
block programming prototypes. Green themes have
a positive sentiment, while red represents a negative
theme. The size of the labels relates to the number of
occurrences of the respective theme.
The strongest positive theme for data-flow pro-
gramming (see Figure 4) was simple representation,
which was mentioned nine times (+9). People liked
the concept of the flow model (+4) in general and that
the connections were clear. It was easy to understand
that the data ”flows like a river” and is transformed
by nodes in sequence. On the contrary, people criti-
cized that the interaction with the nodes was not dy-
namic. There was no feedback (-6) if the connection
of two nodes made any sense or if they are incompat-
ible. This left error handling and debugging entirely
up to the user.
Block-programming’s (see Figure 5) strongest
positive themes included the intuitive puzzle me-
chanic (+3) together with connection feedback (+3)
as elements would ”jump away” when incompati-
ble. Additionally, people find the simple representa-
tion (+2) and the interactive limitation (+2) appealing.
End-user Development for Smart Spaces: A Comparison of Block and Data-flow Programming
19
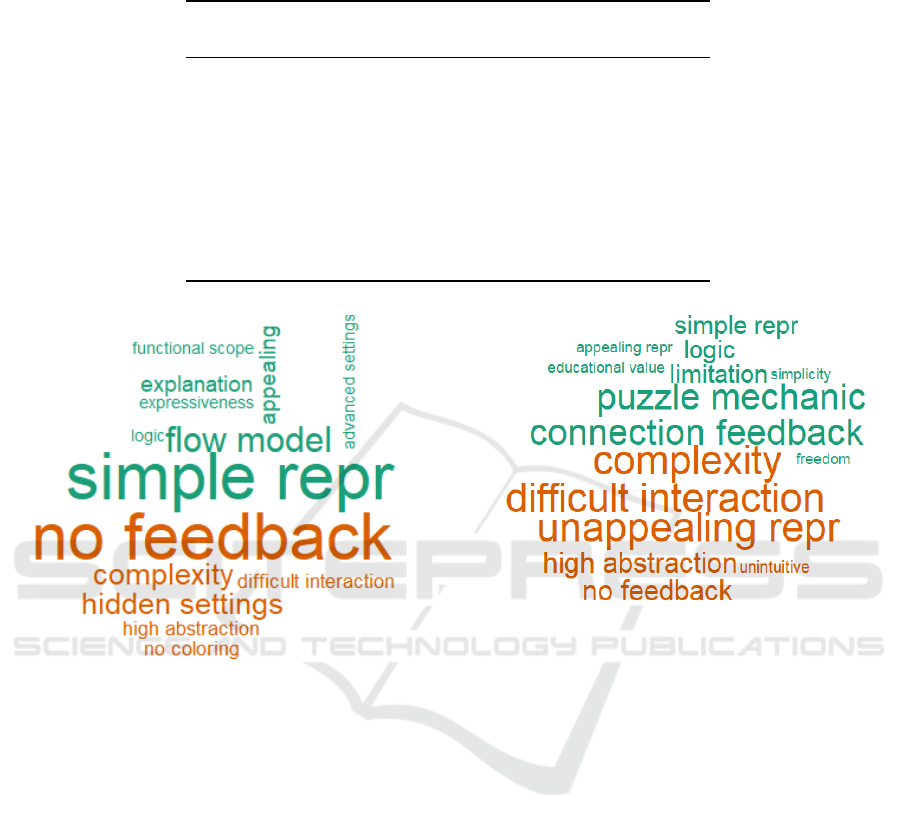
Table 3: Descriptive measures and MANOVA using task observations as dependent variables and the respective prototype as
independent variable.
Mean (± sd) MANOVA
Blockly Node-RED
Task Completion Time 7.52 6.67 F=1.65
in minutes (±3.12) (±4.40) p=.22
Task Completion Rate 83 94 F=6.72
as ratio % (±14) (±9) p=.02
Perceived Success 5.52 5.33 F=0.86
7-item Likert Scale (±1.78) (±1.90) p=.37
Perceived Difficulty 4.59 4.78 F=1.67
7-item Likert Scale (±1.65) (±1.55) p=.21
Figure 4: Data-flow: 8 positive (21 total) and 6 negative (13
total) themes.
However, the puzzle mechanic also comes with some
downsides including a high complexity, difficult inter-
action, and unappealing representation (all -3). Over-
all, data-flow has a larger share of positive themes (21
positive / 13 negative) as compared to block program-
ming (16 positive / 14 negative).
4 DISCUSSION, LIMITATIONS
AND FUTURE WORK
By comparing the two prototypes for block and
data-flow programming, we can summarize that the
data-flow (Node-RED) excels the block prototype
(Blockly) in several dimensions. Most importantly,
we observed that the users were significantly more
successful in completing the tasks with the Node-
RED prototype. They also felt more confident in us-
ing the data-flow application and preferred the user
interface. In this sense, our results are tallied with
Figure 5: Block: 9 positive (16 total) and 6 negative (14
total) themes.
previous studies (Reisinger et al., 2017; Leitner et al.,
2013; Mason and Dave, 2017) and indicate that the
data-flow visual programming paradigm might be
preferable in smart spaces. However, since most of
our measures were not statistically significant further
studies are necessary to deepen the analysis of the two
concepts.
With regard to the data-flow prototype, users
found the solution visually more appealing as com-
pared to the block prototype and considered it as be-
ing state-of-the-art. They also felt more secure in us-
ing the prototype and liked the freedom offered by
the flow-based interaction model. These results are
interesting as people also noted that they sometimes
feel overwhelmed by the possibilities and criticized
the lack of feedback. Intelligent hints or limitations
in node connections could help make the tool more
useful and improve on Hick’s law (Rosati, 2013).
Looking at the block prototype, the participants
liked the heightened perspicuity they received from
the puzzle mechanic, which offers a more playful
character. The puzzle mechanic also provides users
with immediate feedback on their programs, which
SMARTGREENS 2022 - 11th International Conference on Smart Cities and Green ICT Systems
20

was well received. On the other hand, the interac-
tion model and the visual representation were seen as
complex and unappealing. A more modern user inter-
face and full-grown IDE could help overcome these
issues and increase the usability of the prototype (In-
ayama and Hosobe, 2018).
For both tools we observed downsides in their in-
teraction model, which led participants to perceive the
tools as complex and rather difficult. Future develop-
ments should combine the strengths of both concepts,
especially a simple and modern user interface with
feedback mechanisms. Additionally, new formats of
human-computer interaction, such as conversational
AI (e.g., chatbots or voice interaction) could sup-
port inexperienced users by indicating potential pit-
falls (Jung et al., 2019; Inayama and Hosobe, 2018).
Although our study uncovered some interesting
details it is subject to several limitations. A study with
a larger and more-diverse group of participants could
shed additional light on the subject. Furthermore, our
study could be biased by the choice of the underly-
ing technology (i.e., Blockly and Node-RED) and the
interaction model of the particular tools. Other so-
lutions might offer different forms of interaction and
user feedback and achieve different results. It would,
moreover, be interesting to include the learning effect
as an additional metric in further studies and investi-
gate how well participants remember the user inter-
face after some time.
ACKNOWLEDGMENT
This research was partly supported by the German
Federal Ministry for Economic Affairs and Climate
Action (BMWK) and by the German Federal Ministry
of Education and Research (BMBF) under grant no.
16DII128 (“Deutsches Internet-Institut”).
We also thank Sakander Zirai for his support in de-
veloping the prototypes and conducting the research.
REFERENCES
Altendeitering, M. and Schimmler, S. (2020). Data-flow
programming for smart homes and other smart spaces.
In 2020 IEEE Symposium on Visual Languages and
Human-Centric Computing (VL/HCC), pages 1–4.
IEEE.
Blockly (2021). A javascript library for
building visual programming editors.
https://developers.google.com/blockly. Last ac-
cessed on 19.11.2021.
Bordens, K. S. and Abbott, B. B. (2002). Research design
and methods: A process approach. McGraw-Hill.
Cohen, J. (1992). Statistical power analysis. Current direc-
tions in psychological science, 1(3):98–101.
Coutaz, J., Fontaine, E., Mandran, N., and Demeure, A.
(2010). Disqo: A user needs analysis method for
smart home. In Proceedings of the 6th Nordic Con-
ference on Human-Computer Interaction: Extending
Boundaries, pages 615–618.
Davidoff, S., Lee, M. K., Yiu, C., Zimmerman, J., and
Dey, A. K. (2006). Principles of smart home control.
In International conference on ubiquitous computing,
pages 19–34. Springer.
Elo, S. and Kyng
¨
as, H. (2008). The qualitative content anal-
ysis process. Journal of advanced nursing, 62(1):107–
115.
Graziano, A. M. and Raulin, M. L. (1993). Research meth-
ods: A process of inquiry. HarperCollins College Pub-
lishers.
Homee (2021). node-red-contrib-homee.
https://flows.nodered.org/node/node-red-contrib-
homee. Last accessed on 19.11.2021.
IFTTT (2021). Ifttt: A world that works for you.
https://ifttt.com/. Last accessed on 28.11.2021.
Inayama, Y. and Hosobe, H. (2018). Toward an efficient
user interface for block-based visual programming.
In 2018 IEEE Symposium on Visual Languages and
Human-Centric Computing (VL/HCC), pages 293–
294. IEEE.
Jensen, R. H., Strengers, Y., Kjeldskov, J., Nicholls, L., and
Skov, M. B. (2018). Designing the desirable smart
home: A study of household experiences and energy
consumption impacts. In Proceedings of the 2018 CHI
Conference on Human Factors in Computing Systems,
pages 1–14.
Jung, H., Kim, H. J., So, S., Kim, J., and Oh, C. (2019).
Turtletalk: an educational programming game for
children with voice user interface. In Extended Ab-
stracts of the 2019 CHI Conference on Human Factors
in Computing Systems, pages 1–6.
Laugwitz, B., Held, T., and Schrepp, M. (2008). Construc-
tion and evaluation of a user experience questionnaire.
In Symposium of the Austrian HCI and usability engi-
neering group, pages 63–76. Springer.
Leitner, G., Fercher, A. J., and Lassen, C. (2013). End users
programming smart homes–a case study on scenario
programming. In International Workshop on Human-
Computer Interaction and Knowledge Discovery in
Complex, Unstructured, Big Data, pages 217–236.
Springer.
Loxone (2021). Loxone home automation.
https://www.loxone.com/dede/. Last accessed
on 19.11.2021.
Mason, D. and Dave, K. (2017). Block-based versus flow-
based programming for naive programmers. In 2017
IEEE Blocks and Beyond Workshop (B&B), pages 25–
28. IEEE.
Mennicken, S., Vermeulen, J., and Huang, E. M. (2014).
From today’s augmented houses to tomorrow’s smart
homes: New directions for home automation research.
In Proceedings of the 2014 ACM International Joint
Conference on Pervasive and Ubiquitous Computing,
End-user Development for Smart Spaces: A Comparison of Block and Data-flow Programming
21

UbiComp ’14, page 105–115, New York, NY, USA.
Association for Computing Machinery.
Nielsen, J. (1994). Usability engineering. Morgan Kauf-
mann.
Nielsen, J. and Landauer, T. K. (1993). A mathematical
model of the finding of usability problems. In Pro-
ceedings of the INTERACT’93 and CHI’93 conference
on Human factors in computing systems, pages 206–
213.
Node-RED (2021). Node-red: Low-code programming for
event-driven applications. https://nodered.org/. Last
accessed on 19.11.2021.
Reisinger, M. R., Schrammel, J., and Fr
¨
ohlich, P. (2017).
Visual languages for smart spaces: End-user program-
ming between data-flow and form-filling. In 2017
IEEE Symposium on Visual Languages and Human-
Centric Computing (VL/HCC), pages 165–169. IEEE.
Rosati, L. (2013). How to design interfaces for choice:
Hick-hyman law and classification for information ar-
chitecture. In Slavic, A.; Salah, A.; Davies, C. Clas-
sification and visualization: interfaces to knowledge:
proceedings of the International UDC Seminar. The
Hague, The Netherlands, pages 125–138.
Scratch (2021). Scratch. https://scratch.mit.edu/. Last ac-
cessed on 19.11.2021.
Stein, D. and Hanenberg, S. (2011). Comparison of a vi-
sual and a textual notation to express data constraints
in aspect-oriented join point selections: A controlled
experiment. In 2011 IEEE 19th International Con-
ference on Program Comprehension, pages 141–150.
IEEE.
Ur, B., McManus, E., Pak Yong Ho, M., and Littman, M. L.
(2014). Practical trigger-action programming in the
smart home. In Jones, M., Palanque, P., Schmidt, A.,
and Grossman, T., editors, Proceedings of the SIGCHI
Conference on Human Factors in Computing Systems,
pages 803–812, New York, NY. ACM.
Vaismoradi, M., Turunen, H., and Bondas, T. (2013). Con-
tent analysis and thematic analysis: Implications for
conducting a qualitative descriptive study. Nursing &
health sciences, 15(3):398–405.
Weintrop, D. and Wilensky, U. (2015). To block or not
to block, that is the question: students’ perceptions
of blocks-based programming. In Proceedings of the
14th international conference on interaction design
and children, pages 199–208.
Xiaomi (2021). node-red-contrib-xiaomi-smart-devices.
https://flows.nodered.org/node/node-red-contrib-
xiaomi-smart-devices. Last accessed on 19.11.2021.
Zhao, L., Loucopoulos, P., Kavakli, E., and Letsholo, K. J.
(2019). User studies on end-user service composi-
tion: a literature review and a design framework. ACM
Transactions on the Web (TWEB), 13(3):1–46.
SMARTGREENS 2022 - 11th International Conference on Smart Cities and Green ICT Systems
22
