
Multiphoton Microscopy for Bacterial Imaging: A Label-free
Solution Resting on Endogenous Two-photon Fluorescence
Cédric Delmon
1a
, Erwan Ferrandon
2
, Emilie Chouzenoux
3
, Audrey Prorot
1
, Sophie Alain
4
and Claire Lefort
2
b
1
Peirene, GRESE (EA 4330), University of Limoges, Limoges, France
2
XLIM Research Institute, UMR CNRS 7252, University of Limoges, Limoges, France
3
Center for Visual Computing, CentraleSupélec, Inria Saclay, Université Paris-Saclay, Gif-sur-Yvette, France
4
RESINFIT, UMR INSERM 1092, University of Limoges, Bacteriology-Virology-Hygiene Department,
University Hospital Center, France
Keywords: Multiphoton Microscopy, Bacterial Imaging, Spectral Characterization, Two-photon Excitation, Fluorescence
Emission, Metabolic Indicators, Point-Spread-Function, Computational Restoration, Block Distributed
Majorize-minimize Memory Gradient.
Abstract: We demonstrate the interest of multiphoton microscopy (MPM) for imaging bacteria without any labelling
process. Six families of bacteria are tested: Escherichia coli, Staphylococcus epidermidis, Proteus vulgaris,
Pseudomonas fluorescens, Bacillus subtilis and Clostridium perfringens. For each of these bacteria, the image
of a cell is recorded through a multiphoton microscope thus revealing the 3D shape of these bacteria. For the
first time, the images of such bacteria are recorded without any labelling solution. A protocol of controlling
the image produced is led thanks to a standard staining protocol with carboxy fluorescein diacetate (CFDA)
for E. Coli and Staphylococcus epidermidis. Similar object shapes with or without labelling are produced,
thus validating the label-free images generated by MPM. Then, the two-photon excitation spectra are
measured for each of these bacteriaand the emission spectra delivered by E. Coli and Bacillus subtilis are
shown. The origin of the two-photon fluorescence (TPF) emission of the bacteria thanks to the nonlinear
imaging solution is discussed regarding to the TPF excitation and emission spectra of metabolic indicators.
1 INTRODUCTION
Currently, no label free solution devoted to bacterial
imaging exists and labelling bacteria remains a
technical challenge. Several techniques have been
used for bacterial detection and identification, such as
conventional laboratory-based culture media,
polymerase chain reaction (PCR), immunological
techniques, and Raman spectroscopy (Yoon 2021).
However, these methods are often expensive, time-
consuming, they need complex procedures, or can
lead to false positive/ negative results. With the recent
technical advances of bacteria detection using
fluorescence-based dyes, it is now possible to assess
simultaneously the physiological states of cells with
two or three different fluorescent dyes that target
specific biomolecules and physiological processes
a
https://orcid.org/0000-0002-5421-2477
b
https://orcid.org/0000-0002-7685-2061
(Yoon, 2021, Wilkinson 2018). The use of flow
cytometry multiparameter analysis in conjunction
with fluorescent dyes provides consistent information
about physiological state of cells at a single level.
However, these methods need complex protocol
adaptation and complementary investigative
techniques. Above all, further advances are required
for “in situ” methods improvement in order to assess
microbial viability without coloration steps. To this
purpose, other more direct technical solutions still
have to be developed. Therefore, the need in new
solutions resting on microscopic tools for the optical
characterization of bacteria is high.
In this publication, for the first time in the field of
biomedical microscopy and in the field of
microbiology bacteria, we propose to merge
multiphoton microscopy (MPM) (Larson, 2011) and
76
Delmon, C., Ferrandon, E., Chouzenoux, E., Prorot, A., Alain, S. and Lefort, C.
Multiphoton Microscopy for Bacterial Imaging: A Label-free Solution Resting on Endogenous Two-photon Fluorescence.
DOI: 10.5220/0010979600003121
In Proceedings of the 10th International Conference on Photonics, Optics and Laser Technology (PHOTOPTICS 2022), pages 76-83
ISBN: 978-989-758-554-8; ISSN: 2184-4364
Copyright
c
2022 by SCITEPRESS – Science and Technology Publications, Lda. All rights reserved

bacterial imaging, in order to reveal the image of such
a biological object through a nonlinear optical
process. Several set of experiments usually involved
for biological, medical or vegetal samples such as
cells, tissues, of whole organs (Gobel 2007, Plotnikov
2006, Hortholary 2021) are now newly presented for
nonlinear characterisation of bacetria. We are testing
six families of bacteria: Escherichia coli (E. Coli),
Staphylococcus epidermidis, Proteus vulgaris,
Pseudomonas fluorescens, Bacillus subtilis and
Clostridium perfringens. For each of these bacteria,
morphologic characteristics are gathered into Table 1,
showing the diversity of the sample chosen: each
GRAM is represented (GRAM + and GRAM –),
bacilus and coccus shapes, sporulant or not and
aeroby or anaeroby. For such large diversity of
bacteria, a preliminary test is led: a standard protocol
of fluorescence imaging through a nonlinear process
of two-photon fluorescence is involved. Thus, two-
photon fluorescence images of these bacteria are
produced. The first interesting result obtained
concerned the ability of this strategy to deliver an
image for each of the 6 bacteria selected. By
consequence, a second set of experiment was led. For
each bacetria, a recording of the two-photon
excitation spectra highlights large regions of
absorptions, and similar spectral shapes and regions
of emission are recorded, as illustrated by the
emission spectra of E. Coli and Bacillus subtilis. A
3D image of Clostridium Perfringens is proposed
thanks to the application of our instrumental and
computational pipeline FAMOUS resting on the
estimation of the point-spread-function (PSF) of the
system and the deblurring/denoising of the image
(Lefort 2021). Finally, we raise a discussion about the
origin of the endogenous fluorescence observed and
about the interest of MPM devoted to the optical
characterization of bacteria. More precisely, the
question raised by the presence of fluorescence
emission in the same emission range and biphotonic
excitation range for all of the bacteria presenting such
different characteristics led to the investigation about
the presence of similar substances for all these
biological objects. Our conclusions are therefore
oriented towards metabolic indicators, substances
existing for all of the living bacteria.
2 EXPERIMENTAL SETUP
The experimental setup involved in this study rests on
a two-side contribution including optical &
computational engineering on the one hand and
bacterial process engineering on the other hand. First
the bacteria are chosen thanks to their specificities for
a complete representation of the different kinds of
bacteria existing. Then, the instrumental and
computational solution resting on MPM is presented
and our original solution FAMOUS devoted to the
image restoration is presented. We note here that for
all the images presented in this publication, false
colours have been used. Indeed, the recording of the
fluorescence signal emitted by the bacteria
endogenously or after a fluorescence labelling
process is led by a PMT which detects a signal
intensity level, discretely coded.
2.1 Bacteria
2.1.1 Six Bacteria Chosen
The experimental characterization protocol for
imaging bacteria is tested with six bacteria from
different families. Table 1 gathers the properties of
the related bacteria (Prescott 2018).
Table 1: Characteristics of the bacteria used.
E. coli Staphylococcus
epidermidis
Proteus
vulgaris
Pseudomonas
fluorescens
Bacillus
subtilis
Clostridium
perfringens
GRAM - + - - + +
Shape Bacillus Coccus Bacillus Bacillus Bacillus Bacillus
Sporulation No No No No Yes Yes
Aerobic Yes Yes Strict
Anaerobic Facultative Facultative
In order to cover the great complexity of bacterial
structure and physiological features, a large variety of
biological models such as gram-negative, gram-
positive and spore forming bacteria were used in this
study.
2.1.2 Protocol of Preparation
The six bacteria studied (E. coli, Staphylococcus
epidermidis, Pseudomonas fluorescens, Proteus
vulgaris, Bacillus subtilis, Clostridium perfringens)
were cultured in a TSB liquid culture medium
(Trypto-Casein-Soy BK046HA, Biokar). 1.2mL of
bacteria culture in TSB liquid culture medium was
removed and centrifuged at 5400rpm for 15 minutes
at room temperature. The pellets were taken up in a
volume of 4 mL of PBS and their optical density was
measured for λ = 600 nm. Observations were made at
optical densities ranging from 0.1 to 1.6. The bacteria
were cultured for 2 to 3 days in an oven at 37°C and
stored at 4 ° C after resuspension in PBS.
Multiphoton Microscopy for Bacterial Imaging: A Label-free Solution Resting on Endogenous Two-photon Fluorescence
77
2.2 The Instrumental and
Computational Pipeline FAMOUS
The raw images of bacteria are recorded thanks to a
multiphoton microscope. The endogenous
fluorescence recorded in this situation exposes MPM
to nonnegligible levels of blur and noise especially in
the case of endogenous fluorescence recordings, this
method requires ad hoc computational processing
strategy to produce 3D images with an adapted visual
quality. In this part, we present the specificities of the
pipeline FAMOUS, combining MPM and our
computational strategy.
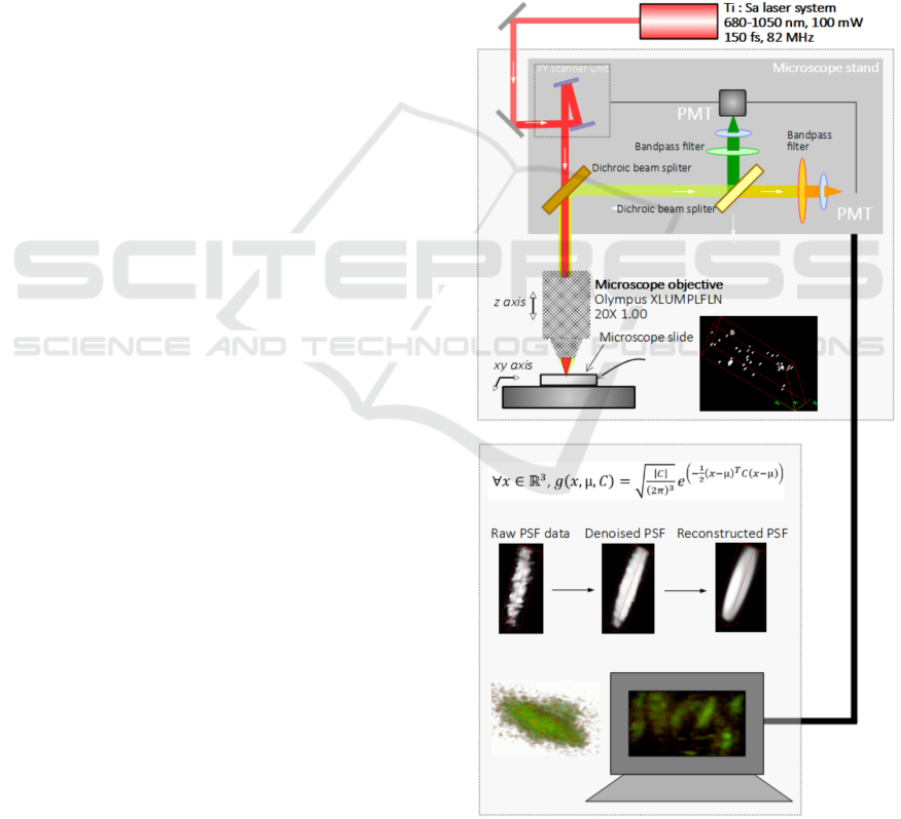
2.2.1 Experimental Setup
Multiphoton Microscope. The experimental setup
involved in this set of experiments rests on a standard
multiphoton microscope, associated with an original
computational strategy of image recovery. Figure 1.
presents the resulting experimental setup. The whole
instrumental and computational chain has been
presented in details in (Lefort 2021). A commercial
multiphoton microscope from Olympus (reference
BX61WI) was involved for the whole setup. The laser
excitation had a tunable central wavelength between
650 and 1080 nm. For the imaging experiments, the
central wavelength of the laser excitation, a mode-
locked titanium-doped sapphire laser (Ti: Sa) was
fixed at 740 and 840 nm. When the evaluation of the
two-photon excitation spectra was led, the central
wavelength of excitation was tuned between 680 and
1040 nm with scanning steps of 20 nm. During this
specific procedure, the laser average power was
followed and kept constant thanks to optical densities
all along the recordings. The microscope stand was
composed with a scanning device with two
galvanometric mirrors. The detection system is
composed by a set of two dichroic mirrors and two
photomultipliers tubes (PMTs), each of them being
coupled with a bandpass filter.
Recording of the Instrumental Response Function.
The main experiments of bacterial imaging involved
a single PMT, excepted when the instrumental
contribution to the image has to be characterized (see
below section 2.2.3 Computational solution). In that
case, the second PMT is requisitioned. For this
specific part of the experiment, the biological sample
is mixed with standardized object, composed by
fluorescent microsphere having a diameter of 200 nm.
The fluorescence emission is detected between 575
and 630 nm by the second PMT. The emission
efficiency of these objects is significantly higher than
the endogenous fluorescence emitted by the bacteria.
The sensitivity PMT is consequently adjusted.
Starting from the recordings of the fluorescence
emission of the microspheres, the estimation of the
instrumental response function, also named the 3D
Point-Spread-Function (PSF) is recorded. Two
detection spectral ranges are specifically recorded:
between 420 nm and 500 nm on the one hand, and
between 575 nm and 630 nm on the other hand. The
emission of fluorescence is characterized thanks to a
punctual adaptation of the detection channel. Indeed,
a homemade system of emission detection is
positioned thanks to a fibered spectrometer. Thus, the
emission spectra have been delivered for few
bacteria.
Figure 1: Experimental setup for recording the multiphoton
images of bacteria, associated with a computational strategy
for 3D image recovery.
PHOTOPTICS 2022 - 10th International Conference on Photonics, Optics and Laser Technology
78
2.2.2 Principle of MPM
MPM is an optical solution devoted to the production
of images which rests on a principle of nonlinear
optics. TPF, a nonlinear process which results from
the third-order of susceptibility of the fluorophore
χ
(3)
, is the main process involved in MPM for
generating the detectable optical signal. Alternative
sources of contrast exists, such as second harmonic
generation (SHG) and three-photon fluorescence
(ThPF) for example. SHG is an instantaneous
phenomenon of nonlinear coherent light scattering
which requires drastic conditions of phase-matching
while combining the simultaneous interaction of two
photons with the structure probed. In our case, the six
bacteria tested are good candidates for two-photon
excitation and do not seem to be at the origin of the
generation of a second harmonic signal. The interest
of MPM for bacteria rests on two facts. First, the
multiphoton process is involved for wavelengths in
the near-infrared range, a spectral range far from the
one-photon absorption and emission ranges and lowly
energetic compared to linear fluorescence processes.
Thus, the bacterial integrity is preserved during the
image recording and the spectral absorption ranges
can be scanned without any risk of spectral
superposition between the excitation and the emission
windows. Thus, the endogenous fluorescence emitted
from bacteria can be recorded. Then, the TPF solution
offers an optical sectioning inherent to its principle
resting on a mechanism weakly likely consequently
occurring exclusively at the focal point of the system
where the photon density is enough for producing a
two-photon absorption process. Parasite light, usually
emitted from the upper and lower optical plans are de
facto highly reduced, contrary to one-photon
processes producing photon in these plans sometime
mechanically removed thanks to a more or less
opened pinhole (confocal microscopy).
2.2.3 Computational Solution
3D image recovery rests on the estimation of the PSF
model thanks to the algorithm FIGARO (Chouzenoux
2019). A multivariable Gaussian fitting process
delivers a mathematical model of the transfer function
of the instrument thanks to the recording of the signal
coming from the fluorescent microspheres. The
instrumental contribution at the image is thus
characterized. Then, the 3D image recovery can take
the contribution of the instrument to the image in
consideration and specifically remove its role. In our
case, for the 3D image recovery, the algorithm from
(Chouzenoux 2013) in its accelerated version, is
involved. The block distributed majorize-minimize
memory gradient (BD3MG) minimizes a least-
squares criterion, regularized with a smoothed total-
variation term reducing noisy artefacts and a
quadratic penalty to constrain the range of the pixel
intensities.
3 LABEL-FREE IMAGES OF
BACTERIA
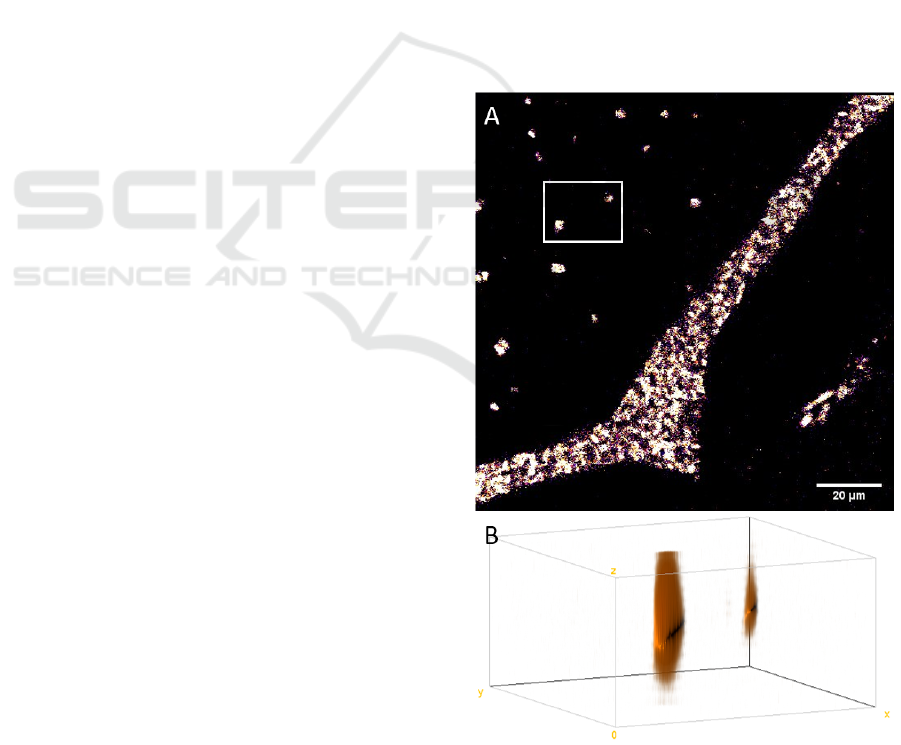
3.1 3D Endogenous Images of Bacteria
The illustration of bacterial imaging is led with E.
Coli. No labelling process is involved in this part.
Figure 2 illustrates the image recording of E. Coli.
Figure 2A presents the large field of view including
regions of interest where bacteria look isolated; in the
white square, at least two bacteria are identified.
Figure 2B shows the 3D point of view of the bacteria
present into the white square, revealing a potential
Figure 2: Endogenous fluorescence of E. Coli. A. A 2D
record of multiphoton images of E. Coli label free. B. A 3D
reconstruction of the image of E. Coli.
Multiphoton Microscopy for Bacterial Imaging: A Label-free Solution Resting on Endogenous Two-photon Fluorescence
79
superimposition of two bacteria on each other. The
Bacillus shape expected for E. Coli is observed.
3.2 Control Process of the Object
Shape Detected at the Image
A control set of experiment were led thanks to the
observations resting on labeled bacteria. The
objective was to confirm that the endogenous
fluorescence and the resulting image shape of objects
were emitted from bacteria. Two bacteria were tested
with this protocol. We labeled the bacteria E. coli and
Staphylococcus epidermidis with CFDA (carboxy
fluorescein diacetate), an enzymatic activity indicator
most often used in flow cytometry
7
. CFDA, a non-
fluorescent molecule, is lysed by the esterase of
bacteria and converted to CF (a fluorescent form)
once in the cytoplasm of the cell, allowing living cells
to fluoresce with enzymatic activity. 10 μL of CFDA
were added to 1 ml of bacterial solutions in PBS. The
solution was placed in an oven at 37°C for 30 minutes
and then rinsed with PBS. The purpose of these
markings is to find bacteria more easily under the
microscope and thus confirm their shape and
distribution on the slide in order to then compare the
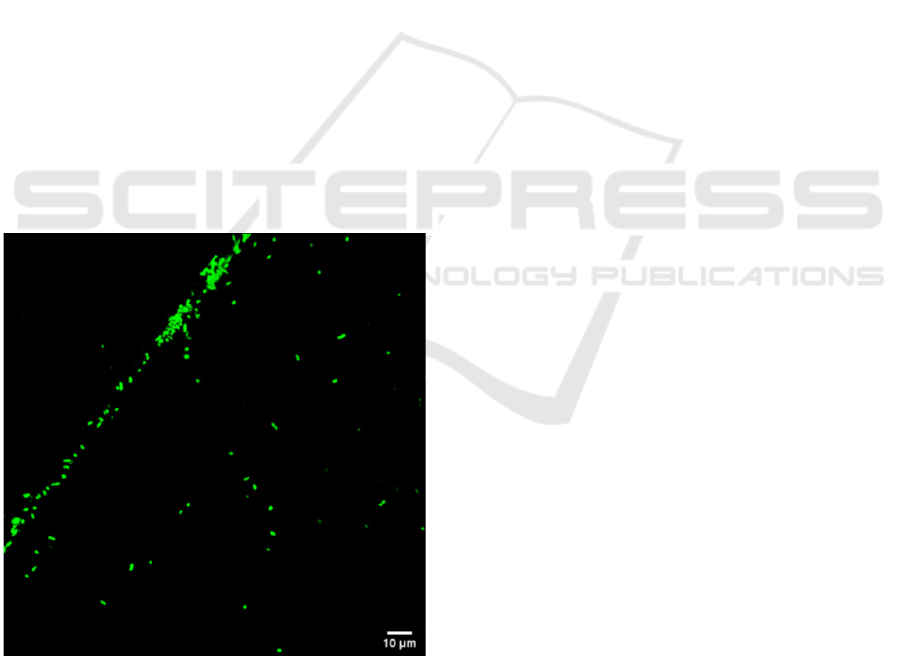
results with the absence of marking. Figure 3.
illustrates the images of E. coli recorded with the
labelling with CFDA.
Figure 3: Image of a E. coli cells recorded with the labelling
with CFDA. Excitation wavelength: 740 nm and detection
wavelength fixed between 420 and 500 nm.
Similar information at the image are resulting from
this set of experiment, thus validating the endogenous
images of bacteria presented from the endogenous
fluorescence (Figure 2A). As expected, the level of
contrast is greater with the labelling process involving
a substance efficiently fluorescent. Moreover, the
protocol of labelling bacteria does not produce a
labelling of all cells, since CFDA only stain
enzymatically active bacteria. The quantity of
bacteria revealed at the image looks thus smaller than
without labelling (Figure 2A).
3.3 3D Representation of Bacteria
through the Pipeline FAMOUS
The Clostridium perfringens where imaged in
experimental conditions, fitting with the technical
recommendation required for the correct application
of the instrumental and computational pipeline
FAMOUS: fluorescent microspheres with a fixed
diameter of 200 nm were mixed with the culture of
Clostridium perfringens.
Stacks of images were recorded with an imaging
step of 0.1 µm all along the imaging depth of 8 µm.
Figure 4 shows the superposition of two images: the
raw acquisition recorded in red resulting in more or
less condensed dots and the restored image revealed
in green at the image. Figure 4A represents an
extraction from the 80 2D stacks of the recorded
image of Clostridium Perfringens. Figure 4B
illustrates a 3D reconstruction of the Clostridium
perfringens gathering raw and reconstructed signals.
In the present situation, the stack of the raw images
was recorded with a reduced average power
compared to standard 2D recordings. Indeed, the
duration of a 3D image recording is 80 times longer.
Thus, for a too high average power level deposited on
bacteria, the resulting energy on the sample produces
a movement of the bacteria at the image under the
local temperature increase (Lefort 2015).
4 SPECTRAL ANALYSIS OF
BACTERIA
The origin of two-photon emission fluorescence from
bacteria is investigated through the study of the two-
photon excitation spectra and the spectral range of
emission.
4.1 Two-Photon Excitation Spectra
We characterized the two-photon excitation spectra
of each strain of bacteria. In that aim, the central
wavelength of the laser excitation is tuned each 20
nm, between 680 and 1080 nm and the laser average
PHOTOPTICS 2022 - 10th International Conference on Photonics, Optics and Laser Technology
80
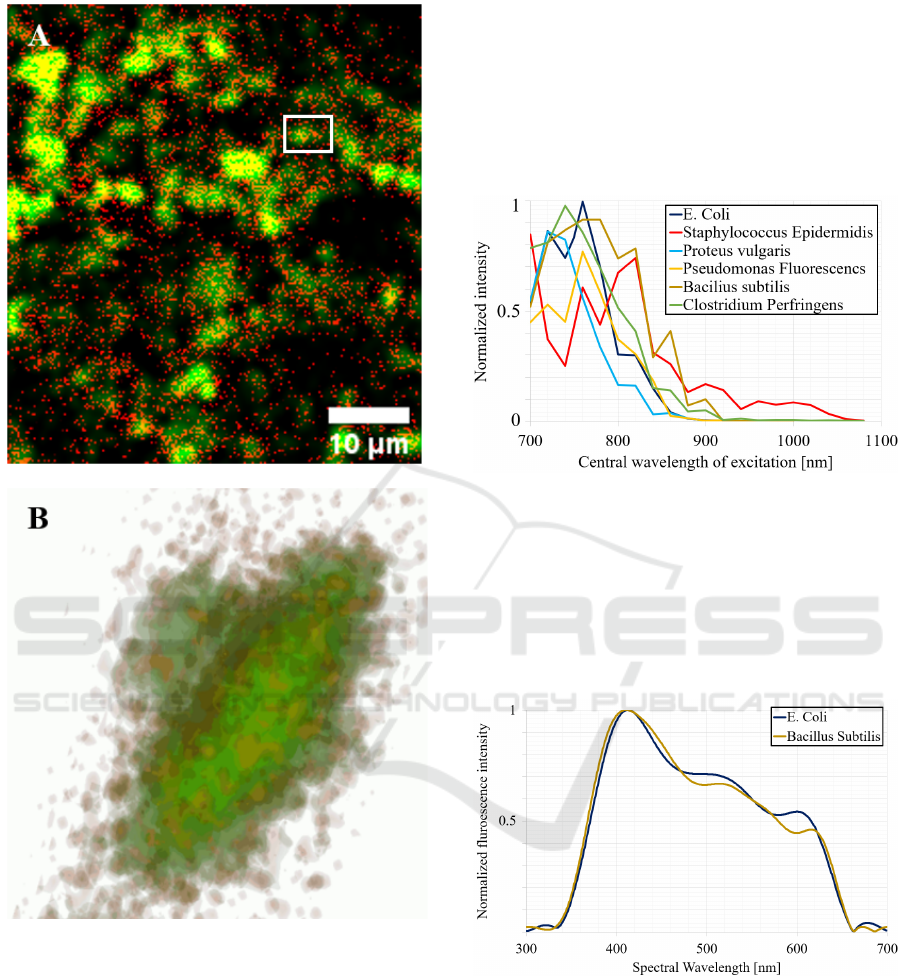
Figure 4: Image of Clostridium perfringens label free cells.
Red dots: the endogenous emission of fluorescence from
the bacteria. In yellow appears the superimposition of raw
and reconstructed signals. Green: reconstructed signal of
image through the pipeline FAMOUS with a contribution
of red decreased compared to green.
power is kept constant all along the recordings. A ten
of images were recorded for each of the central
wavelengths, each of them containing many
individual bacteria. A ten of bacteria were selected for
each image and their fluorescence intensity were then
recorded in function with the central wavelength of
excitation. Figure 5 gathers the normalized intensity
of the two-photon excitation spectra of each of the six
bacteria.
The emission range of detection is between 420
and 500 nm. The protocol presented at the previous
part is involved. The observation of the fluorescence
excitation ranges of each of the six strain tested
highlights a similar shape, all of them being contained
between 700 and 800 nm.
Figure 5: Two-photon excitation spectra of each of the six
bacteria recorded between 680 and 1080 nm each 20 nm for
a constant average power of 20 mW upon the bacteria.
4.2 Emission Spectra
For two bacteria, we had recorded the two-photon
emission spectra. Figure 6 highlights the emission
spectra for E. Coli and Bacillus Subtilis.
Figure 6: Fluorescence emission spectra for E. Coli and
Bacillus Subtilis.
The emission range of these two bacteria covers the
visible range with a maximum value at 400 nm and
with a full width at the half maximum of 120 nm. We
suspect the fluorescence spectra to be larger in the red
range. But our system, resting on a multiphoton
system, has a dichroic mirror involved for the
separation of the beam between excitation starting at
680 nm and emission fixed with a central wavelength
Multiphoton Microscopy for Bacterial Imaging: A Label-free Solution Resting on Endogenous Two-photon Fluorescence
81

of 650 nm. The decreasing slope of the fluorescence
emission spectra around 650 nm is due to the dichroic
mirror.
5 HYPOTHESIS ABOUT THE
ORIGIN OF THE
ENDOGENOUS EMISSION OF
FLUORESCENCE
The main question raised by this work concerns the
question of optical characterization of bacteria.
Bacteria contain many fluorescent cellular
components as protein tryptophan, a few other
aromatic amino acids, nucleic acids, and some
coenzymes (Surre 2018, Torno 2013). The spectra of
these autofluorescence cover most of the spectral
range because different endogenous fluorophores
emit at different wavelengths of the electromagnetic
spectrum (Surre 2018). Among the various
endogenous fluorescent molecules, the influence of
flavin adenine dinucleotide (FAD) and nicotinamide-
adenine dinucleotide (NAD) are considered to be
major. Indeed, the fluorescence of reduced
nicotinamide-adenine dinucleotide (NADH) is
commonly used as metabolic biomarker of cell due to
its key role in the conversion of energy. Moreover,
numerous optical studies that exist in literature
present the two-photon excitation and emission
spectra of fluorescence of NADH (Qin 2021,
Hortholary 2021, Georgakoudi 2012, Lakowicz
2006). All of these works highlight a two-photon
excitation range for NADH located between 700 and
800 nm and an emission range, cantered at 450 nm
covers the range between 400 and 600 nm. Moreover,
no distinct shape of bacteria can be visually identified
at the image. Knowing that all of the bacteria contain
metabolic indicators, this cluster of clues leads us to
reasonably think that the fluorescence emission we
have detected is originated from these chemical
substances instead of membrane proteins. Therefore,
for living bacteria the presence of fluorescence must
be produced for all the bacteria presenting a
metabolic activity.
6 CONCLUSIONS
These series of experiments bring new elements of
answer to the question raised in introduction
concerning the difficulties to visualize the bacteria,
their presence, to see their shape, their composition.
resting on two scientific facts, initially known but
usually treated independently until the present works.
Indeed, the endogenous fluorescence of metabolic
indicators is not a new scientific result, whether it be
by a one-photon or a two-photon fluorescence
process. The presence of metabolic indicators in
bacteria is also known. In the present set of
experiments, the interest of a two-photon excitation
strategy lies in the separation of excitation and
emission ranges, with several hundreds of nanometers
(450 nm for emission and 750 nm for the maximum
of excitation). Thus, the endogenous fluorescence
initially known as “optical noise” at the image for a
one-photon fluorescence process is now easily
separable from the excitation beam. Furthermore, our
computational solution, adapted for the low intensity
levels of detected signal resulting in a highly
corrupted image allows to reveal for the first time the
3D optical image of a bacteria in its current
environment without any labelling process. The
construction of the image of the bacteria label free is
thus accessible and gives a visual representation of
the target.
For future works, one question emerges from all
these experiments. The image of bacteria can be
produced through endogenous fluorescence, which is
an important information, especially when
considering the characterization of bacteria density
often led with flow-cytometry through a one-photon
process involving labelling procedure. But by
evidence, the human eye cannot recognize or
differentiate two bacteria from one another when they
originate from two different strains. In the case of a
need concerning the identification of the bacteria, an
assistance of the most recent computational strategies
resting on artificial intelligence has to be deployed.
ACKNOWLEDGEMENTS
We especially thanks Pr Jean-Christophe Pesquet for
his enlightened opinion about this work and the GDR
Imabio from CNRS for his financial support for
Erwan Ferrandon.
REFERENCES
Chalvidal, M., and Chouzenoux, E., (2020) Block
distributed 3MG algorithm and its application to 3D
image restoration IEEE Int. Conf. on Image Processing
(ICIP 2020), Virtual Conf., 20259472
Chouzenoux E., Lau T. T. K., Lefort C. Pesquet J.-C. (2019)
Optimal multivariate Gaussian fitting with applications
PHOTOPTICS 2022 - 10th International Conference on Photonics, Optics and Laser Technology
82

to PSF modeling in two-photon microscopy imaging. J.
Math. Imaging Vis. 61 1037–50
Chouzenoux, E., Jezierska, A, Pesquet, J.-C. and Talbot, H.
(2013) A majorize-minimize subspace approach for l2-
l0 image regularization. SIAM J. Imaging Sci. 6 563–
91.
Georgakoudi, I., Quinn, K.P. (2012). Optical imaging using
endogenous contrast to assess metabolic state, Annual
Review of Biomedical Engineering ,14, 351-367
Gobel, W., Kampa, B. M. and Helmchen, F. (2007)
Imaging cellular network dynamics in three dimensions
using fast 3D laser scanning. Nat. Methods 4 73–79
Hortholary, T., Carrion, C., Chouzenoux, E., Pesquet, J.-C.
and Lefort, C. (2021) Multiplex-multiphoton
microscopy and computational strategy for biomedical
imaging. Microscopy Research and Technics 84 (7),
1553-1562.
Jin C., Kong L., Dana H., Xie H., Cao L., Jin G., Dai Q.
(2020) Advances in point spread function engineering
for functional imaging of neural circuits in vivo. J.
Phys. D: Appl. Phys. 53 383001
Lakowicz, J. R., (2006). Principles of Fluorescence
Spectroscopy, Springer, Third Edition
Larson, A. M. (2011). Multiphoton microscopy Nat.
Photonics 5 1
Lefort, C. Moreau, D., Lévêque, P., O’Connor, R. (2015)
Optical measurement of temperature in tissue culture
surfaces under infrared laser light excitation at 800 nm
using a fluorescent dye. 2015 International Conference
on Photonics, Optics and Laser Technology
(PHOTOPTICS), IEEE, 41-46
Lefort, C., Chalvidal, M., Paretné A., Blanquet, V.,
Massias, H., Magnol, L., Chouzenoux, E. (2021)
FAMOUS: a fast instrumental and computational
pipeline for multiphoton microscopy applied to 3D
imaging of muscle ultrastructure. J. Phys. D: Appl.
Phys. 54, 274005.
Plotnikov, S. V., Millard, A. C., Campagnola, P. J. and
Mohler, W. A. (2006). Characterization of the myosin-
based source for second-harmonic generation from
muscle sarcomeres. Biophys. J. 90 693–703
Prescott, L. M., Willey, J. M., Sherwood, L. M.,
Woolverton, C. J., Coyette, J., Joseleau, J.-P., Perraud,
R. “Prescott's Microbiology”, 5
th
edition, De Boeck
supérieur (2018)
Qin, Y., Xia, Y. (2021). Simultaneous Two-Photon
Fluorescence Microscopy of NADH and FAD Using
Pixel-to-Pixel Wavelength-Switching. Frontiers in
Physics, 9, 642302
Surre, J. Saint-Ruf, C., Collin, V., Orenga, S. (2018) Strong
increase in the autofluorescence of cells signals
struggle for survival. Scientific reports (8) 12088
Torno K., Wright, B. K., Jones, M. J., Digman, M. A.,
Gratton, E., Phillips, M. (2013) Real-time analysis of
metabolic activity within Lactobacillus acidophilus by
phasor Fluorescence Lifetime Imaging Microscopy of
NADH. Curr Microbiol (2013) 66:365–367
Wilkinson, M. G., (2018) Flow cytometry as a potential
method of measuring bacterial viability in probiotic
products. Trends in Food Science and Technology (78)
1-10
Yoon, S. A., Park, S. Y., Cha, Y., Gopala, L., Lee, M. H.
(2021) Strategies of Detecting Bacteria Using
Fluorescence-Based Dyes Frontiers in chemistry (9)
7443923
Multiphoton Microscopy for Bacterial Imaging: A Label-free Solution Resting on Endogenous Two-photon Fluorescence
83
