
Malware in Motion
Robert Choudhury
1 a
, Zhiyuan Luo
1 b
and Khuong An Nguyen
2 c
1
Royal Holloway University of London, Surrey, TW20 0EX, U.K.
2
University of Brighton, East Sussex BN2 4GJ, U.K.
Keywords:
Dynamic Analysis, Mobile Security, Reverse Turing Test.
Abstract:
Malicious software (malware) is designed to circumvent the security policy of the host device. Smartphones
represent an attractive target to malware authors as they are often a rich source of sensitive information.
Attractive targets for attackers are sensors (such as cameras or microphones) which allow observation of the
victims in real time. To counteract this threat, there has been a tightening of privileges on mobile devices with
respect to sensors, with app developers being required to declare which sensors they need access to, as well
as the users needing to give consent. We demonstrate by conducting a survey of publicly accessible malware
analysis platforms that there are still implementations of sensors which are trivial to detect without exposing
the malicious intent of a program. We also show how that, despite changes to the permission model, it is still
possible to fingerprint an analysis environment even when the analysis is carried out using a physical device
with the novel use of Android’s Activity Recognition API.
1 INTRODUCTION
Within security the practice of misinformation is
utilised by both malware authors (who try to make
their creations’ purpose appear benign) and by secu-
rity analysts who wish to observe the behaviour of the
malware and make their analysis environment trans-
parent to it. The technique of hiding the intention
of malware is known as evasion and the technique of
making an analysis environment such as a sandbox
appear to be a legitimate target is known as hardening
(Ferrand, 2015).
Motivations for malware evasion are that the pro-
cess of finding a means to elevate privilege by finding
a suitable vulnerability to exploit on the desired target
requires development time, expertise and sometimes
money to purchase information about the vulnerabil-
ity. Malware authors will therefore seek to protect
their investment by evading analysis which delays an
appropriate response.
The desire to evade detection increases with the
sophistication of the malware and the importance of
the target. Evasion in malware can be achieved by us-
ing methods such as detecting the presence of analysis
and then changing behaviour to benign or by stalling
a
https://orcid.org/0000-0003-0974-7920
b
https://orcid.org/0000-0002-3336-3751
c
https://orcid.org/0000-0001-6198-9295
malicious execution until it is no longer under analy-
sis.
Information Leaks using Low Powered Sensors.
It is possible for a malicious actor to circumvent the
security policy of a smartphone by inferring sensitive
information using low powered sensors such as ac-
celerometers. Nguyen et al. demonstrated this by us-
ing magnetometer and accelerometer traces to track
the movement of a target’s smartphone (Nguyen et al.,
2019). It was also demonstrated that JavaScript and
a locally installed app could, with only 100 sensor
samples, infer the device factory calibration and al-
low fingerprinting of a specific device across multiple
platforms (Zhang et al., 2019).
Paper’s Contributions. This work makes the fol-
lowing contributions:
• A survey of malware analysis platforms was car-
ried out using a customised app to ascertain the
state of low power sensor implementations.
• Responses from the survey app were analysed
showing that sensor readings can be used to time
the execution of the app.
• Sensor readings were reviewed and rated from the
perspective of an attacker looking to evade analy-
sis.
Choudhury, R., Luo, Z. and Nguyen, K.
Malware in Motion.
DOI: 10.5220/0010976200003120
In Proceedings of the 8th International Conference on Information Systems Security and Privacy (ICISSP 2022), pages 595-602
ISBN: 978-989-758-553-1; ISSN: 2184-4356
Copyright
c
2022 by SCITEPRESS – Science and Technology Publications, Lda. All rights reserved
595

• A novel use of activity recognition is proposed to
produce a Reverse Turing test that can identify
a lack of human-generated motion on a physical
phone which can then be used to fingerprint anal-
ysis.
Structure of the Paper. The rest of this paper is
structured as follows. Section 2 provides the moti-
vation for this work. Section 3 describes the method-
ology for obtaining the data from our apps. Section
4 describes the analysis of the obtained sensor values.
Section 5 discusses the values returned by the app and
demonstrates how a Reverse Turing Test could be im-
plemented. Section 6 concludes our work and dis-
cusses future work.
2 BACKGROUND AND RELATED
WORK
2.1 What Is a Sandbox?
With large amounts of malware generated every day,
efficient ways to identify and classify it correctly are
required. The problem is that with limited resources,
security analysts must prioritise how best to minimise
the risk to the systems they defend whilst maximising
the analysis of potential malware. This is typically
achieved through automation using an analysis tool
known as a sandbox. Sandboxes are isolated environ-
ments where an unclassified sample program can be
executed and its behaviour observed and then identi-
fied as either malicious or non-malicious. By execut-
ing the malware, analysts can observe the interactions
between the malware and the local system as well
as external resources. This allows behavioural based
monitoring of incoming files to a protected network
which allows the detection previously unseen attacks
(Zero-Day). The execution of malware to observe its
behaviour is referred to as dynamic analysis.
Static analysis is the examination of files for pat-
terns and strings that are commonly used by malware.
Static analysis is sometimes circumvented by obfus-
cation of the code or encryption (Bashari Rad et al.,
2012; Moser et al., 2007). For example encryption
can be used to disguise internal strings such as mali-
cious IP addresses / URLs that would otherwise give
analysts an indication of malicious intent.
As our research is focused on the modelling of real
time low power sensor values we excluded analysis
platforms that only offer static analysis from our sur-
vey.
2.2 The Reverse Turing Test
The Turing Test was named after Alan Turing and in-
volves an interrogator querying a subject to determine
if it is a computer or a human. In the case of evasive
malware, the malware is trying to determine if inputs
provided by a device are from a human operator or
are falsified inputs provided by a sandbox. This is
known a Reverse Turing Test and malware can per-
form it by observing real-time interactions between a
human user and a device, prompting the user to per-
form a task such as clicking a button and looking at
accumulated wear and tear that occurs through usage
of a live system.
2.3 Related Works
An empirical study to fingerprint publicly available
malware analysis services was conducted in (Botas
et al., 2018). Samples were sent to each platform and
artefacts such as the version of the operating system
and the MAC address were retrieved.
As many of these values were shown to be com-
mon or the same on various analysis platforms, the
authors showed it is possible to fingerprint analysis
environments using these values. A method was pro-
posed to prevent fingerprinting by generating a ran-
dom value for each of the artefacts which was then
fixed and returned to the querying sample. This dif-
fers from our work which is focused on the mobile
operating system Android and more specifically the
returned values from sensors. We extend their work
by proposing an attack that would defeat the random
artefacts framework if applied to sensor readings pro-
duced by mobile devices.
In the paper “Tap Wave Rub” (Shrestha et al.,
2015) the authors produced a Reverse Turing test
based around the sensor readings recorded when the
user was prompted to perform a sequence of uncom-
mon gestures to ensure that near field communica-
tions (NFC) were correctly triggered by the human
user and not by malicious software installed on the
device. This work has the benefit of being able to de-
tect an attack in real time and not posteriori. In 2019
TrendMicro analysed two apps Batterysavermobi and
Currency Convertor which use a threshold of the ac-
celerometer value as means to detect if the malicious
app is under investigation (Sun, 2019).
3 METHODOLOGY/DESIGN
Two apps were developed for this project. The first
app was designed to survey the available sensors on
ICISSP 2022 - 8th International Conference on Information Systems Security and Privacy
596

publicly accessible malware analysis platforms. It
was then modified to collect accelerometer readings.
This two step process was required as the implemen-
tation of sensors varied amongst the surveyed plat-
forms and we could not assume the presence of any
sensor.
The second app utilised Google Play services to
implement a Reverse Turing Test to exploit the vul-
nerability highlighted from the earlier survey of sen-
sor data.
3.1 Information Gathering
Initially seventy online platforms were identified and
then filtered, firstly to remove those that were not
available and secondly, as we are interested in the dy-
namic sensor values returned, sandboxes that focused
solely on static analysis or other file types were dis-
carded. This left us with Seventeen analysis platforms
that met our criteria.
Figure 1 illustrates the workflow where a cus-
tomised APK file was developed for each sandbox
and delivered through its corresponding web portal or
via email. The APK file was unique to each targeted
platform to help us to determine the source of any re-
sponses. Each execution of the survey program was
uniquely identified enabling us to determine if a spe-
cific platform had executed the file more than once.
Workflow of APK Data Collection.
1. Choose a target and customise the APK file.
2. Deliver the APK file to the target.
3. Depending on the type of target platform, the
APK file was then either:
(a) Queued and then executed on the platform.
(b) Forwarded onto third party services in which
case multiple responses were received with the
same target identifier.
4. If the analysis environment allowed access to the
internet, packets were sent back to a server under
our control. The IP address, identifier and sensor
values were logged along with a session ID to see
if the same platform was executing the sample in
parallel.
5. The data was parsed and analysed.
4 RESULTS
In this section we present the data gathered from
seventeen publicly accessible analysis platforms.
Table 1: Responses from hosts after the app is delivered to
each target.
Source of response Number of
responses
OVH SSS 3
Trustwave Holdings, Inc. 2
Forcepoint Cloud 2
Orange Polska Spolka Akcyjna 6
Amazon.com, Inc 73
M247 Ltd 1
Serbia BroadBand-Srpske 2
Trend Micro Incorporated 2
Bitdefender SRL 2
Unknown (Joe Sandbox) 2
The Calyx Institute 1
China Mobile 1
4.1 Analysis of the Network Traffic
Received
We define a “valid unique response” as a host re-
sponding with a correctly formatted unique identifier
and a list of sensors (including an empty sensor list).
Seventy-seven unique IP addresses responded to our
server once the app was delivered. Most of the re-
sponses were from the apps delivered to Virus Total
and Hybrid Analysis. The reason for this multiplier
effect is that Virus Total and Hybrid Analysis are for-
warding received samples to third parties who then
respond, therefore they are defined as meta services
where a single sample can be tested against multiple
antivirus products.
Attribution of the Responses. Because of the low
number of direct responses we combined the use of a
session ID and reverse DNS lookup as well as net-
work tools to find the autonomous system number.
This also aided us in determining if the sample was
potentially being executed multiple times by different
hosts belonging to the same vendor.
Table 1 shows that 75.2% (Seventy-three out of
ninety-seven responses including duplicates gener-
ated by overlap in meta services) of responses orig-
inated from the Amazons Elastic Compute Cloud
(EC2). The EC2 provides the customer with the abil-
ity to allocate resources dynamically and scale up re-
sources such as virtual instances on demand. This
may make it ideal for executing a program multi-
ple times in different environments in order to max-
imise code coverage. Code coverage is important in
the field of malware analysis as greater coverage de-
creases the chance that a malware author has success-
fully hidden the malicious intent of their program.
Malware in Motion
597
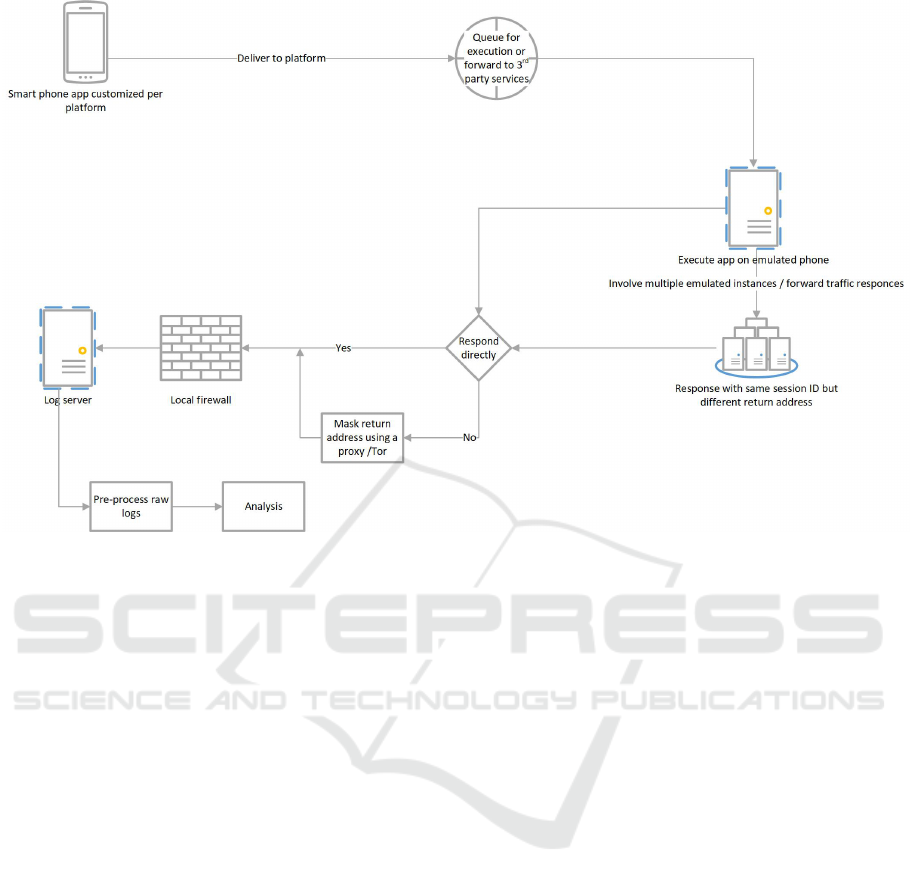
Figure 1: Data collection and analysis process.
Observations of Network Traffic Received from
the Sensor App. By analysing the traffic received
using a session ID we were able to see that some plat-
forms such as Trend Micro executed the sample more
than once and returned different Session IDs for one
submission. Other sandboxes returned data from mul-
tiple IP addresses but with the same Session ID sug-
gesting that this network traffic was being relayed to
mask its origin. Another explanation is that the exe-
cution was being frozen after the Session ID was de-
termined and rerun on different environments (possi-
bly to increase code coverage). Another observation
is that in some cases a surveyed antivirus company
would not respond to the sample being delivered di-
rectly but responses were obtained if the sample was
delivered via a third party service.
4.2 Initial Survey of Available Sensors
Initially we investigated the range of sensors that
are implemented on malware analysis platforms.
We found three principal sensor implementations as
shown in Table 2. The first was a complete list of em-
ulated values with the name “Goldfish” which refers
to the name of the CPU emulator. The second was
just the accelerometer which included a reference to
“Goldfish” and the third was the Kbd Orientation Sen-
sor.
4.3 Accelerometer Values Received
In this section we analyse the values returned by sand-
boxes for the accelerometer x,y and z axis.
Why Was the Accelerometer Sensor Specifically
Chosen for This Study?. During the initial survey
of sensors the accelerometer was the most ubiquitous
of the sensors implemented on the analysis platforms,
meaning that attacks using this sensor have the great-
est coverage. If you register a listener to another sen-
sor such as the gyroscope and it is not present, an ex-
ception will be generated which can lead to the pro-
gram exiting. This may lead to an investigation or
stop an attacker from being able to launch their mali-
cious routines on a valid target. Any attacks involv-
ing the accelerometer are stealthy because it is a low
power sensor and apps using it do not require human
interaction with the smartphone to give permission for
capture of its readings.
Of the platforms that responded only Sandroid and
Joe sandbox returned values from an app that was de-
livered directly. All other responses were from apps
delivered to vendors via the meta services such as
Virus Total and Hybrid Analysis.
Joe sandbox allows the user to set the properties of
the sandbox’s firewall to allow access to the Internet
and thus ensured a response whereas Sandroid allows
responses from the app to exit the network by default.
ICISSP 2022 - 8th International Conference on Information Systems Security and Privacy
598

Table 2: List of available sensors.
Sensor list received Comments
Goldfish 3-axis Accelerometer, Goldfish 3-axis Gyroscope, Goldfish 3-axis Magnetic
field sensor, Goldfish Orientation sensor, Goldfish Temperature sensor, Goldfish Prox-
imity sensor, Goldfish Light sensor, Goldfish Pressure sensor, Goldfish Humidity
sensor, Goldfish 3-axis Magnetic field sensor (uncalibrated), Game Rotation Vector
Sensor, GeoMag Rotation Vector Sensor-Gravity Sensor, Linear Acceleration Sensor,
Rotation Vector Sensor, Orientation Sensor
A list from a virtual platform with the low
power sensors implemented. It is possible
to get sensor values returned such a plat-
form. The term “Goldfish” refers to the
specific virtual hardware implementation
of these sensors.
Goldfish 3-axis Accelerometer A platform with only the accelerometer
implemented.
Kbd Orientation Sensor Virtual device with only a deprecated ori-
entation sensor.
Timing the Length of Sensor Responses. For the
sandboxes that returned sensor values we observed
that the period of time accelerometer values were re-
ceived varied depending on the platform. Sandroid
which responded directly returned accelerometer val-
ues for 185 seconds which was the longest period
observed. Trend Micro’s length of responses varied
depending on where the file was originally delivered
from with the time being either 30 and 28 seconds
from Hybrid Analysis and 62 seconds from Virus To-
tal. The ability to observe these timings represents a
threat because an attacker can introduce stalling code
to delay malicious routines for the appropriate amount
of time.
Analysis of the Values Returned by the Mal-
ware Analysis Platforms Accelerometer. The ac-
celerometer values were gathered by a separate pro-
cess and were dependent on the presence of the
required accelerometer sensor. These values were
stored with an additional session identifier to help dif-
ferentiate between multiple instances of the same app
when executed in parallel from the same network.
Table 3 shows the different sets of static values
returned by the accelerometers of the platforms sur-
veyed. Any reoccurring accelerometer value is evi-
dence of a virtual environment and is in effect an arte-
fact.
The Expected Noise Generated from a Physi-
cal Phone. Real sensors produce varying levels of
“noise” which is generated by sources such as electri-
cal signals and low amplitude.
We demonstrate the expected behaviour of a phys-
ical device by using our app to collect samples
from the accelerometer of a stationary Android smart
phone. The phone was orientated resting face up-
wards on a flat surface.
Figures 2, 3 and 4 show a normal distribution of
accelerometer value on each axis. The mean value for
Figure 2: X axis taken from a real phones’ accelerometer.
Figure 3: Y axis taken from a real phones’ accelerometer.
Figure 4: Z axis taken from a real phones’ accelerometer.
Malware in Motion
599

Table 3: Values received from accelerometers.
Values received (X,Y,Z)/ m/s
2
Comments
0.0,9.776,0.813 Constant Default values for an emulator with the phone standing on its bottom edge but
leaning slight forward on its x axis (4.4 degrees).
0.0,0.0,0.0 Constant No sensor values being generated and gravity has not been included.
0.0,9.81,0.0 Constant Artificially set to have the accepted three decimal place value for gravity. The
phone is orientated as standing on its bottom edge.
each sample set is subtracted in order to filter the data
of constant values such as the components of gravity
and leave the noise. This method was previously used
in the preprocessing of datasets where human activity
recognition is to be performed (Anguita et al., 2013).
5 DISCUSSION
In this section any received data is further analysed,
and possible attacks are identified leading to the for-
mation of the app that conducts the Reverse Turing
Test.
Relative Quality of the Sensor List and Values Re-
turned. In Table 4 the quality of the responses to
requests for lists of sensors and accelerometer values
is ranked in terms of the increasing number of opera-
tions required to clearly show that the environment is
not a valid target.
For example platforms without sensors imple-
mented are ranked the lowest because an attacker
needs only to list the available sensors to see that the
platform is not a valid target.
Lack of Evidence That Samples Are Executed on
a Physical Device. During the sensor survey we
found no evidence of a physical device being used to
run the samples. It would however be the best so-
lution for ensuring transparency of the analysis envi-
ronment. Such a device would need to be stationed
for malware deployment and the lack of “human gen-
erated motion” maybe detected via a simple threshold
test or a more sophisticated attack as discussed in Sec-
tion 5.1.
5.1 Using a Reverse Turing Test to
Detect Analysis
An app was designed to demonstrate how human ac-
tivity recognition could be used against an analysis
environment. Because of the lack of dynamic ac-
celerometer values returned by our survey of sand-
boxes and no evidence of physical devices being used,
we decided to test our activity recognition app on a lo-
cal physical device thereby increasing the difficulty of
our Reverse Turing Test.
Implementation. Google Play services provide the
Activity Recognition API to allow an app to recognise
what a user is doing, for example “In Vehicle”, “On
Bicycle”, “Walking”, “Running”, “Tilting”, “Still”
and “Unknown”. The activities Walking and Run-
ning were used by our app to indicate that a human
user is present (and therefore passes the Reverse Tur-
ing Test). Activity recognition has a small foot print
in the manifest file only requiring one entry and is a
completely legitimate API for apps that are used for
maps or exercise giving an attacker the ability to hide
the app amongst legitimate apps.
Figure 5 shows how we used Google Play services
to conduct a Reverse Turing Test.
1. The app was launched on the chosen testing plat-
form.
2. Sensor values were gathered and delivered to the
model.
3. The group of sensor values was compared to mod-
elled activities and a corresponding confidence
value was returned.
4. If the value exceeded a predetermined confidence
threshold of the target human activity “Walking”
then the Reverse Turing Test is passed otherwise
the app continued to monitor sensor values.
In our test environments the ActivityRecognitionApi
was used to take sensor values from the phone and
return confidence values based on the presumed ac-
tivity which was displayed on the screen and a report
was sent to a server under our control. If this confi-
dence value exceeded a predetermined threshold then
we concluded that the Android environment was not
being operated by a human user and the Reverse Tur-
ing Test was failed.
ICISSP 2022 - 8th International Conference on Information Systems Security and Privacy
600
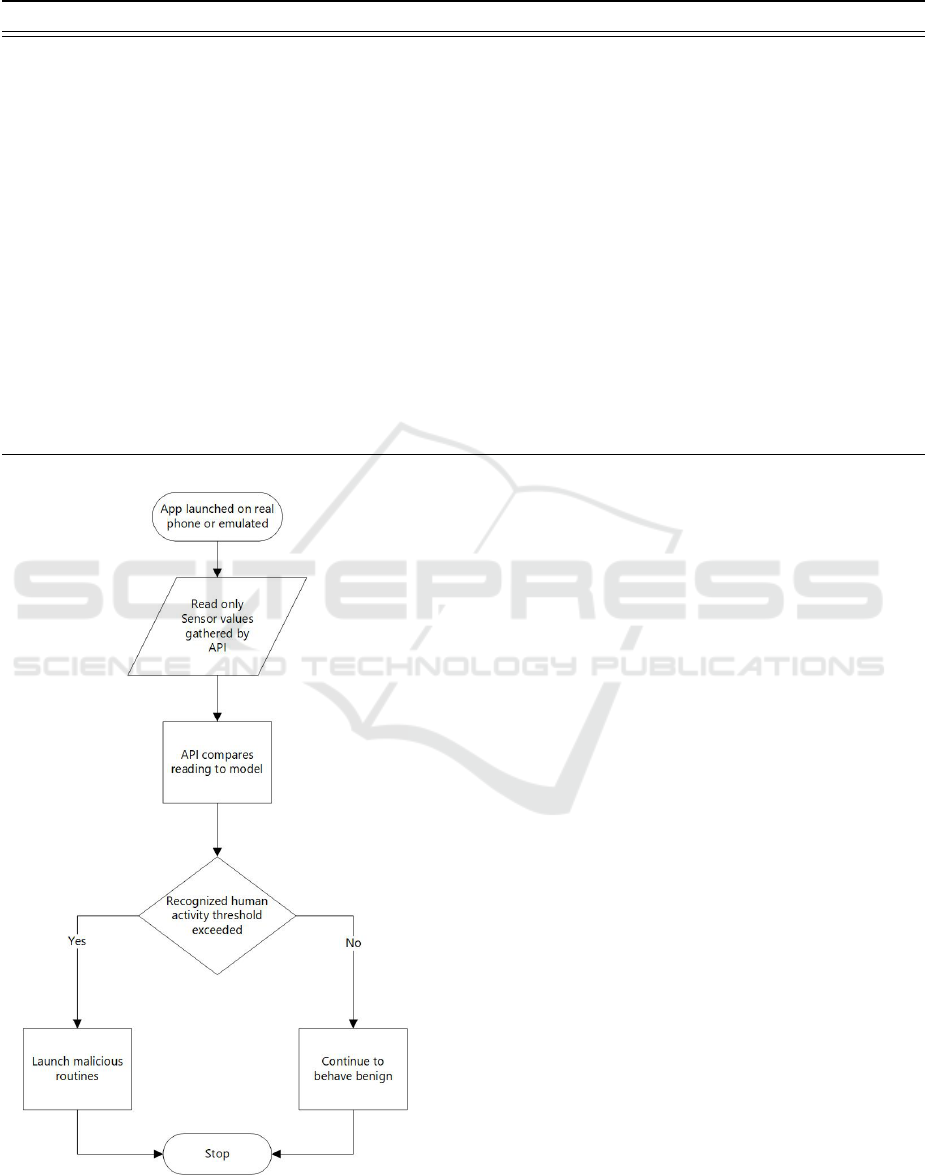
Table 4: Relative quality of accelerometer values returned from survey.
Quality Implementation Discussion
Lowest No sensors implemented listing sensors alone will reveal this is not a real target.
Low Only emulated sensor names
returned
The sensor names reveal the nature of the environment as they contain
the term referring to the emulation platform (Goldfish).
Medium Any static accelerometer read-
ings or improbable readings
Any real world sensor will have noise even when still, therefore looking
for a change in the rate of acceleration will work against any of these
values.
High Virtual sensors returned and
values provided from a static
dataset (This behaviour was not
observed in the survey)
Potentially this approach can overcome a simple threshold test provided
the recordings include an activity that generates the correct type of mo-
tion within the analysis time. However, if these values are observed,
they can be used to as a fingerprint for the presence of analysis.
High Emulator with USB
passthrough
A full list of sensors will be returned, and the values will vary accord-
ing to any noise generated by the physical device. This can also be
expanded to other sensors. This will lack the normal dynamic range
of a device in motion and could be bypassed with a threshold. A de-
vice at rest (such as a mobile device connected via a USB cable) can be
detected using the later demonstrated activity recognition.
Proposed
model
Emulator with return values
to low power sensors replaced
with a probabilistic model
Sensor names and sensor values can be adjusted and distributed at scale.
This has the potential to defeat all tests including the Reverse Turing test
provided the correct activities are modelled in the data.
Figure 5: Implementation of a Reverse Turing test using
activity recognition.
5.1.1 Preliminary Results of Activity
Recognition App
As previously mentioned, the ActivityRecognition-
Api returned confidence values based on the pre-
sumed activity as an array. We found that in this set-
ting the app detected that the phone was “Still” on
a real phone with 100% accuracy. The app returned
“Unknown” if random motion such as shaking the
phone occurred. This was sufficient to exclude all of
the previously surveyed responses as well as the typi-
cal use of a hardware device because hardware analy-
sis devices are often still and connected by cable to the
server responsible for uploading and communicating
with the sample that has been installed on the device.
Even random motion did not trigger the “Walking” or
“Running” state with a high degree of confidence.
Countering Evasion by Activity Recognition.
The following methods are proposed to prevent sand-
box fingerprinting by activity recognition: Malware
analysts’ sandboxes would have to replace local sen-
sors values (which are read-only by default) with real-
istic values that mirror the activities someone is likely
to be doing such as walking or running. This could
be achieved by using a package such as Frida to ex-
change the return values for the relevant sensors.
Alternatively, static analysis methods could be
used to change the flow of execution, but as previ-
ously discussed, there are millions of new malware
instances each year which means that having a solu-
tion that works without manual intervention is a ne-
Malware in Motion
601

cessity to keep up with demand otherwise there would
need to be a choice between delaying publication of
apps or publishing apps where their behaviour has not
been examined.
One exception is if the app is being executed from
within Google Bouncer; if it is possible for Google
Play services to detect that an app is being executed
on Bouncer then the service can be configured to send
confidence values that allow the apps behaviour to be
explored.
6 CONCLUSION
In this paper we conducted a study of the sensors
available from automated Android analysis platforms.
We started by developing an Android app that was
customised to each target to allow us to correctly at-
tribute the data received from each sandbox. Our first
observation was that very few sandboxes out of the
original survey responded directly. This is either be-
cause the platform did not support the app or the traf-
fic from the app was not allowed to transit the sand-
box’s network. We found that only three of the ini-
tially surveyed sandboxes responded in the correctly
formatted manner. However the server still received
responses from seventy-seven hosts.
Analysis of the sensor implementations on pub-
licly available sandboxes showed that the accelerom-
eter was the most ubiquitous of the available sensors
and thus formed the basis of the remaining research.
We found that all analysis platforms that returned sen-
sor lists to our server included a clear indication that
they were virtual and thus are trivial to detect. Other
indicators were the presence of just the accelerometer
or no sensors in the list at all.
On the platforms that returned accelerometer val-
ues in their X, Y, Z dimensional components, all re-
sponses were static and we modelled the threat of de-
tection by rating these responses. The worst being
all 0s returned which, in the presence of gravity and
noise from the device itself, is impossible. The best
current solution is to use a physical device to obtain
real time dynamic values.
As a future work we will aim to implement a sys-
tem to increase transparency of publicly accessible
malware analysis platforms by replacing the locally
sourced sensor values with ones produced by a model
of human activities.
We will also aim to look at implementing our own
model of activity recognition as the basis of a Reverse
Turing Test and compare it to Google Play.
REFERENCES
Anguita, D., Ghio, A., Oneto, L., Parra, X., Reyes-Ortiz,
J. L., et al. (2013). A public domain dataset for human
activity recognition using smartphones. In Esann, vol-
ume 3, page 3.
Bashari Rad, B., Masrom, M., and Ibrahim, S. (2012). Cam-
ouflage in malware: From encryption to metamor-
phism. International Journal of Computer Science
And Network Security (IJCSNS), 12:74–83.
Botas,
´
A., Rodr
´
ıguez, R. J., Matell
´
an, V., and Garc
´
ıa, J. F.
(2018). Empirical study to fingerprint public mal-
ware analysis services. In P
´
erez Garc
´
ıa, H., Alfonso-
Cend
´
on, J., S
´
anchez Gonz
´
alez, L., Quinti
´
an, H.,
and Corchado, E., editors, International Joint Con-
ference SOCO’17-CISIS’17-ICEUTE’17 Le
´
on, Spain,
September 6–8, 2017, Proceeding, pages 589–599,
Cham. Springer International Publishing.
Ferrand, O. (2015). How to detect the cuckoo sandbox and
to strengthen it? Journal of Computer Virology and
Hacking Techniques, 11.
Moser, A., Kruegel, C., and Kirda, E. (2007). Limits of
static analysis for malware detection. In Twenty-Third
Annual Computer Security Applications Conference
(ACSAC 2007), pages 421–430. IEEE.
Nguyen, K. A., Akram, R. N., Markantonakis, K., Luo,
Z., and Watkins, C. (2019). Location Tracking Us-
ing Smartphone Accelerometer and Magnetometer
Traces. Proceedings of the 14th International Con-
ference on Availability, Reliability and Security, pages
1–9.
Shrestha, B., Ma, D., Zhu, Y., Li, H., and Saxena, N.
(2015). Tap-wave-rub: Lightweight human interac-
tion approach to curb emerging smartphone malware.
IEEE Transactions on Information Forensics and Se-
curity, 10(11):2270–2283.
Sun, K. (2019). Google Play Apps Drop Anubis, Use
Motion-based Evasion. Example of malware authors
using an accelerometer to detect Googles bouncer and
get their app onto the legitimate Google play store.
The apps were called BatterySaverMobi and Currency
Convertor.
Zhang, J., Beresford, A. R., and Sheret, I. (2019). SEN-
SORID: Sensor Calibration Fingerprinting for Smart-
phones. 2019 IEEE Symposium on Security and Pri-
vacy (SP), 00:638–655.
ICISSP 2022 - 8th International Conference on Information Systems Security and Privacy
602
