
CrossSiam: k-Fold Cross Representation Learning
Kaiyu Suzuki
1
, Yasushi Kambayashi
2
and Tomofumi Matsuzawa
1
1
Department of Information Sciences, Tokyo University of Science, Japan
2
Department of Computer Information Engineering, Nippon Institute of Technology, Japan
Keywords:
Representation Learning, Machine Learning, Neural Networks, Multi-agent Intelligent Systems, Robustness.
Abstract:
One of the most important tasks for multi-agents such as drones is to automatically make decisions based on
images captured by on-board cameras. These agents must be highly accurate and reliable. For this purpose,
we applied k-fold cross validation to the task of classifying images using deep learning, which is a method that
compares and evaluates models appropriately model of a given problem; this technique is easy to understand
and easy to implement, and it produces results in lower bias estimates. However, k-fold cross validation
reduces the amount of data per neural network, which reduces the accuracy. In order to address this problem,
we propose CrossSiam. CrossSiam is a one of the representation learning methods to train feature encoders to
mimic the embedding space of the validation data of each neural network. We show that the proposed method
has a higher classification accuracy than the ParaSiam (baseline). This approach can be very important in the
field where reliability is required, such as automated vehicles and drones in disaster situations.
1 INTRODUCTION
In recent years, multi-agent system comprising ve-
hicles, such as robots and drones, have been attract-
ing attention in many domains, including disaster re-
lief. These artificial agents should be able to make
their own decisions with high accuracy and reliability.
Deep learning is currently the focus of considerable
research attention as an accurate decision-making
method based on images and videos; it is the state
of the art in several tasks, for which multi-agents are
expected to perform (Suzuki et al., 2021). In particu-
lar, for image classification tasks where a large dataset
is available, AlexNet (Krizhevsky et al., 2012), VGG
(Simonyan and Zisserman, 2014), ResNet (He et al.,
2016), and EfficientNet (Tan and Le, 2019) have
achieved excellent accuracy outperforming other con-
ventional models. The reliability is a major issue
of deep learning. Because it mostly performs black-
box decision making; moreover, it is difficult to cor-
rect mistakes by post-processing due to the complex-
ity. Therefore, more reliable method than those deep
learning methods is required in many tasks.
k-Fold cross validation is a common and simple
method to improve the reliability of machine learning.
It extracts sub-datasets consisting of k train/validation
data by splitting the training dataset into k groups.
This method does not use the test data while train-
ing, but allows the model to evaluate the training re-
sults through validation. Improving robust decisions
with multiple models and multi-agents is effective for
both accuracy and computational cost. Because it is
possible to have multiple models on different agents.
However, k-fold cross validation is rarely applied to
deep learning for the following two reasons.
• It increases the computational cost in proportion
to the number of number of divisions of the train-
ing dataset.
• It decreases the number of training data per
model, thus, decreasing the accuracy.
In particular, the decrease in accuracy resulting from
the decrease in number of training data can be fatal
when the dataset is small.
In this study, we propose a learning method called
CrossSiam. We show that this method can mitigate
the accuracy degradation caused by the application of
k-fold cross validation to deep learning.
2 RELATED WORK
2.1 Representation Learning
Representation learning is a method for obtaining
valuable representations for classification and other
purposes through self-supervised learning.
The major representation learning methods, such
as SimCLR (Chen et al., 2020) and BYOL (Grill et al.,
Suzuki, K., Kambayashi, Y. and Matsuzawa, T.
CrossSiam: k-Fold Cross Representation Learning.
DOI: 10.5220/0010972500003116
In Proceedings of the 14th International Conference on Agents and Artificial Intelligence (ICAART 2022) - Volume 1, pages 541-547
ISBN: 978-989-758-547-0; ISSN: 2184-433X
Copyright
c
2022 by SCITEPRESS – Science and Technology Publications, Lda. All rights reserved
541
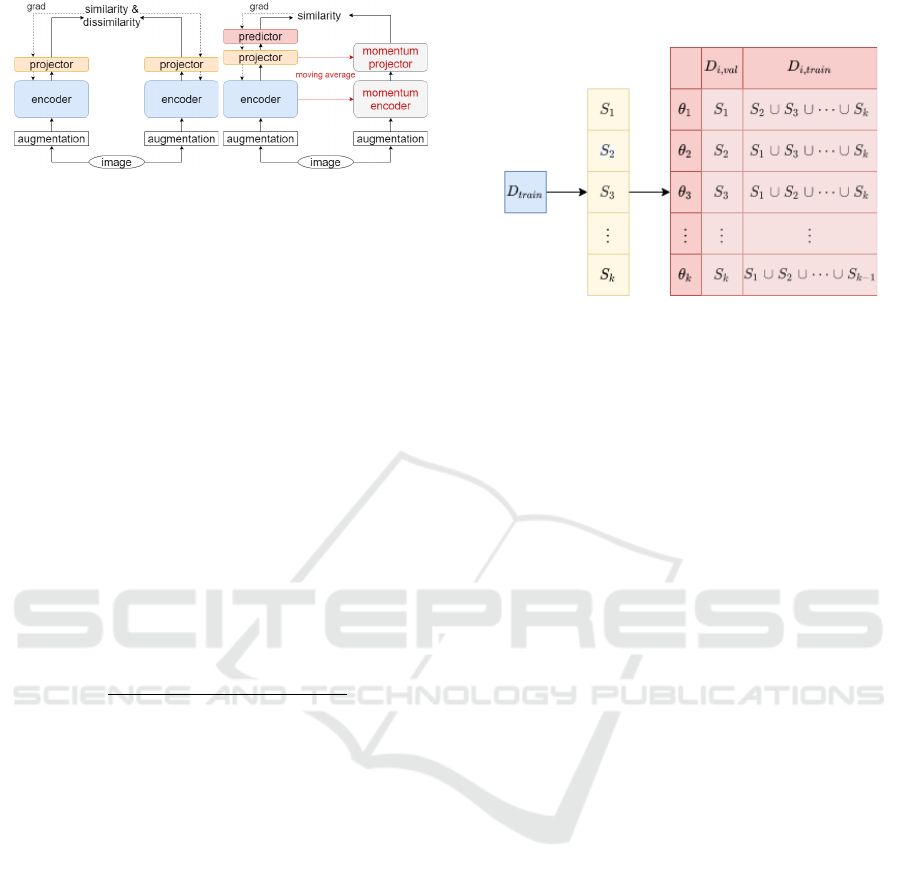
(a) SimCLR (b) BYOL
Figure 1: Major Siamese representation learning architec-
tures.
2020), share a common approach. First, x
1
, x
2
are ob-
tained by applying two data augmentations to a sam-
ple x. Second, z
1
, z
2
, which are feature representa-
tions corresponding to x
1
, x
2
, are obtained from the
neural network. Finally, the neural network learns to
make the two obtained feature representations z
1
, z
2
consistent. To achieve this policy, each method adopts
a different technique for obtaining the network and
loss functions (Figure 1).
SimCLR (Figure 1a) is one of the earliest of these
methods and is trained via the following algorithm.
x
1
, x
2
= aug(x), aug(x)
z
1
, z
2
= g
θ
( f
θ
(x
1
)), g
θ
( f
θ
(x
2
))
loss = L
simclr
(z
1
, z
2
) + L
simclr
(z
2
, z
1
)
where L
simclr
(z
1
, z
2
) is defined in Equation 1.
−
N
∑
i=1
log
exp(sim(z
i1
, z
i2
))
∑
N
j6=i
∑
k∈[1,2]
exp(sim(z
i1
, z
jk
))
. (1)
Here, aug denotes random data augmentation, and
sim denotes the cosine similarity. In addition, f
θ
is a
neural network such as ResNet (He et al., 2016) with-
out the classification layer, and g
θ
is a neural network
consisting of one to three layers.
BYOL (Figure 1b) is an advanced version of Sim-
CLR and MoCo (He et al., 2020). There are two
significant differences between BYOL and SimCLR.
The first is that ξ, which is the model parameter
updated by a moving average of θ, as proposed by
MoCo. This implies that instead of predicting each
z directly, prediction of z
0
output is learned using the
model parameter ξ. The second modification is the
addition of a network h
θ
to predict z and train the out-
put p to predict z‘. The algorithm is as follows:
x
1
, x
2
= aug(x), aug(x)
z
1
, z
2
= g
θ
( f
θ
(x
1
)), g
θ
( f
θ
(x
2
))
z
0
1
, z
0
2
= g
ξ
( f
ξ
(x
1
)), g
ξ
( f
ξ
(x
2
))
p
1
, p
2
= h
θ
(z
1
), h
θ
(z
2
)
loss = sim(p
1
, sg(z
0
2
)) + sim(p
2
, sg(z
0
1
)),
Here, sg denotes the stop gradient.
2.2 k-Fold Cross Validation
Figure 2: k-Fold Cross Validation.
k-Fold cross validation is a common evaluation
method in machine learning. The following steps are
used for training and evaluation (Figure 2):
1. Divide the training data D
train
into k groups
S
1
, S
2
, ..., S
k
.
2. Let S
i
be training data and the rest be validation
data.
3. Train and evaluate the model θ
i
based on
train/validation data
4. Apply Steps 2–3 for all i.
This method improves the reliability of machine
learning. For example, in hyperparameter search,
when optimizing on a fixed set of train/validation
data, there is a possibility of overfitting on that combi-
nation. k-Fold cross validation prevents overfitting by
optimizing on k types of train/validation data. Cross
validation can prevent overfitting by optimizing on k
types of train/validation data.
2.3 Semi-supervised Semantic
Segmentation with Cross Pseudo
Supervision
This method is proposed in (Chen et al., 2021) for
semi-supervised semantic segmentation. It utilizes
unlabeled dataset for training in addition to super-
vised semantic segmentation. In this method, the
unlabeled data is split into two parts and two corre-
sponding neural networks are prepared, each of which
is used as training data. The output of the neural net-
work that is not included in the training data is trans-
formed and used as the pseudo-label for the unlabeled
data. This method enables more robust learning than
existing methods.
In our study, we extend this method to self-
supervised learning, i.e., we consider the classifica-
tion task for the case where the labeled dataset is zero.
SDMIS 2022 - Special Session on Super Distributed and Multi-agent Intelligent Systems
542

Furthermore, we train not only 2-fold but also 5-fold,
because a larger number of partitions increases the
amount of training data per model and the expected
accuracy, while increasing the computational com-
plexity.
3 METHOD
In applying k-fold cross validation to representation
learning, we denote the kth neural net as θ
k
, the train-
ing dataset as D
k,train
, and the validation dataset as
D
k,val
.
3.1 Baseline
ParaSiam, the baseline method of representation
learning with k-fold cross validation, has a loss func-
tion similar to BYOL (Grill et al., 2020).
x ∈ D
k,train
x
1
, x
2
= aug(x), aug(x)
z
1
, z
2
= g
θ
k
( f
θ
k
(x
1
)), g
θ
k
( f
θ
k
(x
2
))
z
0
1
, z
0
2
= g
ξ
k
( f
ξ
k
(x
1
)), g
ξ
k
( f
ξ
k
(x
2
))
p
1
, p
2
= h
θ
k
(z
1
), h
θ
k
(z
2
)
loss =
∑
i=1,2
∑
j=1,2
sim(p
i
, sg(z
0
j
))
where k indicates the ID of the network and corre-
sponding training data of subset, θ
k
and ξ
k
are the kth
model parameters.
3.2 CrossSiam
CrossSiam is the proposed method to improve repre-
sentation learning with k-fold cross validation. Al-
though the loss function is similar to BYOL and
ParaSiam, the target of prediction is other network
validation data like (Chen et al., 2021).
x ∈ D
k,train
∩ D
l,val
(k 6=)
x
1
, x
2
= aug(x), aug(x)
z
1
, z
2
= g
θ
k
( f
θ
k
(x
1
)), g
θ
k
( f
θ
k
(x
2
))
z
0
1
, z
0
2
= g
ξ
l
( f
ξ
l
(x
1
)), g
ξ
l
( f
ξ
l
(x
2
))
p
1
, p
2
= h
θ
k
(z
1
), h
θ
k
(z
2
)
loss =
∑
i=1,2
∑
j=1,2
sim(p
i
, sg(z
0
j
))
where l is one of IDs of the other networks. This func-
tion indicates that z
0
, the target of kth network predic-
tion, is the output of the lth network, with the con-
straint that the input x is the kth training data and the
validation data of the lth network.
4 EXPERIMENTS
In this study, we trained models to learn represen-
tation with ParaSiam and CrossSiam(the proposed
method). To evaluate these models, first, after the
representation learning, we calculate the accuracy of
classification when only the final layer is trained with
the fixed embedding space. Second, we calculate the
difference between embedding space of D
i,train
, D
i,val
,
and D
test
in CrossSiam and ParaSiam, respectively,
and consider whether there is any unfair leakage from
validation data to the model, in other words learning
from validation data. The details of the training con-
figurations are shown in APPENDIX.
4.1 Linear Evaluation
Linear evaluation is a common evaluation method for
representation learning, such as BYOL (Grill et al.,
2020). It measures the classification accuracy of a full
connection layer added to a fixed embedding space to
determine whether the embedding space learns mean-
ingful features. In other words, we evaluate whether
the linear separability of the embedding space can
learn without labels.
While applying k-fold cross validation, the same
segmented training data in representation learning is
used for learning linear evaluation. The network and
learning details are the same. The detailed configura-
tion is shown in APPENDIX.
4.2 Compared Distribution
One of the roles of validation data is to monitor the
training data for overfitting. Conversely, in cases
where validation data cannot monitor overfitting, the
following two conditions may occur:
• Training data and validation data are too close
• Validation data and the test data are too far apart
CrossSiam learns to predict the embedding space
of validation data for one network as it is predicted
by another network. Although this method improves
accuracy, it has the risk of leaking validation data
through network predictions.
To evaluate the possibility of unfair leaks,
we compare embedding space of D
i,train
, D
i,val
,
D
i,train
, D
test
, D
i,val
, D
test
.
In this study, we use Fr
´
echet distance (FD) (Dow-
son and Landau, 1982) as a method to compare two
different embedding distributions:
FD(X, Y) = ||µ
X
− µ
Y
||
2
2
+ Tr(Σ
X
+ Σ
Y
+ 2(Σ
X
Σ
Y
)
1
2
) (2)
CrossSiam: k-Fold Cross Representation Learning
543

where X , Y are embedding spaces from two different
datasets, µ
X
, µ
Y
are the mean features of X, Y , Σ
X
, Σ
Y
are the covariance matrices of X, Y.
4.3 Splitting Dataset for k-Fold Cross
Validation
In k-fold cross validation, the dataset is divided into
k subsets. Then, if the labels in each subset are not
equal, the learning is adversely affected.
In this study, when the dataset is divided by k-fold
cross validation, each subset is constrained to have
equal number of included classes. This allows us to
separate the class inequality problem from the evalu-
ation of the proposed method.
4.4 Dataset and Model Specifications
We employed CIFAR10 as the dataset. It contains
50,000 training data and 10,000 test data for 10
classes of images with a size 32 × 32. We chose
ResNet-18 (He et al., 2016) as the base CNN model.
We trained the model from scratch with a minibatch
size of 512 for 800 ×
k
k−1
epochs. We include more
details in the Appendix. We set 2 and 5 as the number
of folds.
5 RESULTS AND DISCUSSION
5.1 Linear Evaluation
Table 1: Linear Evaluation.
network folds linear evaluation
ParaSiam 2 87.99 ± 0.12%
CrossSiam 2 91.22 ± 0.19%
ParaSiam 5 91.41 ± 0.18%
CrossSiam 5 91.60 ± 0.12%
We show the results of linear evaluation in Table
1. Each item shows the training model, the number of
folds, and the mean and variance of the classification
accuracy for k models, respectively.
We compare ParaSiam and CrossSiam. When the
number of folds is two, the classification accuracy of
CrossSiam is higher than that of ParaSiam. This re-
sult shows the usefulness of CrossSiam. Conversely,
when the number of folds is five, CrossSiam has a
slightly smaller improvement in classification accu-
racy than ParaSiam.
The reason why the improvement is greater in 2-
fold than in 5-fold validations can be explained by the
following reasons.
1. CrossSiam is especially effective when the
amount of data is small
2. CrossSiam is affected by the batch size when cal-
culating validation data
In the future, we plan to conduct experiments to prove
these hypotheses.
5.2 FD
We show the results of the FD in Table 2. Each
item shows the learning model, the number of folds,
FD between D
train
and D
test
, FD between D
train
and D
val
, and FD between D
val
and D
test
, and we
show the results of The ratio of FD(D
train
, D
val
) and
FD(D
val
, D
test
) to FD(D
val
, D
test
) in Table 3.
To investigate whether validation data has lost its
ability to monitor overfitting or not, we focused on the
following points:
• Whether training data and validation data are too
close or not, and
• Whether validation data and the test data are too
far apart or not.
The first item is indicated by FD(D
k,train
, D
k,val
). The
second item is indicated by FD(D
k,val
, D
k,test
).
In experiments (Table 2), FD(D
k,train
, D
k,val
) of
CrossSiam is smaller than the one of ParaSiam at 2-
fold validation, and FD(D
k,train
, D
k,val
) of CrossSiam
is larger than the one of ParaSiam at 5-fold validation.
From this, it is difficult to show the relationship be-
tween the distances of D
k,train
and D
k,val
) in ParaSiam
and CrossSiam at any fold.
Conversely, FD(D
k,val
, D
k,test
) of CrossSiam is
larger compared to that of ParaSiam at both 2-fold and
5-fold validation. This indicates that there is a possi-
bility of a leak from validation to network training in
CrossSiam.
We should evaluate the method with
FD(D
k,train
, D
k,val
) and FD(D
k,val
, D
k,test
) ratio for
FD(D
train
, D
test
), because accuracy of classification
is generally proportional to affinity between D
train
and D
test
) (Deng and Zheng, 2021). Table 3 shows
that FD(D
k,train
, D
k,val
) ratio of CrossSiam is smaller
compared to that of ParaSiam and FD(D
k,val
, D
k,test
)
ratio of CrossSiam is larger compared to the one of
ParaSiam at both 2-fold and 5-fold validation.
These results do not rule out the possibility of
overfitting. Conversely, it is unclear whether the
validation data can be used as a monitoring indi-
cator when overfitting actually occurs. Decreasing
FD(D
k,train
, D
k,val
) and increasing FD(D
k,val
, D
k,test
)
are the requirement for overfitting. In the future,
we will investigate whether D
k,val
follows D
k,train
or
D
k,test
when overfitting actually occurs.
SDMIS 2022 - Special Session on Super Distributed and Multi-agent Intelligent Systems
544

Table 2: FD(·) between each datasets.
network folds D
train
, D
test
D
train
, D
val
D
val
, D
test
ParaSiam 2 0.00529 0.00497 0.00035
CrossSiam 2 0.00110 0.00032 0.00071
ParaSiam 5 0.00196 0.00186 0.00064
CrossSiam 5 0.00078 0.00044 0.00079
Table 3: FD(·) ratio for FD(D
train
, D
test
) between each datasets.
network folds D
train
, D
val
D
val
, D
test
ParaSiam 2 0.939 0.066
CrossSiam 2 0.289 0.642
ParaSiam 5 0.948 0.323
CrossSiam 5 0.564 1.008
6 FUTURE WORK
6.1 Training Method Adapted to k-Fold
Cross Validation
In this study, k-fold cross validation is used for both
CrossSiam and ParaSiam, and they are trained sim-
ilarly to the method without validation data. Con-
versely, there are many learning methods that use val-
idation data. For example, early stopping terminates
learning when the loss or accuracy of the validation
data and training data are far apart.
In CrossSiam(the proposed method), the embed-
ding spaces of the validation data are targeted, and
the in-distribution and out-of-distribution of them is
available. This method cannot be used in ParaSiam
(baseline), because the target data is also the train-
ing data and is likely to be judged as in-distribution.
We will conduct experiments to take advantage of this
feature of CrossSiam, and show greater accuracy im-
provement and robustness to out-of-distribution.
6.2 Multi-agents Intelligence with
Different Decision Criteria
In the case of a multi-agent system such as unmanned
robots and drones, it is necessary for the agents them-
selves to decide the behavior of swarms from cam-
era images. If this decision is made in CrossSiam,
there are two methods to improve reliability when
each drone makes a decision based on a model learned
by k-fold cross validation.
• Prediction of a single drone assembly by k differ-
ent models.
• Prediction of k kinds of drones through each
model.
The first aforementioned method improves the
recognition accuracy of the model. However, all
agents behave similarly; hence, if one drone misses
a decision, it is highly likely that other drones will
also miss the decision. The computational cost is also
k times higher.
The second method does not improve the recogni-
tion accuracy of the model by itself. However, even
if one drone misses a decision due to fluctuations in
learning, other drones may not miss the decision. In
other words, an ensemble of multiple drones becomes
possible. This method can be more robust than that
of an ensemble with multiple drones, which make the
same decision in the same situation.
However, the system will be unreliable if it is un-
able to completely control the movement of the net-
work. It is desirable to learn the ensemble so that the
output of each model is as consistent as possible. The
proposed method can realize an ensemble system and
reduce the output of each network to a common crite-
rion.
7 CONCLUSIONS
In this study, we propose a method to improve the
reliability of multi-agents such as unmanned robots
and drones by making autonomous decisions based on
camera information. First, we apply k-fold cross val-
idation to representation learning as a baseline. This
method splits the dataset into k parts and performs
training and evaluation based on a combination of k
sub-datasets. Conversely, dividing the dataset reduces
the amount of training data, which reduces the accu-
racy of the network. To improve the accuracy, we
proposed CrossSiam. By mimicking the embedding
space of each other’s validation data, this method is
able to train robustly and accurately.
CrossSiam: k-Fold Cross Representation Learning
545

To show the usefulness of CrossSiam, we com-
pared it with ParaSiam, a network that simply applied
k-fold cross validation to representation learning. We
conducted two experiments for evaluation. The first
involved linear evaluation, which measures the classi-
fication accuracy when embedding space is fixed and
only 1 fully connected layer is used for supervised
learning. The experimental results showed that the
proposed method achieved higher accuracy than the
baseline for 2-fold and 5-fold cross validation. In par-
ticular, the accuracy of 2-fold CrossSiam was much
higher than that of 2-fold ParaSiam. The second in-
volved Fr
´
echet distance (FD), the distribution differ-
ence between each dataset like training, validation
and test. The experimental results show that distance
between the embeddings of training data and vali-
dation data is smaller and distance between the em-
beddings of validation data and test data is larger for
CrossSiam than for ParaSiam. This means that, unde-
sirably, CrossSiam has the requirement of leaking ver-
ification data to the network compared to ParaSiam.
However, it is unclear whether leakage actually oc-
curs. In the future, we will conduct experiments to see
if each validation data can be used to suppress overfit-
ting. We also show that CrossSiam can be trained on
datasets with a high percentage of out-of-distribution.
We will experiment to show the suitability of this ap-
proach for autonomous control of multiple drones.
REFERENCES
Chen, T., Kornblith, S., Norouzi, M., and Hinton, G. (2020).
A simple framework for contrastive learning of visual
representations. In III, H. D. and Singh, A., editors,
Proceedings of the 37th International Conference on
Machine Learning, volume 119 of Proceedings of Ma-
chine Learning Research, pages 1597–1607. PMLR.
Chen, X., Yuan, Y., Zeng, G., and Wang, J. (2021). Semi-
supervised semantic segmentation with cross pseudo
supervision. In IEEE Conference on Computer Vision
and Pattern Recognition (CVPR).
Deng, W. and Zheng, L. (2021). Are labels always nec-
essary for classifier accuracy evaluation? In Proc.
CVPR.
Dowson, D. and Landau, B. (1982). The fr
´
echet distance
between multivariate normal distributions. Journal of
Multivariate Analysis, 12(3):450–455.
Grill, J.-B., Strub, F., Altch
´
e, F., Tallec, C., Richemond, P.,
Buchatskaya, E., Doersch, C., Avila Pires, B., Guo,
Z., Gheshlaghi Azar, M., Piot, B., kavukcuoglu, k.,
Munos, R., and Valko, M. (2020). Bootstrap your own
latent - a new approach to self-supervised learning.
In Larochelle, H., Ranzato, M., Hadsell, R., Balcan,
M. F., and Lin, H., editors, Advances in Neural Infor-
mation Processing Systems, volume 33, pages 21271–
21284. Curran Associates, Inc.
He, K., Fan, H., Wu, Y., Xie, S., and Girshick, R. (2020).
Momentum contrast for unsupervised visual represen-
tation learning. In Proceedings of the IEEE/CVF Con-
ference on Computer Vision and Pattern Recognition
(CVPR).
He, K., Zhang, X., Ren, S., and Sun, J. (2016). Deep resid-
ual learning for image recognition. 2016 IEEE Con-
ference on Computer Vision and Pattern Recognition
(CVPR), pages 770–778.
Krizhevsky, A., Sutskever, I., and Hinton, G. E. (2012).
Imagenet classification with deep convolutional neu-
ral networks. In Pereira, F., Burges, C. J. C., Bottou,
L., and Weinberger, K. Q., editors, Advances in Neu-
ral Information Processing Systems, volume 25, pages
1097–1105. Curran Associates, Inc.
Loshchilov, I. and Hutter, F. (2017). SGDR: stochastic gra-
dient descent with warm restarts. In 5th International
Conference on Learning Representations, ICLR 2017,
Toulon, France, April 24-26, 2017, Conference Track
Proceedings. OpenReview.net.
Shamir, O. and Zhang, T. (2013). Stochastic gradient de-
scent for non-smooth optimization: Convergence re-
sults and optimal averaging schemes. In Dasgupta,
S. and McAllester, D., editors, Proceedings of the
30th International Conference on Machine Learning,
volume 28 of Proceedings of Machine Learning Re-
search, pages 71–79, Atlanta, Georgia, USA. PMLR.
Simonyan, K. and Zisserman, A. (2014). Very deep con-
volutional networks for large-scale image recognition.
CoRR, abs/1409.1556.
Suzuki, K., Matsuzawa, T., Takimoto, M., and Kambayashi,
Y. (2021). Vector quantization to visualize the detec-
tion process. In Rocha, A., Steels, L., and van den
Herik, J., editors, ICAART 2021 - Proceedings of the
13th International Conference on Agents and Artifi-
cial Intelligence, pages 553–561. SciTePress.
Tan, M. and Le, Q. (2019). EfficientNet: Rethinking model
scaling for convolutional neural networks. volume 97
of Proceedings of Machine Learning Research, pages
6105–6114, Long Beach, California, USA. PMLR.
APPENDIX
Architecture
In this study, we use f
θ
as ResNet-18 Encoder,
ResNet-18 without the last full connection layer (Ta-
ble 4), projector g
θ
constructed as in Table 6, and pre-
dictor h
θ
constructed as in Table 5 like in BYOL (Grill
et al., 2020).
Training Details for Representation
Learning
We used the SGD optimizer (Shamir and Zhang,
2013) to train model parameters θ in representation
SDMIS 2022 - Special Session on Super Distributed and Multi-agent Intelligent Systems
546
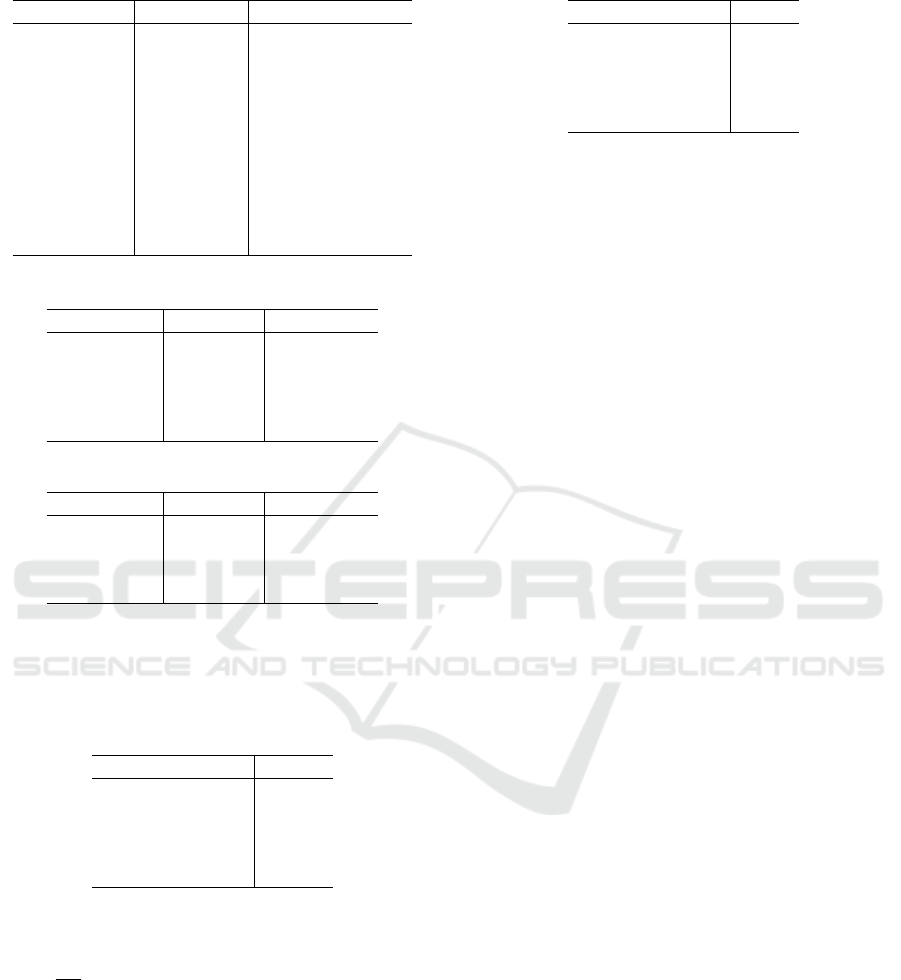
Table 4: ResNet-18 Encoder.
Group name Output size Block type
conv1 32 ×32 [7 × 7, 64, stride2]
conv2 32 ×32
3 ×3, 64
3 ×3, 64
× 2
conv3 16 ×16
3 ×3, 128
3 ×3, 128
× 2
conv4 8 ×8
3 ×3, 256
3 ×3, 256
× 2
conv5 4 ×4
3 ×3, 512
3 ×3, 512
× 2
1 ×1 average pool
Table 5: Projector.
Layer name Input size Output size
Linear 512 2048
BN 2048 2048
ReLU 2048 2048
Linear 2048 2048
BN 2048 2048
Table 6: Predictor.
Layer name Input size Output size
Linear 2048 512
BN 512 512
ReLU 512 512
Linear 512 2048
learning. The base hyperparameters are listed in Ta-
ble 7 with the cosine learning rate decay schedule
(Loshchilov and Hutter, 2017).
Table 7: Optimizer Hyperparameters for Representation
Learning.
Parameter name Value
base learning rate 0.06
final learning rate 0.00
weight decay 0.0005
base epochs 800
batch size 512
The number of training epochs is inversely pro-
portional to the amount of each training data of sub-
set. In other words, the number of epochs at k-Fold is
800 ×
k
k−1
.
Training Details for Linear Evaluation
We fixed ResNet-18 encoders with representation
learning, and added full connection layers for predict-
ing the 10 classes of CIFAR-10.
We used the SGD optimizer (Shamir and Zhang,
2013) for linear evaluation training. The base hyper-
parameters are listed in Table 8 with cosine learning
rate decay schedule (Loshchilov and Hutter, 2017).
Table 8: Optimizer Hyperparameters for Linear Evaluation.
Parameter name Value
base learning rate 30.0
final learning rate 0.0
weight decay
0.0
epochs 100
batch size 256
CrossSiam: k-Fold Cross Representation Learning
547
