
Automatic Pain Intensity Estimation based on Electrocardiogram and
Demographic Factors
Stefanos Gkikas
a
, Chariklia Chatzaki
b
, Elisavet Pavlidou
c
, Foteini Verigou
d
,
Kyriakos Kalkanis
e
and Manolis Tsiknakis
f
Department of Electrical and Computer Engineering, Hellenic Mediterranean University,
Estavromenos, 71410, Heraklion, Greece
Keywords:
Pain Recognition, ECG, Machine Learning, Age, Gender.
Abstract:
Automatic pain intensity estimation possess significant importance for reliable and complete pain manage-
ment. The accurate and continuous monitoring is essential in order to attain objective insight about the con-
dition of the patient. In this work, we elaborate physiological signals in order to estimate the pain intensity
and investigate the impact of demographic factors. Specifically, we exploit electrocardiography signals, adopt-
ing the Pan-Tompkins algorithm to extract important features and apply well-validated classification methods,
while we explore the correlation of gender and age with the pain manifestation.
1 INTRODUCTION
Pain according to the most accepted definition is ”an
unpleasant sensory and emotional experience associ-
ated with actual or potential tissue damage, or de-
scribed in terms of such damage” (Merskey et al.,
1979). The two main types of pain are acute and
chronic, where their main difference is related to the
duration; in the case of acute pain the sensation is
momentary, whereas in chronic lasts longer than a
few months. Pain is a major issue in humans’ life-
time, since every day people of all ages experience
pain, either due to an accident or due to an illness or
even during a treatment. A large percentage of peo-
ple who have been treated for serious illnesses, even
if they have overcome them, may suffer from persis-
tent pain (Lynch, 2011). Since pain is a situation with
physical and psychological dimensions, it affects peo-
ple in a major degree provoking a plethora of daily
life challenges, and especially in chronic pain condi-
tion, it often leads to depression, sleep problems, and
anorexia (Lopez-Martinez and Picard, 2017). Pain
constitutes an incumbrance in health care systems,
since more than 50% of those who are in a hospital
are experience the phenomenon of pain (Cordell et al.,
a
https://orcid.org/0000-0002-4123-1302
b
https://orcid.org/0000-0003-1312-8401
c
https://orcid.org/0000-0003-3744-9648
d
https://orcid.org/0000-0002-3428-158X
e
https://orcid.org/0000-0003-2292-8806
f
https://orcid.org/0000-0001-8454-1450
2002). Large resources of medical and nursing staff
are consumed for the therapy of chronic pain, exceed-
ing the cost of diseases such as cardio-vascular and
neoplasms (Gaskin and Richard, 2012). A consid-
erable body of research indicates divergence on pain
expression and sensation among individuals with dif-
ferent gender or age. In the study of Bartley and
Fillingim (2013) conducting a psychological review
research, concluded that females experience greater
discomfort and pain in more areas of the body than
males, and generally are more sensitive. Similarly, in
the research (Toomey, 2008) also discovered that fe-
males had lower thresholds evaluating equal stimuli
as more intense and painful compared to men, while
Hadjistavropoulos and Craig (2002) refereed that el-
ders present important alterations in pain perception,
compared to younger people.
Self-report is the common approach in clinical
practice used for determining the presence and the
severity of pain, by rating scales or questionnaires.
This process is time consuming and challenging es-
pecially for patients with communicational abnormal-
ities, intellectual disabilities, people with serious ill-
ness or infants, and moreover, the continuous pain
monitoring is unfeasible with the absence of computer
systems (Werner et al., 2014). Adequate and objec-
tive pain assessment is required, in order to provide
the necessary care to people who are suffering, since
inappropriate management of pain can lead to addi-
tional serious health problems.
The process of recognizing pain, is based on
analysis of behavioural and physiological responses;
Gkikas, S., Chatzaki, C., Pavlidou, E., Verigou, F., Kalkanis, K. and Tsiknakis, M.
Automatic Pain Intensity Estimation based on Electrocardiogram and Demographic Factors.
DOI: 10.5220/0010971700003188
In Proceedings of the 8th International Conference on Information and Communication Technologies for Ageing Well and e-Health (ICT4AWE 2022), pages 155-162
ISBN: 978-989-758-566-1; ISSN: 2184-4984
Copyright
c
2022 by SCITEPRESS – Science and Technology Publications, Lda. All rights reserved
155

the behavioural reaction is related with facial ex-
pressions, vocalizations and body-head movements,
while the physiological are the interactions from the
neural structures which lead to the sympathetic out-
flow being affected and increased, something that
can be observed in the physiological signals (Stewart
and Panickar, 2013), such as electroencephalography
(EEG), electrodermal activity (EDA), electromyogra-
phy (EMG) and electrocardiography (ECG).
This study elaborates a pain estimation procedure,
exploiting ECG signals and investigates the differ-
ences on various demographic groups, related to gen-
der and age. In particular, we scrutinize the varia-
tion in pain manifestation among males and females,
we examine the pain diversities across age groups,
and furthermore we combine the factor of age with
the gender. The remaining of this paper is organ-
ised as follows: in Section 2 we present the related
work on automatic pain estimation, Section 3 de-
scribes the methodology for the feature extraction ap-
proach and the machine learning methods, in Section
4 we present the conducted experiments and results
and the paper is concluded in Section 5.
2 RELATED WORK
A significant number of published research efforts
(Wang et al., 2020; Mamontov et al., 2019), were
based on biosignals to interpret the pain sensation,
since in many cases the video modalities e.g. facial
expression are relatively difficult to elaborate, espe-
cially in clinical settings where the patient rotates or
due to facial occlusions from medical support devices
or the patient’s hands. Additionally, there are circum-
stances where the individuals pretend facial expres-
sion in order to elicit personal interest (Rohling et al.,
1995). The correlation among pain and physiolog-
ical signals like heart rate variability, electrodermal
activity, brain function, and respiration rate have been
examined in plethora of studies (Werner et al., 2019).
According to a study done by Chu et al. (2017)
linear discriminant analysis was utilized based on
data of six healthy participants, to categorize the pain
into five distinct levels, based on ECG and EDA
employing Genetic Algorithms and Principal Com-
ponent Analysis. K
¨
achele et al. (2016) exploited
EDA, ECG and EMG, extracting several features
such as skewness, standard deviation and QRS com-
plexes. Applying Random Forest (RF) conducted
multi-classification on five pain levels, while Lopez-
Martinez and Picard (2017) designed a multitask neu-
ral network for personalized pain recognition using
ECG and EDA signals. Similarly, in their work
Amirian et al. (2016) explored the continuous and
discrete pain estimation exploiting ECG, EMG and
EDA. Time domain (e.g. Willison amplitude), fre-
quency domain and entropy features (e.g. Shannon)
were extracted and a Radial Basis Function (RBF)
Neural Network was designed achieving accepted
performances.
Recently, Deep Learning (DL) approaches have
been studied for their application in pain estimation,
after their success in different scientific areas. The re-
search of Thiam et al. (2019) investigated DL mod-
els for pain categorization. They applied 1D Con-
volutional Neural Networks (CNN) on galvanic skin
response signals improving the binary classification
between no pain and the highest pain intensity. Yu
et al. (2020) studied three levels of pain based on
EEG, developing a framework that consisted of sev-
eral convolutional modules, each one related to differ-
ent frequency range, while Lopez-Martinez and Pi-
card (2018) proposed a Recurrent Neural Network
(RNN) for determining the severity of the pain, based
on the deconvolved signals, extracting tonic-phasic
components from EDA and R peaks as well as inter-
beat intervlas (IBIs) from ECG.
Furthermore, to the best of our knowledge there
exist two studies which investigate demographic fac-
tors. In the study of Hinduja et al. (2020) the au-
thors exploited several physiological signals (e.g. di-
astolic blood pressure, respiration rate, EDA), facial
action units and the combination of them as well, re-
vealing the existence of significant differences among
men and women in pain sense, on both unimodal
and multimodal approaches. Similarly, Subramaniam
and Dass (2021) conducted experiments through ECG
and EDA adopting Convolutional Neural Networks
(CNN) disclosed performance variations between the
gender.
3 METHODOLOGY
The employed pain database, the electrocardiogra-
phy processing algorithm, as well as the extraction
method of features and classification algorithms will
be described in this section.
3.1 BioVid Heat Pain Dataset
In this study we utilized the publicly available
”BioVid Heat Pain Database” (Walter et al., 2013),
which comprises facial videos, and biosignals (ECG,
EMG, EDA) from 87 subjects (44 males and 43 fe-
males, age 20-65 ), and currently is the only pub-
licly available dataset which includes the subjects’
ICT4AWE 2022 - 8th International Conference on Information and Communication Technologies for Ageing Well and e-Health
156

age and gender. Data were collected by subjecting
heat stimulus on the right arm by a thermode. Be-
fore the data recording was started, for each subject
the pain threshold (the temperature for which the par-
ticipant’s sensing changes from heat to pain) and pain
tolerance (the temperature at which the pain becomes
intolerable) were determined. The specific thresh-
olds utilized as the temperatures for lowest and high-
est pain levels, and addition two intermediate levels
were included, resulting to 5 pain conditions: No pain
(NP), mild pain (P1), moderate pain (P2), severe pain
(P3), very severe pain (P4). The participants were
stimulated 20 times for every intensity, thus gener-
ating 100 samples for each of the four modalities.
We employed Part A of the BioVid, specifically the
pre-processed ECG samples with a Butterworth band-
pass filter (87 × 100 = 8700).
3.2 ECG Signal Processing and Analysis
An ECG signal reflects the electrical activity of the
heart over a period of time. A normal ECG consist
of a series of waves, namely P, Q, R, S, T and some-
times U. These waves and their intervals give impor-
tant information regarding the heart’s function. The P
wave signs atrial depolarization. The QRS complex
represents ventricular depolarization and contraction,
while the T wave represents repolarization of ventri-
cles. Therefore, each heartbeat is represented by the
PQRST complex (see Figure 1). The accurate and re-
liable detection of the R wave in the QRS complex is
of high importance since it is the most prevalent peak
in the complex. By accurately detecting the R wave
we can compute the heart rate (HR) and the heart rate
variability (HRV), which is related with the time inter-
val between consecutive R waves, called R-R interval
or Interbeat interval.
One the most widely used real time QRS detec-
tion algorithm is the Pan-Tompkins Algorithm (Pan
and Tompkins, 1985). Over the past decades the orig-
inal Pan-Tompkins algorithm and several modifica-
tions have been evaluated, with the results to support
its efficiency even in noisy and low-quality data (Far-
iha et al., 2020; Liu et al., 2017). The performance
of the Pan-Tompkins Algorithm has been repeatedly
evaluated and therefore considered to be one of the
state-of-the-art algorithms for QRS detection, used
also for performance comparison in new approaches
(Zhao et al., 2021). In this study we adopted the
original Pan-Tompkins Algorithm for the detection of
the QRS complex. The integration of the algorithm
emerged in two stages: the preprocessing and the de-
cision. The preprocessing is an essential procedure
to prepare the ECG, removing the noise and artefacts,
Q
R
S
T
P
QRS
Complex
PR
Interval
QT Interval
Figure 1: The PQRST complex.
Low Pass FilterECG High Pass Filter Differentiation
Adaptive Thresholds
Moving Window
Integration
Squaring
QRS
Complex
Band-Pass Filter
Low Pass FilterECG High Pass Filter
Differentiation
Adaptive
Thresholds
Moving Window
Integration
Squaring
QRS
Band-Pass Filter
Figure 2: The flow diagram of the pre-processing procedure
of the Pan-Tompkins algorithm.
smoothing the signal, and increasing the QRS slope.
The flow diagram of the preprocessing procedure of
the Pan-Tompkins algorithm is shown on Figure 2.
3.3 Feature Extraction
The succeeding phase is the extraction of specific fea-
tures based on the inter-beat intervals (IBIs). In our
work, the mean of IBIs, the root mean square of suc-
cessive differences (RMSSD), the standard deviation
of IBIs (SDNN), the slope of the linear regression of
IBIs, the ratio of SDNN to RMSSD, and the heart beat
rate, were calculated as follows:
1. Mean of IBIs
µ =
1
n
n
∑
i=1
(RR
i+1
− RR
i
) (1)
where RR are consecutive R peaks.
2. Root mean square of successive differences
RMSSD =
s
1
n − 1
n−1
∑
i=1
(RR
i+1
− RR
i
)
2
(2)
3. Standard deviation of IBIs
SDNN =
s
1
n − 1
n
∑
i=1
(RR
i
− µ)
2
(3)
Automatic Pain Intensity Estimation based on Electrocardiogram and Demographic Factors
157

4. Slope of the linear regression of IBIs
A
T
Ax = A
T
b (4)
based on the least-square approximation, where b
is the vector of RR peak intervals and A is the cor-
responding time series.
5. Ratio of SDNN to RMSSD
SR =
SDNN
RMSSD
(5)
6. Heart beat rate
HR =
60 · FS
µ
(6)
where FS is the frequency of ECG recording and
is equal to 512 Hz. Figure 3 shows the raw ECG
signal and the applied algorithm’s steps as well.
3.4 Classification Methods
For the classification phase, three well known clas-
sifiers were deployed: Linear Discriminant Analysis
(LDA), the Support Vector Machine (SVM) with lin-
ear kernel, and the SVM with Radial Basis Function
(RBF) kernel. Furthermore, all the conducted exper-
iments repeated threefold with identical settings, uti-
lizing a particular classifier in every repetition in order
to compare their performances, founded on the leave-
one-subject-out (LOSO) cross validation, employing
all the available subjects and ECG samples, and as
evaluation performance we adopted the metric of ac-
curacy.
1. Linear Discriminant Analysis
P(X|y = k) =
exp
−
1
2
(X −µ
k
)
t
Σ
−1
k
(X −µ
k
)
t
(2π)
d/2
|Σ
k
|
1/2
(7)
where P is the probability density function of fea-
tures X given the target y and class k.
2. SVM with linear kernel
K(x
1
,x
2
) = x
T
1
x
2
(8)
where x
1
, x
2
are features from two distinct classes.
3. SVM with Radial Basis Function (RBF) kernel
K(x
1
,x
2
) = exp
−
||x
1
− x
2
||
2
2σ
2
!
(9)
where σ is the width of the kernel.
4 EXPERIMENTS & RESULTS
Utilizing the aforementioned classification algo-
rithms, we conducted several experiments with the
objective of pain recognition and it’s relation with
demographic factors. The classification tasks were
based on the pain conditions and implemented in a
multi-class classification manner, as well as binary
classification. Specifically five distinct experiments
were performed: (1) multi-class pain classification,
(2) NP vs P1, (3) NP vs P2, (4) NP vs P3, (5) NP vs
P4. In (1) the purpose is to classify an ECG signal
in one of the five pain conditions, while in (2)-(5) to
classify it in one of the two pain conditions, i.e. no
pain and the corresponding pain level. In addition,
taking into consideration the gender and the age of
subjects, we developed four different schemes; (1) the
basic scheme where we employed the whole dataset,
(2) the gender scheme where the data were divided
based on the gender of subjects i.e. males-females, (3)
the age scheme based on the age of subjects, creating
three groups i.e. ’20-35’, ’36-50’, ’51-65’, and finally
(4) the gender-age scheme was in accordance to gen-
der and age combined, creating six different subjects
groups i.e. ’males 20-35’, ’females 20-35’, ’males 36-
50’, ’females 36-50’, ’males 51-65’, ’females 51-65’.
The best classification results are presented in Figures
4-5 for every corresponding task and the utilized clas-
sification method, while the Tables 1-5 enclose every
individual experiment.
Table 1 presents the results utilizing the whole
dataset, where for the multi-class pain classification
we achieved 23.79%, and the performance scores in-
creased as much as the pain intensity raise, reaching
58.62% on NP vs P4, indicating the challenges to de-
tect the low magnitude of pain severity. Regarding the
classification algorithms, the SVM (linear) performed
ameliorative, besides the last task related to the higher
level of pain, while the SVM (RBF) exhibited inferi-
orly. On the gender scheme (see Table 2), we observe
differences among males and females. Females in to-
tal presented 1.12% variation from males, where in
task NP vs P4 attained 60.69% accuracy over 56.07%,
where the 4.62% increase indicates that women are
more sensitive in higher pain levels than men. Curi-
ously, in NP vs P1 and NP vs P2 the males outper-
formed by 1.16% and 1.78%, respectively, and sim-
ilarly to the first scheme, the SVM (linear) obtained
greater results in most of the tasks. Figure 4 depict
the gender differences, based on the classification ac-
curacy.
On the age scheme (see Table 3), the group ’20-
35’ presented 25.06% in multi-level classification
over 23.27% and 22.35% from the groups ’36-50’and
ICT4AWE 2022 - 8th International Conference on Information and Communication Technologies for Ageing Well and e-Health
158
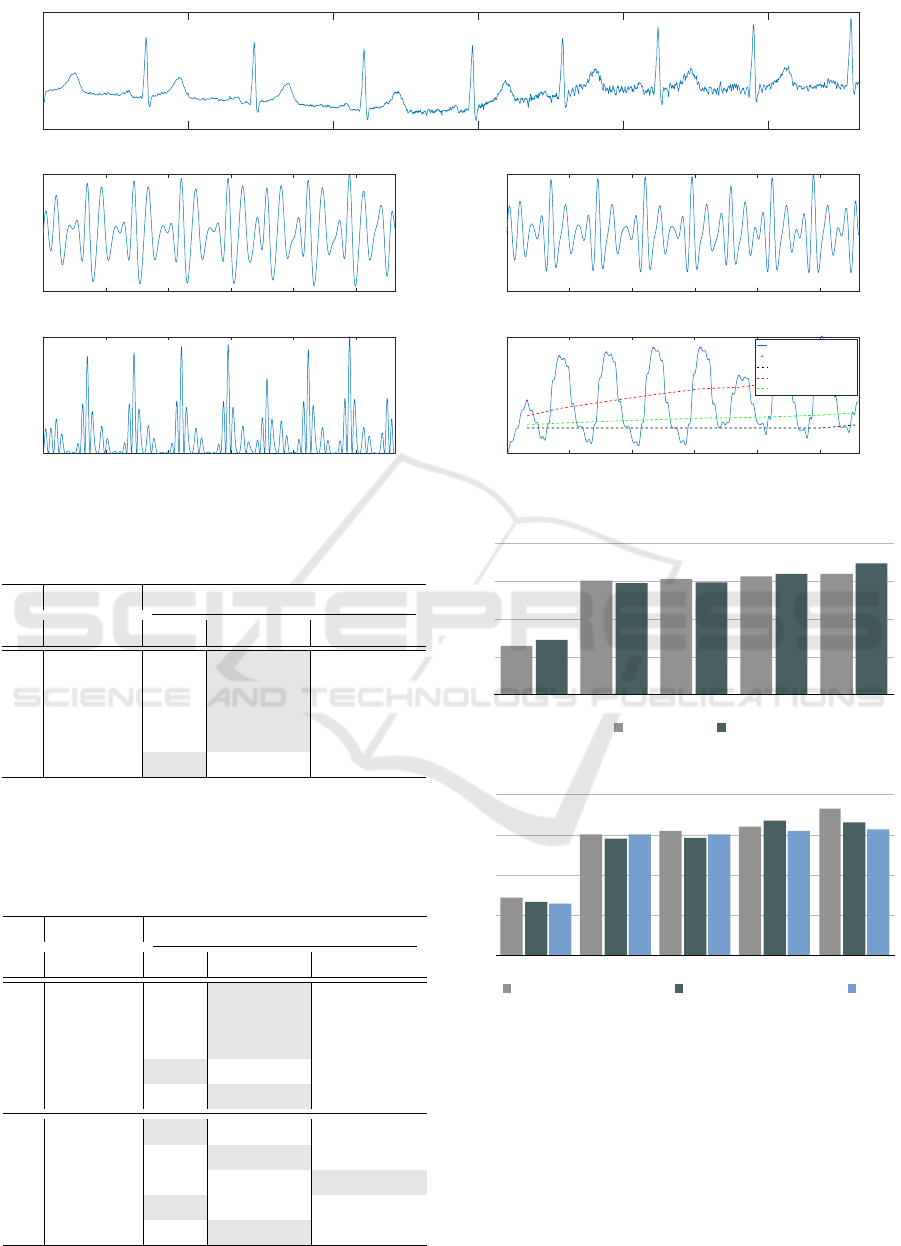
0 500 1000 1500 2000 2500
Time (ms)
Raw Signal
0 500 1000 1500 2000 2500
Time (ms)
Band Pass Filtered
0 500 1000 1500 2000 2500
Time (ms)
Derivative Filtered
0 500 1000 1500 2000 2500
Time (ms)
Squared
500 1000 1500 2000 2500
Time (ms)
Moving Window Averaged
Signal
QRS
Noise Level
Signal Level
Adaptive Threshold
Figure 3: The signal pre-processing with Pan-Tompkins algorithm.
Table 1: Classification results of the Basic Scheme, re-
ported on % accuracy.
Group
Task
Algorithm
LDA SVM LN SVM RBF
All
MC 23.72 23.79 22.77
NP vs P1 50.97 52.38 49.97
NP vs P2 52.55 52.78 52.70
NP vs P3 55.20 55.37 53.87
NP vs P4 58.62 58.39 57.41
MC: multi-classification NP: no pain P1: mild pain P2: moderate pain
P3: severe pain P4: very severe pain LDA: Linear Discriminant Analysis
LN:Linear RBF: Radial Basis Function
Table 2: Classification results of the Gender Scheme, re-
ported on % accuracy.
Group
Task
Algorithm
LDA SVM LN SVM RBF
Males
MC 22.13 22.25 20.70
NP vs P1 51.53 52.61 47.72
NP vs P2 53.12 53.69 52.15
NP vs P3 54.94 54.71 51.36
NP vs P4 55.28 56.07 51.36
Females
MC 25.11 24.41 23.41
NP vs P1 50.23 51.45 49.06
NP vs P2 51.62 51.86 51.91
NP vs P3 55.98 55.87 55.29
NP vs P4 60.17 60.69 59.82
0
15
30
45
60
MC
BL vs P1
BL vs P2
BL vs P3
BL vs P4
Basic Gender Age Gender-Age
Schemes (max scores)
Basic
Gender
Age
Gender-Age
MC
24
24
24
23
BL vs P1
52
52
52
52
BL vs P2
53
53
53
53
BL vs P3
55
55
56
56
BL vs P4
59
58
59
59
Gender (max scores)
Males
Females
MC
22
25
BL vs P1
53
51
BL vs P2
54
52
BL vs P3
55
56
BL vs P4
56
61
0
18
35
53
70
MC
BL vs P1
BL vs P2
BL vs P3
BL vs P4
Males Females
Age
20-35
36-50
51-65
MC
25
23
22
BL vs P1
53
51
53
BL vs P2
54
51
53
BL vs P3
56
59
54
BL vs P4
64
58
55
0
18
35
53
70
MC
BL vs P1
BL vs P2
BL vs P3
BL vs P4
20-35 36-50 51-65
Gender-Age
Males 20-35
Females 20-35
MC
23
25
BL vs P1
53
52
BL vs P2
54
55
BL vs P3
57
54
BL vs P4
60
67
0
18
35
53
70
MC
BL vs P1
BL vs P2
BL vs P3
Males 20-35 Females 20-35 Males 36-50 Females 36-50 Males 51-65
1
Figure 4: Classification results on the Gender Scheme.
0
15
30
45
60
MC
BL vs P1
BL vs P2
BL vs P3
BL vs P4
Basic Gender Age Gender-Age
Schemes (max scores)
Basic
Gender
Age
Gender-Age
MC
24
24
24
23
BL vs P1
52
52
52
52
BL vs P2
53
53
53
53
BL vs P3
55
55
56
56
BL vs P4
59
58
59
59
Gender (max scores)
Males
Females
MC
22
25
BL vs P1
53
51
BL vs P2
54
52
BL vs P3
55
56
BL vs P4
56
61
0
18
35
53
70
MC
BL vs P1
BL vs P2
BL vs P3
BL vs P4
Males Females
Age
20-35
36-50
51-65
MC
25
23
22
BL vs P1
53
51
53
BL vs P2
54
51
53
BL vs P3
56
59
54
BL vs P4
64
58
55
0
18
35
53
70
MC
BL vs P1
BL vs P2
BL vs P3
BL vs P4
20-35 36-50 51-65
Gender-Age
Males 20-35
Females 20-35
MC
23
25
BL vs P1
53
52
BL vs P2
54
55
BL vs P3
57
54
BL vs P4
60
67
0
18
35
53
70
MC
BL vs P1
BL vs P2
BL vs P3
Males 20-35 Females 20-35 Males 36-50 Females 36-50 Males 51-65
1
Figure 5: Classification results on the Age Scheme.
’51-65’ respectively, revealing that age is a factor
which influences the pain sensation. Especially, in
NP vs P4 demonstrated a difference nearly 9% be-
tween the youngest and the oldest group. Analo-
gously to the gender scheme, in low pain intensi-
ties there exist slight differences among the groups,
which increased as the pain escalates. Specifically,
the variance (σ
2
) between the three groups in NP
vs P1 was 1.38% while in the remaining tasks was
Automatic Pain Intensity Estimation based on Electrocardiogram and Demographic Factors
159

2.44%, 6.35% and 20.42% respectively, revealing that
in order to identify the differences of pain perception
among the groups, is essential for pain to increase to a
high intensity. On the basis of classification accuracy,
the group ’20-35’ described with the highest sensitiv-
ity followed by the group ’36-50’ and ’51-65’. Ad-
ditionally, relating to the classification methods, the
SVM (RBF) in group ’51-65’ performed superior in
almost every task, while in group ’20-35’ completely
underperformed, indicating that is the finest choice
for difficult separable classes. In Figure 5 illustrated
the results of Age scheme.
In the last scheme, we studied in a more precisely
manner the subjects, in order to obtain a better insight
about the correlation of pain and the demographic fac-
tors of gender and age. In Tables 4-5 we observe that
in the multi-class pain classification the higher accu-
racy achieved by ’females 20-35’ with 24.80% accu-
racy, while in NP vs P1 the ’females 51-65’ reached
55.38%, disclosing again that the female gender char-
acterized by a elevated sensitivity. Likewise, the high-
est performance in NP vs P2 achieved by the ’females
51-65’ followed by the ’males 51-65’, although in NP
vs P3 the ’females 36-50’ exceeded by 3.5% from the
second best group ’males 20-35’. Finally, in the last
task of NP vs P4 the ’females 20-35’ outperformed
attaining 67%, where the minimal performance ob-
served on ’males 51-65’ with 54.50%, where the par-
ticular groups are the uttermost and the minor sensi-
tive group respectively. We report that in some cases
the classification accuracy is lower than others, de-
spite the fact the pain level is increased (e.g. ’Fe-
males 36-50’). An explanation could be related to
the recording procedure of biosignals, where the sub-
jects may get accustomed to the stimulation thence-
forwards.
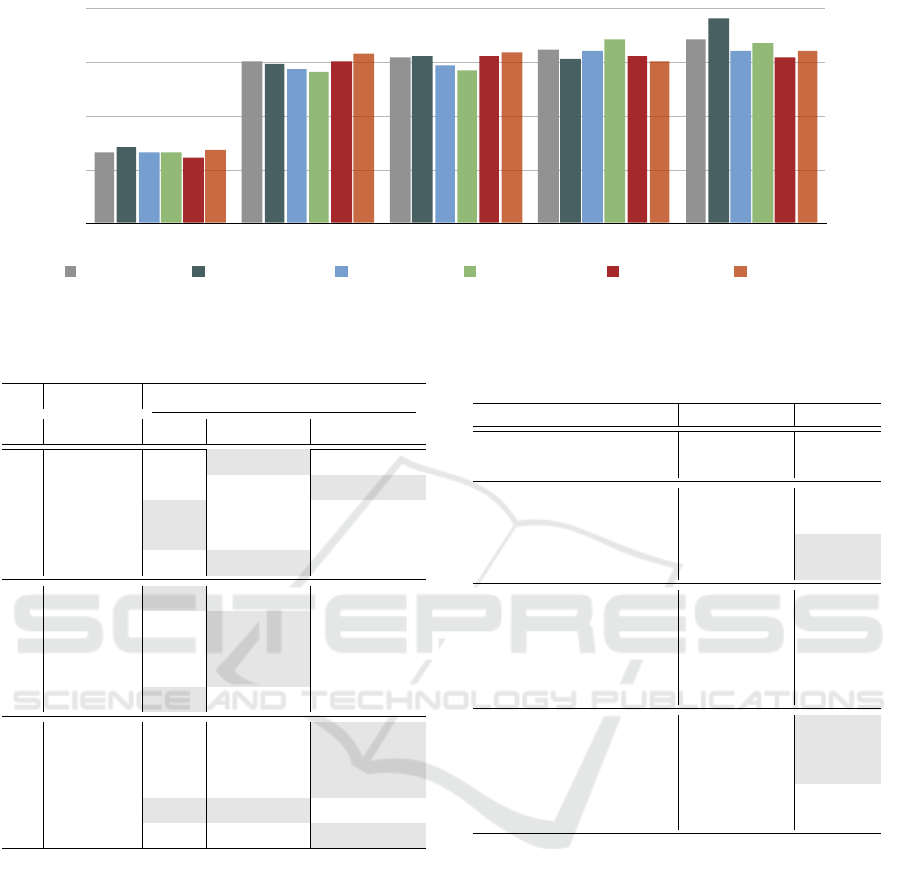
In Figure 6 we visualize the classification perfor-
mances of the six groups in the Gender-Age scheme.
Additionally, in Table 6 we compare ours accom-
plished results with related studies which utlized the
ECG signals from BioVid database and followed the
same evaluation protocol, in order to have objective
and fair comparison. We are able to achieve the best
classification performance in the multi-class setting,
as well as in NP vs P1 and NP vs P2. In the the re-
maining binary classification tasks we obtain accept-
able results.
5 CONCLUSION
Automatic pain intensity estimation possess great
value in effective pain management. This paper stud-
ied the ECG biosignals, utilizing the Pan-Tompkins
Table 3: Classification results of the Age Scheme, reported
on % accuracy.
Group
Task
Algorithm
LDA SVM LN SVM RBF
20-35
MC 25.06 24.73 21.96
NP vs P1 52.83 52.83 49.90
NP vs P2 54.33 53.75 52.75
NP vs P3 55.58 56.16 54.66
NP vs P4 63.83 63.41 60.75
36-50
MC 23.27 22.06 23.03
NP vs P1 50.34 48.36 50.68
NP vs P2 49.13 51.20 50.17
NP vs P3 58.10 58.70 58.27
NP vs P4 58.10 57.75 55.94
51-65
MC 21.89 22.07 22.35
NP vs P1 52.23 51.87 52.58
NP vs P2 52.14 51.69 52.76
NP vs P3 53.66 53.39 54.10
NP vs P4 54.46 54.19 54.91
Table 4: Classification results of the Gender-Age Scheme
(Males), reported on % accuracy.
Group
Task
Algorithm
LDA SVM LN SVM RBF
Males 20-35
MC 23.13 23.20 18.73
NP vs P1 52.50 52.83 45.83
NP vs P2 54.00 53.50 53.16
NP vs P3 56.33 56.50 54.83
NP vs P4 60.00 59.00 53.66
Males 36-50
MC 23.21 22.21 20.92
NP vs P1 50.53 50.53 46.42
NP vs P2 50.00 51.78 47.50
NP vs P3 54.64 56.25 47.32
NP vs P4 55.53 56.25 51.96
Males 51-65
MC 20.06 21.60 19.60
NP vs P1 52.66 51.66 50.66
NP vs P2 54.00 54.66 51.50
NP vs P3 53.00 54.66 51.50
NP vs P4 53.33 54.50 49.83
algorithm for the detection of QRS complexes extract-
ing features related to the inter-beat intervals. Addi-
tionally, we experimented with three machine learn-
ing methods, comparing them in tasks of multi-class
and binary pain classification of different pain inten-
sities. Furthermore, we scrutinized the effect of gen-
der and age in pain manifestation, revealing that they
ICT4AWE 2022 - 8th International Conference on Information and Communication Technologies for Ageing Well and e-Health
160
0
15
30
45
60
MC
BL vs P1
BL vs P2
BL vs P3
BL vs P4
Basic Gender Age Gender-Age
Schemes (max scores)
Basic
Gender
Age
Gender-Age
MC
24
24
24
23
BL vs P1
52
52
52
52
BL vs P2
53
53
53
53
BL vs P3
55
55
56
56
BL vs P4
59
58
59
59
Gender (max scores)
Males
Females
MC
22
25
BL vs P1
53
51
BL vs P2
54
52
BL vs P3
55
56
BL vs P4
56
61
0
18
35
53
70
MC
BL vs P1
BL vs P2
BL vs P3
BL vs P4
Males Females
Age
20-35
36-50
51-65
MC
25
23
22
BL vs P1
53
51
53
BL vs P2
54
51
53
BL vs P3
56
59
54
BL vs P4
64
58
55
0
18
35
53
70
MC
BL vs P1
BL vs P2
BL vs P3
BL vs P4
20-35 36-50 51-65
Gender-Age
Males 20-35
Females 20-35
Males 36-50
Females 36-50
Males 51-65
Females 51-65
MC
23
25
23
23
22
24
BL vs P1
53
52
51
49
53
55
BL vs P2
54
55
52
50
55
56
BL vs P3
57
54
56
60
55
53
BL vs P4
60
67
56
59
54
56
0
18
35
53
70
MC
BL vs P1
BL vs P2
BL vs P3
BL vs P4
Males 20-35 Females 20-35 Males 36-50 Females 36-50 Males 51-65 Females 51-65
1
Figure 6: Classification results on the Gender-Age Scheme.
Table 5: Classification results of the Gender-Age Scheme
(Females), reported on % accuracy.
Group
Task
Algorithm
LDA SVM LN SVM RBF
Females 20-35
MC 24.73 24.80 23.26
NP vs P1 49.83 51.50 52.00
NP vs P2 54.50 53.66 46.50
NP vs P3 53.50 52.83 49.00
NP vs P4 65.83 67.00 62.16
Females 36-50
MC 23.06 22.73 21.93
NP vs P1 48.16 49.33 48.33
NP vs P2 48.66 49.83 47.83
NP vs P3 57.50 60.00 55.00
NP vs P4 59.00 58.83 56.16
Females 51-65
MC 21.23 21.84 23.92
NP vs P1 48.84 49.80 55.38
NP vs P2 51.15 48.65 55.96
NP vs P3 53.07 53.07 50.96
NP vs P4 52.69 55.00 56.34
are major factors directly related to pain perception.
The conducted experiments exhibited great variation
among the genders where the males presented lower
sensitivity, especially in high pain intensities. Regard-
ing to age factor, significant variations demonstrated
as well, disclosed that as long the age increases the
pain sensation is diminished, and as consequent the
increased risk for further injury. In particular demo-
graphic groups the difference is over 12%, indicating
the divergence of pain sensation among people. We
suggest that clinical pain assessment tools, need to be
specifically designed for certain groups related to the
particular demographic factors considering the unique
pain manifestation’ characteristics. Furthermore, we
indicate to researchers who will involve in the cre-
ation of new pain databases, the necessity for the inte-
gration of demographic factors, as well as information
Table 6: Comparison of studies which utilized BioVid,
ECG signals and LOSO cross validation, reported on %
accuracy.
Method Task Results
Lopez-Martinez and
Picard (2018)
NP vs P4 57.69
Werner et al. (2014)
NP vs P1 48.70
NP vs P2 51.60
NP vs P3 56.50
NP vs P4 62.00
Thiam et al. (2019)
MC 23.23
NP vs P1 49.71
NP vs P2 50.72
NP vs P3 52.87
NP vs P4 57.04
Ours
MC 23.79
NP vs P1 52.38
NP vs P2 52.78
NP vs P3 55.37
NP vs P4 58.62
about the social context and the psychological condi-
tions of subjects. Our future work will explore the
utilization of the remaining biosignals of BioVid, ei-
ther in unimodal or in a multimodal approach as well.
REFERENCES
Amirian, M., K
¨
achele, M., and Schwenker, F. (2016). Using
radial basis function neural networks for continuous
and discrete pain estimation from bio-physiological
signals. In Artificial Neural Networks in Pattern
Recognition, pages 269–284. Springer Verlag.
Bartley, E. J. and Fillingim, R. B. (2013). Sex differences
in pain: a brief review of clinical and experimental
findings. British journal of anaesthesia, 111(1):52–
58.
Chu, Y., Zhao, X., Han, J., and Su, Y. (2017). Physiological
Automatic Pain Intensity Estimation based on Electrocardiogram and Demographic Factors
161

signal-based method for measurement of pain inten-
sity. Frontiers in Neuroscience, 11(MAY):279.
Cordell, W. H., Keene, K. K., Giles, B. K., Jones, J. B.,
Jones, J. H., and Brizendine, E. J. (2002). The high
prevalence of pain in emergency medical care. Amer-
ican Journal of Emergency Medicine, 20(3):165–169.
Fariha, M. A. Z., Ikeura, R., Hayakawa, S., and Tsutsumi, S.
(2020). Analysis of Pan-Tompkins Algorithm Perfor-
mance with Noisy ECG Signals. Journal of Physics:
Conference Series, 1532(1):12022.
Gaskin, D. J. and Richard, P. (2012). The Economic Costs
of Pain in the United States. The Journal of Pain,
13(8):715–724.
Hadjistavropoulos, T. and Craig, K. D. (2002). A theoretical
framework for understanding self-report and observa-
tional measures of pain: A communications model.
Behaviour Research and Therapy, 40(5):551–570.
Hinduja, S., Canavan, S., and Kaur, G. (2020). Multi-
modal Fusion of Physiological Signals and Facial Ac-
tion Units for Pain Recognition. In Struc V., G.-F. F.,
editor, IEEE International Conference on Automatic
Face and Gesture Recognition, pages 577–581. Insti-
tute of Electrical and Electronics Engineers Inc.
K
¨
achele, M., Thiam, P., Amirian, M., Schwenker, F.,
and Palm, G. (2016). Methods for Person-Centered
Continuous Pain Intensity Assessment from Bio-
Physiological Channels. IEEE Journal on Selected
Topics in Signal Processing, 10(5):854–864.
Liu, F., Wei, S., Li, Y., Jiang, X., Zhang, Z., Zhang, L., and
Liu, C. (2017). The accuracy on the common Pan-
Tompkins based QRS detection methods through low-
quality electrocardiogram database. Journal of Medi-
cal Imaging and Health Informatics, 7(5):1039–1043.
Lopez-Martinez, D. and Picard, R. (2017). Multi-task neu-
ral networks for personalized pain recognition from
physiological signals. In International Conference on
Affective Computing and Intelligent Interaction Work-
shops and Demos, pages 181–184, San Antonio. Insti-
tute of Electrical and Electronics Engineers Inc.
Lopez-Martinez, D. and Picard, R. (2018). Continuous Pain
Intensity Estimation from Autonomic Signals with
Recurrent Neural Networks. In International Confer-
ence of the IEEE Engineering in Medicine and Biol-
ogy Society., volume 2018, pages 5624–5627.
Lynch, M. E. (2011). The need for a Canadian pain strategy.
Pain Research and Management, 16(2):77–80.
Mamontov, D., Polonskaia, I., Skorokhod, A., Semenkin,
E., Kessler, V., and Schwenker, F. (2019). Evo-
lutionary algorithms for the design of neural net-
work classifiers for the classification of pain intensity.
Multimodal Pattern Recognition of Social Signals in
Human-Computer-Interaction, 11377 LNAI:84–100.
Merskey, H., Albe-Fessard, D. G., Bonica, J. J., Carmen, A.,
Dubner, R., Kerr, F. W. L., and Pagni, C. A. (1979).
Editorial: The need of a taxonomy. Pain, 6(3):247–
252.
Pan, J. and Tompkins, W. J. (1985). A Real-Time QRS De-
tection Algorithm. IEEE Transactions on Biomedical
Engineering, BME-32(3):230–236.
Rohling, M. L., Binder, L. M., and Langhinrichsen-
Rohling, J. (1995). Money Matters: A Meta-
Analytic Review of the Association Between Finan-
cial Compensation and the Experience and Treatment
of Chronic Pain. Health Psychology, 14(6):537–547.
Stewart, G. and Panickar, A. (2013). Role of the sympa-
thetic nervous system in pain.
Subramaniam, S. D. and Dass, B. (2021). Automated Noci-
ceptive Pain Assessment Using Physiological Signals
and a Hybrid Deep Learning Network. IEEE Sensors
Journal, 21(3):3335–3343.
Thiam, P., Bellmann, P., Kestler, H. A., and Schwenker, F.
(2019). Exploring deep physiological models for no-
ciceptive pain recognition. Sensors, 19(20):4503.
Toomey, M. (2008). Gender differences in pain: does X =
Y? AANA journal, 76(5):355–359.
Walter, S., Gruss, S., Ehleiter, H., Tan, J., Traue, H. C.,
Crawcour, S., Werner, P., Al-Hamadi, A., Andrade,
A. O., and Da Silva, G. M. (2013). The biovid heat
pain database: Data for the advancement and system-
atic validation of an automated pain recognition. In
2013 IEEE International Conference on Cybernetics,
pages 128–131.
Wang, J., Wei, M., Zhang, L., Huang, G., Liang, Z., Li,
L., and Zhang, Z. (2020). An Autoencoder-based
Approach to Predict Subjective Pain Perception from
High-density Evoked EEG Potentials. In International
Conference of the IEEE Engineering in Medicine Bi-
ology Society, pages 1507–1511. Institute of Electrical
and Electronics Engineers Inc.
Werner, P., Al-Hamadi, A., Niese, R., Walter, S., Gruss,
S., and Traue, H. C. (2014). Automatic pain recog-
nition from video and biomedical signals. In Inter-
national Conference on Pattern Recognition, pages
4582–4587. Institute of Electrical and Electronics En-
gineers Inc.
Werner, P., Lopez-Martinez, D., Walter, S., Al-Hamadi, A.,
Gruss, S., and Picard, R. (2019). Automatic Recogni-
tion Methods Supporting Pain Assessment: A Survey.
IEEE Transactions on Affective Computing.
Yu, M., Sun, Y., Zhu, B., Zhu, L., Lin, Y., Tang, X., Guo,
Y., Sun, G., and Dong, M. (2020). Diverse frequency
band-based convolutional neural networks for tonic
cold pain assessment using EEG. Neurocomputing,
378:270–282.
Zhao, K., Li, Y., Wang, G., Pu, Y., and Lian, Y. (2021).
A robust QRS detection and accurate R-peak identifi-
cation algorithm for wearable ECG sensors. Science
China Information Sciences, 64(8):182401.
ICT4AWE 2022 - 8th International Conference on Information and Communication Technologies for Ageing Well and e-Health
162
