
Assessment of Parkinson’s Disease Severity based on Automatic
Analysis of Facial Expressions and Motor Activity of the Hands
Anastasia Moshkova
1
, Andrey Samorodov
1
, Ekaterina Ivanova
2
, Margarita Ershova
2
and Ekaterina Fedotova
2
1
Biomedical Engineering Department, Bauman Moscow State Technical University, Moscow, Russia
2
5-th Neurological Department, Research Center of Neurology, Moscow, Russia
Keywords: Parkinson’s Disease, Hypokinesia, Machine Learning, MDS-UPDRS, Facial Expressions, Hand Movement,
Disease Severity.
Abstract: Assessment of the severity of the disease is an important task in the study of Parkinson's disease. Using non-
contact methods for assessing the motor activity of patients, quantitative assessments of motor parameters
were obtained, including the assessment of facial expressions and the motor activity of the hands of patients
with PD. The study involved 18 patients with PD, whose facial expressions and the motor activity of the
hands assessed using the MDS-UPDRS scale by neurologist. In this paper, a regression model was
developed that allows to predict the total MDS-UPDRS scores for 3 hand movement exercises with R2
0.781 and RMSE 0.893 based on 5 features of motor activity. To predict the MDS-UPDRS scores, the
classification problem is also solved. The patient group was divided into 2 groups according to the severity
of the disease based on the fitting of a cut-off value, which is the median value of the MDS-UPDRS scores.
The feature space was reduced to 4 using PCA. The best classification result 95% was obtained using
logistic regression and support vector machine in a 5-fold cross-validation mode.
1 INTRODUCTION
Parkinson's disease is an incurable disease
characterized by progressive impairment of human
motor functions (Pal et al., 2013). In clinical
practice, the Movement Disorder Society-Unified
Parkinson's Disease Rating Scale (MDS-UPDRS)
Part III (Goetz et al., 2008) is used to assess the
severity of movement disorders in Parkinson's
disease. The MDS-UPDRS provides a specific set of
exercises to enable the neurologist to assess the
degree of movement impairment on a discrete scale
of 0 to 4 for each exercise.
The disadvantage of using the rating scale is its
subjectivity, since ratings vary between experts
(Espay et al., 2016), and the use of MDS-UPDRS
does not allow recording minor changes in
movement disorders (Ferraris et al., 2018), trained
medical personnel are required for examination the
patient and his presence in the clinic, which takes a
long time (Boka et al., 1994).
Thus, there is a need to objectify the assessment
of the disease. At the same time, the automation of
the assessment of the severity of the disease will
allow the use of an assessment tool without the
participation of a specialist, which will open up
additional possibilities of its application in the tasks
of telemedicine control, home use, and as a second
expert opinion. Currently, there are works devoted to
assessing the severity of PD, which are based on the
use of regression models on various human motor
activity data (Kaur et al., 2020; Nilashi et al., 2018;
Lin et al., 2017; Lee et al. al., 2019). Assesment of
the severity of the disease can also be presented as a
classification problem (Kaur et al., 2020, Mehta et
al., 2021; Maachi et al., 2021; Lu M. et al., 2021;
Ferraris C. et al., 2018), where the number of classes
corresponds to the number of discrete MDS-UPDRS
scores or the sample is divided into several classes
according to a threshold set by the author based on
MDS-UPDRS scores.
The data obtained in the analysis of facial
expressions and the motor activity of the hands
(MAH) are the one of the data more available and
reliably suitable for PD assessment. In previous
works (Moshkova et al., 2021; Moshkova et al.,
2020; Moshkova et al., 2021), devoted to the
322
Moshkova, A., Samorodov, A., Ivanova, E., Ershova, M. and Fedotova, E.
Assessment of Parkinson’s Disease Severity based on Automatic Analysis of Facial Expressions and Motor Activity of the Hands.
DOI: 10.5220/0010971200003123
In Proceedings of the 15th International Joint Conference on Biomedical Engineering Systems and Technologies (BIOSTEC 2022) - Volume 1: BIODEVICES, pages 322-327
ISBN: 978-989-758-552-4; ISSN: 2184-4305
Copyright
c
2022 by SCITEPRESS – Science and Technology Publications, Lda. All rights reserved

recognition of PD, high classification accuracy was
shown using MAH and facial expressions features
obtained by a contactless method. The problem of
the severity prediction of the disease is no less
important than the recognition of PD; therefore, the
purpose of this work is to study the possibility of
predicting MDS-UPDRS scores based on features
extracted during analysis of MAH and facial
expressions of patients with PD.
2 MATERIALS AND METHODS
2.1 Feature Space Formalization
In previous works devoted to the study of PD
(Moshkova et al., 2021; Moshkova et al., 2020;
Moshkova et al., 2021) the features of MAH and
facial expressions were formed. Facial expressions
features, in turn, is subdivided into parameters of
dynamic facial activity and static emotional
expressions assessing.
The features of MAH were obtained based on the
analysis of hand movement signals recorded using
the LeapMotion sensor when performing 3
movement exercises: finger tapping (FT), open/close
of the hand (OC), pronation/supination of the hand
(PS).
Facial activity features were obtained based on
the analysis of signals from action units (AU),
recorded during participants performed a series of
repeated mimic movements (
«Raise eyebrows»,
«Smile with effort»). Each of the mimic exercises is
characterized by AUs, which are activated during
exercise: AU04 when performing the
«Raise
eyebrows» exercise, AU12 and AU14 when
performing the
«Smile with effort» exercise.
Emotional expressions features characterize the
degree of expressiveness of facial expressions when
participants shows 6 basic emotions by imitating.
Facial activity and emotional expressions features
were obtained by processing 2D video images of a
face.
All in all, 11 kinematic parameters were
calculated for each signal of hands movement and
facial activity based on the significant parameters of
movement: frequency, speed in the opening phase
(beginning of movement), speed in the closing phase
(end of the movement), and amplitude.
The general vector of features of the patient
includes 72 features (33 features of MAH, 33
features of facial activity, and 6 features of
emotional expressions).
2.2 Database Collecting
The database of participants includes 18 PD patients
with stages 2 and 3 according to Hoehn & Yahr.
Information about participants is presented in Table
1. Patients data were collected at the Scientific
Center of Neurology. All participants signed
voluntary informed consent to participate in the
study. Each of the participants was assessed
according to the III part of the MDS-UPDRS scale,
namely, expert assessments were obtained on the
following points: 3.2 Facial Expression (FE), 3.4
Finger Tapping (FT), 3.5 Hand movements (OC),
3.6 Pronation-supination of the hand (PS).
FE was assessed on a scale from 0 to 4, which
characterizes the severity of the impairment of facial
expressions. FT, OC, PS were assessed for the right
and left hands separately from 0 to 4. As a result, the
average score for the right and left hands was taken
for each patient.
For the study, different scores combinations were
used, which can be predicted based on the prepared
vector of features:
• points assessment of facial expressions -
MDS-UPDRS FE;
• total scores of 3 hand movement exercises -
MDS-UPDRS FT+OC+PS;
• total scores of 3 hand movement exercises
and facial expressions - MDS-UPDRS
FE+FT+OC+PS.
Mean values and standard deviations in PD patients
group of the MDS-UPDRS scores are presented in
Table 1.
Table 1: PD participant’s information.
Number of participants 18
Average age of participants 65.3±10.0
MDS-UPDRS FE 1.61±0.99
MDS-UPDRS FT+OC+PS 4.11±2.11
MDS-UPDRS FE+FT+OC+PS 5.73±2.38
2.3 Predicting MDS-UPDRS Scores
2.3.1 Regression Model
The target or output variable in the dataset is one of
the MDS-UPDRS scores (FE, FT+OC+PS, or
FE+FT+OC+PS). The following regression models
were used to predict MDS-UPDRS scores: k-nearest
neighbors (k-NN), support vector machine (SVM),
random forest (RF), and linear regression.
Assessment of Parkinson’s Disease Severity based on Automatic Analysis of Facial Expressions and Motor Activity of the Hands
323

The prediction of the regression model is evaluated
by the following metrics:
• R-squared (R2): coefficient of determination;
• root mean square error (RMSE).
The evaluation of the regression models was carried
out in a 5-fold cross-validation mode. A greedy
algorithm was used to select the best combination of
features.
2.3.2 Classification
To solve the classification problem, the sample of 18
patients was divided according to the disease
severity based on the threshold value (median value)
(Table 2) into 2 groups (PD1 and PD2), where the
PD1 group includes patients with MDS-UPDRS
scores less than the median value, and the group
PD2 includes patients with MDS-UPDRS scores
greater than the median. The ratio of patients in the
PD1/PD2 groups is balanced. Groups PD1 and PD2
were formed for each MDS-UPDRS scores set: FE,
FT+OC+PS, and FE+FT+OC+PS.
Table 2: Thresholds and group's ratio.
MDS-UPDRS
FE+FT+OC+PS FT+OC+PS FE
Median 6.5 4.75 2
PD1/PD2 9/9 9/9 11/7
To solve the binary classification problem, 4
classifiers were trained: k-NN, SVM, RF, logistic
regression (LR) in the 5-fold cross-validation mode.
Classification was performed with 3 subsets of
MDS-UPDRS scores (FE, FT+OC+PS, or
FE+FT+OC+PS).
Patient data were standardized using the
StandartScaler method. Principal component
analysis (PCA) is applied to a dataset of 72 features
to solve multicollinearity problems in the dataset and
to reduce the dimension of the input feature space.
Then the reduced input features space was
introduced into the proposed classification model.
The hyperparameters were tuned using the
GridSearchCV method. Data processing,
implementation of classification and regression
models were carried out in the Python using built-in
machine learning libraries.
3 RESULTS
3.1 Predicting MDS-UPDRS Scores
based on Regression Model
The best result was obtained when predicting MDS-
UPDRS FT+OC+PS scores (Table 3).
Table 3: The best regression model.
Model
RandomForestRegressor(n_estimators=100,
max_features ='sqrt')
R2 0.781
RMSE 0.893
Features
number
5
The selected 5 features are presented in Table 4.
Table 4: Selected 5 features for assessment disease
severity based on a regression model.
№ Title Signification
1 AvgVclose_AU12
Average closing speed when
performing the «Smile with
effort
» exercise
2 VarVopen_AU12
Closing speed variation
when performing the «Smile
with effort
» exercise
3 AvgVclose_AU04
Average closing speed when
doing the «Raise eyebrows
»
exercise
4 DecV_PS
Speed decrement during
exercise PS
5 VarFrq_FT
Frequency variation during
FT exercise
Table 5 shows the Spearman correlation coefficient
(r) between values of the the selected 5 features and
different sets of MDS-UPDRS scores.
Table 5: Spearman correlation coefficients of 5 features
with MDS-UPDRS scores.
MDS-UPDRS
№ FE+FT+OC+PS FT+OC+PS FE
1 -0.65 -0.72 0.26
2 0.28 0.32 -0.23
3 -0.61 -0.68 0.06
4 -0.14 0.13 -0.3
5 0.38 0.48 -0.29
The highest correlation coefficient r=-0.72 was
found between the AvgVclose_AU12 parameter and
the MDS-UPDRS FT + OC + PS score.
RMHM 2022 - Special Session on Remote Management and Health Monitoring
324
3.2 Binary Classification of PD
Severity
The best classifications accuracy were obtained
using the 4 principal components of the PCA. The
results of training classifiers in the 5-fold cross-
validation mode are presented in Table 6.
Table 6: Results of the binary classification of PD
severity.
PD1 vs. PD2
FE+FT+OC+PS FT+OC+PS FE
RF 88 % 83 % 53 %
k-NN 78 % 85 % 72 %
SVM 95 % 90 % 58 %
LR 95 % 83 % 62 %
The highest result 95% was obtained using the SVM
classifier with a linear kernel and LR with default
hyperparameters.
4 DISCUSSION
The assessment of the disease severity was carried
out by many authors based on data of various PD
manifestations obtained using both wearable sensors
and non-contact methods. The results of these works
shows the prospects for the further use of the
developed methods for predicting MDS-UPDRS
scores. The authors use different patient's data
sources to correlate with MDS-UPDRS scores:
voice, gait, hand movement, and other exercises. In
(Kaur et al., 2020), an ensemble of models is
presented that makes it possible to predict the MDS-
UPDRS score with an accuracy of 99.6% based on
the features extracted from the voice recording of 42
PD patients. The regression model proposed by the
authors (Lin et al., 2017) predicts the MDS-UPDRS
scores of 15 patients with a high R2 = 0.99 score
based on FT exercise features. The authors (Lee et
al., 2019) report that the cumulative MDS-UPDRS
score for bradykinesia for 8 patients, predicted by
linear regression, coincides (r=0.86) with the clinical
scores in the cross-validation mode. In the work
(Maachi et al., 2020), the authors achieved an
accuracy of 85.3% in predicting the severity of
Parkinson's disease (5 classes) by analyzing the gait
of 93 patients using a 1D convolutional neural
network.
The use of one or another method for assessing
the PD severity can often be limited by the
conditions in which it will be applied. Therefore,
one of the important components of the method used
is its applicability at home, for telemedicine control
using affordable and inexpensive equipment
(Rimskaya et al., 2021; Anishchenko et al., 2019).
In our work, we showed the possibility of using a
non-contact method for assessing the features of
facial expressions and MAH in the prediction task of
MDS-UPDRS scores by developed a regression
model and in the binary classification task of the PD
severity. In the works (Maachi et al., 2020; Ferraris
et al., 2018), the authors present the results of PD
patients classification into 3 or 4 classes, divided
according to MDS-UPDRS scores. However, in our
work, we used the division into 2 classes due to
small size of dataset.
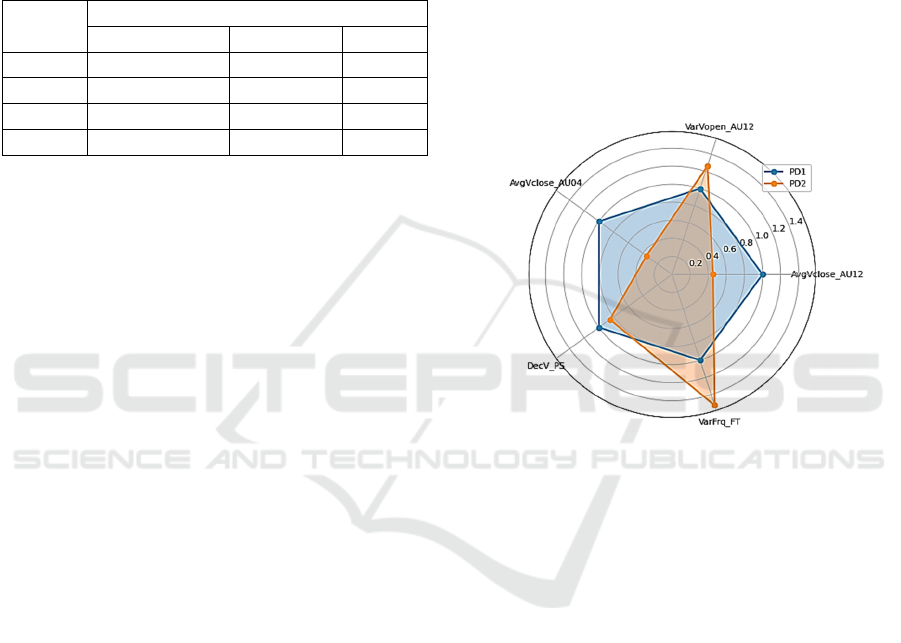
Figure 1: Diagram of the ratio of features of MAH and
facial expressions for 2 groups of patients (PD1 and PD2)
divided by the median value of MDS-UPDRS
FE+FT+OC+PS scores.
In Figure 1, we plot a diagram of the ratio of 5
features that are most significant for predicting
scores with regression model. It can be noted, that
there are visible differences in the dynamics of
disease progression with increasing MDS-UPDRS
scores. The parameters are presented in the diagram
for 2 groups, which were divided by the threshold
value of the MDS-UPDRS FE+FT+OC+PS scores.
Using the Mann-Whitney test for each of the 5
features the p-value was calculated. The parameters
AvgVclose_AU04 (p=0.001) and AvgVclose_AU12
(p=0.004), characterizing the speed of the exercises
«
Raise eyebrows» and
«
Smile with effort»,
respectively, in the PD2 group have a lower value
than in the PD1 group of patients with lower MDS-
UPDRS scores. The value of the parameters
VarFrq_FT (p=0.047), VarVopen_AU12 (p=0.189),
on the contrary, is lower in the PD1 group than in
the PD2 group, which indicates a greater rhythm
disturbance in the group of patients with high MDS-
Assessment of Parkinson’s Disease Severity based on Automatic Analysis of Facial Expressions and Motor Activity of the Hands
325

UPDRS scores. There is a slight difference in the
DecV rate decrement value between groups
(p=0.213).
5 CONCLUSIONS
The method of automated assessment of the PD
severity is based on the use of features calculated
based on analysis of special motor exersice aimed at
assessing facial expressions and the motor activity of
the hands. With machine learning methods, a
regression model based on random forest was
developed. Using a greedy algorithm, a set of 5
features was determined, including features of both
the motor activity of the hands and facial
expressions, to achieve the best regression result.
The best result was obtained for the assessment of
the total score of the motor activity of the hands
according to MDS-UPDRS in the 5-fold cross-
validation mode; the coefficient of determination R2
of the regression model 0.781, RMSE error 0.893.
Dividing the PD group of patients into 2 classes
according to the median value of the total MDS-
UPDRS scores of the motor activity of the hands and
facial expressions for binary classification (PD1 vs.
PD2) made it possible to achieve a classification
accuracy of 95% using SVM or LR by using 4
principle components of the entire feature space.
The obtained result shows the applicability of the
developed method for assessing the PD severity,
both with regression and classification methods.
Using the classification method, high results were
obtained, but there are limitations in prediction of
scores, which are determined by the number of
classes. To improve the results, it is necessary to
expand the existing patient database, which will
make it possible to carry out a multi-class
classification. Moreover, we plan to supplement the
feature space by analysing other manifestations of
Parkinson's disease.
REFERENCES
Anishchenko L. et al. (2019). "Non-contact Sleep
Disorders Detection Framework for Smart Home,"
2019 PhotonIcs & Electromagnetics Research
Symposium - Spring (PIERS-Spring), pp. 3553-3557.
Boka G, Anglade P, Wallach D, Javoy-Agid F, Agid Y
and Hirsch E (1994b) Immunocytochemical analysis
of tumor necrosis factor and its receptors in
parkinson’s disease. Neuroscience letters 172(1):151–
154.
Espay, A.J.; Bonato, P.; Nahab, F.B.; Maetzler, W.; Dean,
J.M.; Klucken, J.; Eskofier, B.M.; Merola, A.; Horak,
F.;Lang, A.E.; et al. (2016) Movement Disorders
Society Task Force on Technology. Technology in
Parkinson’s disease: Challenges and opportunities.
Mov. Disord. 31, 1272–1282.
Ferraris C., Nerino R., Chimienti A., Pettiti G., Cau N.,
Cimolin V., Azzaro C., Albani G., Priano L. and
Mauro A. (2018) A self-managed system for
automated assessment of UPDRS upper limb tasks in
Parkinson’s disease. Sensors (Basel) 18, E3523.
Goetz, C.G.; Tilley, B.C.; Shaftman, S.R.; Stebbins, G.T.;
Fahn, S.;Martinez-Martin, P.; Poewe,W.; Sampaio, C.;
Stern, M.B. and Dodel, R. (2008). Movement Disorder
Society-sponsored revision of the Unified Parkinson’s
Disease Rating Scale (MDS-UPDRS): Scale
presentation and clinimetric testing results. Mov.
Disord. 23, 2129–2170.
Kaur, H., Malhi, A.K. and Pannu, H.S. (2020). Machine
learning ensemble for neurological disorders. Neural
Comput & Applic 32, 12697–12714.
Lee W. L., Sinclair N. C., Jones M., Tan J. L., Elizabeth
L., Peppard P.R., McDermott H. J. and Perera T.
(2019). Objective evaluation of bradykinesia in
Parkinson’s disease using an inexpensive marker-less
motion tracking system, Physiol. Meas. vol. 40, no. 1,
pp. 014004.
Lin Z., Dai H., Xiong Y., Xia X., Horng S.-J. (2017).
Quantification assessment of bradykinesia in
Parkinson's disease based on a wearable device. Annu
Int Conf IEEE Eng Med Biol Soc. , pp. 803–806.
Lu M., Zhao Q., Poston K. L. , Sullivan E. V. ,
Pfefferbaum A., Shahid M., Katz M., Kouhsari L. M.,
Schulman K., Milstein A., Niebles J. C., Henderson V.
W. ,Fei-Fei L., Pohl K. M., Adeli E. (2021).
Quantifying Parkinson’s disease motor severity under
uncertainty using MDS-UPDRS videos, Medical
Image Analysis, V. 73.
Maachi I. El,. Bilodeau G.-A and W. Bouachir (2020)
‘‘Deep 1D-convnet for accurate Parkinson disease
detection and severity prediction from gait,’’ Expert
Syst. Appl., vol. 143, Art. no. 113075.
Moshkova A., Samorodov A., Voinova N., Volkov A.,
Ivanova E. and Fedotova E. (2021). "Studying Facial
Activity in Parkinson's Disease Patients Using an
Automated Method and Video Recording," 2021 28th
Conference of Open Innovations Association
(FRUCT), pp. 301-308.
Moshkova A., Samorodov A., Voinova N., Volkov A.,
Ivanova E. and Fedotova E. (2020). "Facial Emotional
Expression Assessment in Parkinson’s Disease by
Automated Algorithm Based on Action Units," 2020
27th Conference of Open Innovations Association
(FRUCT), pp. 172-178.
Moshkova A. A., Samorodov A. V., Voinova N. A.,
Ivanova E. O. and Fedotova E. Y. (2021). "Hand
Movement Kinematic Parameters Assessment for
Parkinson’s Disease Patients," 2021 IEEE Conference
of Russian Young Researchers in Electrical and
Electronic Engineering (ElConRus), pp. 2836-2841.
RMHM 2022 - Special Session on Remote Management and Health Monitoring
326

Mehta D., Asif U., Hao T., Bilal E., von Cavallar S.,
Harrer S. and Rogers J. (2021). Towards Automated
and Marker-less Parkinson Disease Assessment:
Predicting UPDRS Scores using Sit-stand videos,
Proceedings of the IEEE/CVF Conference on
Computer Vision and Pattern Recognition (CVPR)
Workshops, 2021, pp. 3841-3849
Nilashi M., Ibrahim O., Ahmadi H., Shahmoradi L. and
Farahmand M. (2018). A hybrid intelligent system for
the prediction of Parkinson’s disease progression
using machine learning techniques, Biocybern Biomed
Eng, 38 (1), pp. 1-15.
Pal. G. and Goetz, C.G. (2013). Assessing bradykinesia in
Parkinsonian Disorders. Front. Neurol. 4, 54.
Rimskaya E. N., Apollonova I. A., Kudrin K. G.,
Otstavnov S. S. and Reshetov I. V. (2021).
"Development Of A Mobile Application For An
Independent Express Assessment Of Pigmented Skin
Lesions," 2021 IEEE Ural-Siberian Conference on
Computational Technologies in Cognitive Science,
Genomics and Biomedicine (CSGB), pp. 270-273.
Assessment of Parkinson’s Disease Severity based on Automatic Analysis of Facial Expressions and Motor Activity of the Hands
327
