
COVID-19 Treatment Process Identification: A Case Study in
Russian Hospital for Cardiology
Liubov Elkhovskaya
1a
, Sergey Kovalchuk
1,2 b
, Ilya Potapov
2c
and Dmitrii Ovchinnikov
2d
1
ITMO University, 49 Kronverksky Prospect, 197101 St. Petersburg, Russia
2
Almazov National Medical Research Centre, 2 Akkuratova Street, 197341 St. Petersburg, Russia
Keywords: Process Mining, Process Discovery, Clinical Pathway, COVID-19, Healthcare.
Abstract: The COVID-19 pandemic has caused significant strain on medical facilities. The race between global
pandemic spread and medical practices progression produced a plethora of clinical guidelines. In Russia, more
than ten official versions of such guidelines have been developed since the start of the pandemic. Thus,
treatment processes have undergone several changes. Additionally, organizational schemes of patient care
delivery were affected by the availability of hospital resources. In our study, we identified the characteristics
of COVID-19 treatment processes at a large multidisciplinary hospital, that was adapted for treating COVID-
19 several times during disease outbreaks. For this task, we used a process mining technique. Given the
peculiarities of the hospital information system, we developed an approach for analysing treatment flow. Then,
we compared clinical pathways in different pandemic periods and verified compliance with the official
guidelines.
1 INTRODUCTION
The new coronavirus (SARS-CoV-2) infection
emerged in the Chinese province of Hubei at the end
of 2019. Since then, it has spread throughout the
world and has led to ongoing pandemic. COVID-19,
a potentially severe respiratory disease caused by the
coronavirus, imposed harsh conditions on all
countries’ healthcare systems. The growing spread of
coronavirus has caused significant strain on medical
facilities. Most of them were prepared poorly for
increased patient flows: hospitals lacked sufficient
bed capacity, medications, and staff resources. Thus,
World Health Organization (WHO) developed
guidance
1
on treating
COVID-19
to provide clinicians
with an efficient and safe patient care strategy. Based
on these recommendations, many governments
proposed their own guidelines to support healthcare
systems according to the current situation within a
country.
In Russia over more than 1,5 years of fighting
COVID-19, The Ministry of Health has developed
a
https://orcid.org/0000-0002-3121-8577
b
https://orcid.org/0000-0001-8828-4615
c
https://orcid.org/0000-0003-1756-6951
d
https://orcid.org/0000-0001-9430-7561
more than ten versions of clinical practice guidelines
2
for COVID-19 prevention, diagnosis, and treatment.
So, healthcare processes were changed several times
during the pandemic. Availability of hospital
resources and morbidity “waves” (spikes in cases)
also affected the organizational schemes of patient
care delivery. Many medical facilities changed their
specialty and were adapted, allocating some or all of
their bed capacity,
for treating COVID-19
. Almazov
National Medical Research Centre (Almazov
NMRC)
3
, a major scientific contributor and
healthcare provider specialized in cardiology in
Russia, was no exception. It provided resources
(beds, staff, etc.) several times when morbidity
reached its peaks in Saint Petersburg, where the
pandemic situation was one of the most intense.
Discovery of clinical pathways or treatment
processes aims at indicating current as well as best
clinical practices. A better understanding of real-life
clinical pathways through process mining can
contribute to care and data quality assurance by
analysing information system peculiarities, identifying
1
www.who.int/emergencies/diseases/novel-coronavirus-
2019/technical-guidance/patient-management
2
minzdrav.gov.ru/ministry/med_covid19 (in Russian)
3
www.almazovcentre.ru/?lang=en
Elkhovskaya, L., Kovalchuk, S., Potapov, I. and Ovchinnikov, D.
COVID-19 Treatment Process Identification: A Case Study in Russian Hospital for Cardiology.
DOI: 10.5220/0010970400003123
In Proceedings of the 15th International Joint Conference on Biomedical Engineering Systems and Technologies (BIOSTEC 2022) - Volume 5: HEALTHINF, pages 755-765
ISBN: 978-989-758-552-4; ISSN: 2184-4305
Copyright
c
2022 by SCITEPRESS – Science and Technology Publications, Lda. All rights reserved
755

unmet needs, and improving patient care and
outcomes. In our study, we identified COVID-19
treatment processes in Russian hospital for cardiology
during different pandemic periods using a process
mining technique. Also, we aimed to see how clinical
guidelines that were developed gradually and “bottom-
up” (from local facilities practices to global ones),
affected or were influenced by best practices. Let us
first familiarize a reader with process mining in brief.
2 PROCESS MINING
Process Mining is an emerging discipline adopting a
data-driven approach and a classical model-based
process analysis. It has been actively developing
since there is still a demand for better insight into
what is happening at an institution. Process mining is
a promising approach to reveal and analyse the real
processes existing in all companies today. There are
three types of process mining: process discovery,
conformance checking, and process enhancement
(W. van der Aalst, 2016). With discovery algorithms,
one can automatically obtain a (business) process
model from routinely recorded data. This type of
process mining is a research topic of most interest
(Garcia et al., 2019). The results of process discovery
techniques can be used further in conformance
checking and enhancement. A priori process model
(discovered from the data or elaborated “by hand”) is
evaluated on its compliance with data by
conformance checking techniques, and its
enhancement can be proposed after an analysis of
process performance measures. In this study, we
perfrom analysis using process discovery techniques.
It is necessary to provide basic definitions and a
general view of process discovery. Every process-
aware information system that records run-time
behavior has an event log. An event log is a file that
contains information about process execution. Each
record is an event with associated data: timestamp of
its start and completion, an activity and resource that
executes this activity, and a process case id (instance)
the record belongs to. These are the minimal items for
compiling a log. However, if activities are considered
to be atomic, i.e., have no duration, the last item is
needed only for defining the order of them and can be
skipped if we a priori know data is stored according
to a timeline. We group an ordered set of events
containing only activity names into cases, that
represent single process runs. This “flat” event log is
used as an input for process mining in our discovery
algorithm. While an event log is an input, the
algorithm’s output is a (business) process model, or a
process map. In our case, a process model represents
a formal graphical description of the actual process
flow, i.e., the precedence of events, where nodes are
activities and edges are ordered relationships between
them.
As we briefly introduced process mining, we
further provide a literature review on the problem we
concern and how data and process mining techniques
address it.
3 RELATED WORKS
Processes in the healthcare sector are examples of
highly varying and distributed processes since they
are ad-hoc and healthcare information systems
usually are not process-aware (Batista & Solanas,
2019). That is why healthcare is the most researched
application domain of process discovery techniques
(Erdogan & Tarhan, 2018; Garcia et al., 2019). For
example, clinical pathways were derived from
different clusters of patient flow in facility
departments using a genetic algorithm (Funkner et al.,
2017). In study (Baker et al., 2017), the authors
pointed out that only little percentage of patients
completed the planned six cycles of chemotherapy
without unplanned hospital contacts. Information
extracted by the process mining pipeline can be also
used in prognosis, e.g., to estimate patient recovery
time (Kempa-Liehr et al., 2020).
During the review of existing studies, we figured
out that only a few works dedicated to process mining
application in COVID-19 case has been published.
The most of studies share experience in the COVID-
19 management, where retrospective data was
analysed and some conclusions about resources and
treatment process were made. Such works like
(Demirhan, 2020) are undoubtedly important in the
best clinical practices sharing, and the next researches
should use data driven approaches for better
analysing real-life clinical pathways. In study (Meng
et al., 2020), the authors designed a clinical pathway
for pre-operative COVID-19 screening in traumatic
fracture patients and assessed surgery waiting times.
Safety of medical activities were assured at the cost
of increased surgery delays by 2-4 days. The COVID
pandemic effects on waiting times of diagnosis and
treatment of nasopharyngeal carcinoma were also
studied in (Yang et al., 2020). Another retrospective
study (Thai et al., 2020) investigated factors, that
influenced length of stay (LoS) in Vietnam hospital
during this second phase of the COVID-19 pandemic.
Age group, region of residence and source of
infection were demonstrated to be associated with
COVID-ex 2022 - Special Session on "COVID-19 epidemic data mining and EXploration"
756
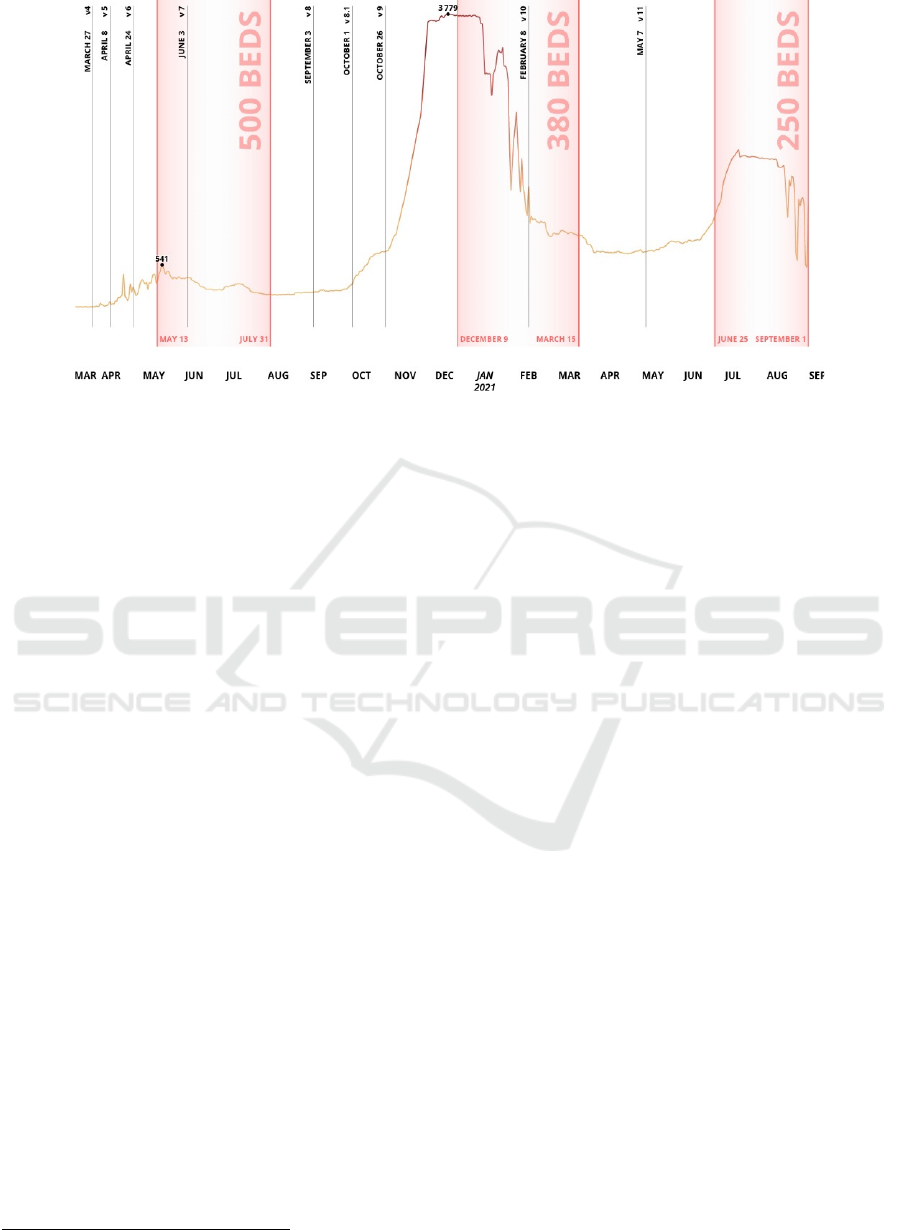
Figure 1: Bed arrangement periods (red areas) and number of infection cases in Saint Petersburg. Clinical guidelines versions
are shown in verticals.
longer hospital stay. The most interesting fact here is
that the median duration of hospital stay in Vietnam
and China was longer than in the United States and
several European countries. This can be explained by
different process organization structures. Process-
oriented data science techniques could study all the
direct and indirect problems mentioned above: process
model elaborating or discovery and its conformance
checking, LoS assessment, bottleneck identification,
etc. However, it requires process-aware information
system. Current lack of relevant studies may be caused
by lack of data on COVID-19 treatment process.
A work directly related to our study was done in
(Pegoraro et al., 2021). The authors reconstructed a
treatment model for COVID patients in intensive care
unit using data from the Uniklinik Aachen hospital
covering two first waves between February 2020 and
December 2020. Their preliminary results are
essential: besides the revealed structure and main
flow of the process, the authors calculated the rate of
utilization of ventilation machines and average case
duration with respect to different waves. Such
operational knowledge is vital in a case of resource
constraints and may help hospital managers to
efficiently allocate them.
4 CASE STUDY
In this section, we describe our experiments on
process discovery from not process-aware hospital
information system (HIS). Our colleagues from
1
Data from yandex.ru/covid19/stat
Almazov National Medical Research Centre provided
us anonymized database with patient electronic health
records (EHR) covering COVID-19 treatment cases
in their facility. Almazov Centre arranged pandemic
patient beds three times when patient inflows were
drastically increased during disease waves
1
(Fig. 1).
As it turns out, treatment processes in different
pandemic periods were not the same, since clinicians
gained more experience in disease management and
new government recommendations were stated.
Below we describe data and its issues, how we
addressed the challenges to prepare an event log, a
tool we used to discover a process model, and what
insights we got from results obtained.
4.1 Data Description
We had data on COVID-19 treatment at Almazov
NMRC for different periods, during its “routine” and
“emergency mode”, from March 2020 to June 2021.
Unfortunately, the data covered only two waves in
May 2020 and in December 2020. The dataset is a
series of records from EHR. One record contains infor-
mation on patient id, event description and associated
EHR section name, event id, timestamp, specialist
name and type, department, record status, and semi-
structured text, which is, e.g., anamnesis in natural
language or supplementary system information.
Patients included in the dataset had PCR-confirmed or
not PCR-confirmed COVID-19 diagnosis (U07.1 or
U07.2 ICD-10 codes, respectively). Table 1 presents
some statistics on the dataset we had.
COVID-19 Treatment Process Identification: A Case Study in Russian Hospital for Cardiology
757

As mentioned, the HIS is not process-aware: it
contains a collection of fragmented medical records
from patient history. However, the data can be
transformed to an event log by resolving the problems
that might be encountered. We describe event log
issues and its remedy in the following subsection.
4.2 Event Log Preparation
Here, we outline steps we performed for event log
creation from raw data source following event log
imperfection patterns (Suriadi et al., 2017).
Preliminary data pre-processing included deletion of
records with not realized events having status not
completed, can-celled, no-show, etc. This pre-step
resulted in 9,790,199 records.
Form-based Event Capture. In our case, it is a
common pattern since the data is a set of records from
EHRs. When users (clinicians, nurses, etc.) save
electronic-based forms by clicking ‘Save’ button, they
trigger the recording of the data captured by the form
with the same timestamp. The order of activities within
the form is flatten. One of the Almazov Centre’s HIS
feature is possibility to update electronic form in any
time, which additionally causes this undesirable side
effect. So, we restored date and time from semi-
structured texts where it was explicitly associated with
corresponding event (record).
Table 1: Dataset summary.
Attribute Num. of
unique
Example (if applicable)
Patient ID 3,313
Event ID 10,655,223
Event
description
2,052 First appointment with a
cardiologist
In-hospital transfer
SARS-CoV-2 IgG
antibodies test
EHR
Section
587 Patient complaints
Hospital diagnosis
Thoracic computed
tomograph
y
S
p
ecialist 2,201
Specialist
Type
178 Cardiologist
Infectiologist
Nurse
Department 248 Laboratory
Infectious disease ward
Cardiovascular sur
g
er
y
unit
Status 9 Completed
Cancelled
Transferre
d
2
github.com/Siella/ProFIT
Distorted Label. As seen from Table 1, Event
description column has more than 2,000 unique
entities, which can spoil discovery of a main process.
A plethora of labs and tests causes such diversity.
Moreover, typo or different spelling exacerbates the
problem. So, we decided to use EHR Section column
as an event attribute since it has a higher level of
abstraction but enough information to understand
actions taken. Here, EHR Section is a “category” for
events. For example, “Biomaterial sampling” (EHR
Section) covers test types, which refer to Event
description attribute.
Collateral Events. It is a case when multiple events
essentially refer to one particular process step. We
partially resolved this problem in previous step, but it
also could be done within EHR Section level. We
aggregated high-level events by case (patient id) and
timestamp, since some of them were fragmented in the
system because of different supplementary informa-
tion. We thus had a dataset with 1,035,118 entries.
Homonymous Label. The repeated activities,
which actually have different meanings, are grouped
into one leading to “overloaded” nodes in the model.
Transferring to a higher level of abstraction caused
such problem. For example, ‘Biomaterial sampling’
or ‘Test results view’ incorporates a range of tests. In
this regard, we preserved only events on a lower level,
which are explicitly associated with COVID-19
treatment within tests and nursing. Events
corresponding results viewing and patient monitoring
routine additionally were aggregated by date but not
timestamp as previously.
After these steps, we got an event log where
process case is defined by patient id. The final data
sorted by a timestamp and event id (to maintain
system recording order) contained 307,610 entries.
Next, we divided the log into periods of disease
growths and declines, which correspond to
restructured and routine work of the hospital,
respectively. It is important to note that we did not
exclude incomplete cases, since we had enough
instances to capture the main paths. The reasons for
this decision are two-fold: (1) we cannot identify
clearly whether a case is complete or not; (2) we want
to show the ability of the tool to recover the main
process execution from a “slice” of data.
4.3 Process Discovery
We use the ideas of Fuzzy Miner (Günther & van der
Aalst, 2007) to develop a tool
2
for log analysis as a
Python package. The reasons for the algorithm choice
are two-fold: (i) the algorithm is suitable for
COVID-ex 2022 - Special Session on "COVID-19 epidemic data mining and EXploration"
758

unstructured and complex processes, which exist in
healthcare, due to con-structing a model at different
levels of details; (ii) a directly-follows graph (DFG)
as an algorithm output permits cycles, which are
crucial in a concept of meta-states (Elkhovskaya &
Kovalchuk, 2021), despite the DFG limitations (W.
M. P. van der Aalst, 2019). In healthcare, a cyclic
behaviour of the process may represent a routine
complex of procedures or repeated medical events,
i.e., a patient is at some treatment stage, or a meta-
state. We assume a cycle in the model to be a meta-
state if the estimated probability of the repeating
behaviour in the log exceeds the specified threshold.
We did not use this feature in the current study, but it
is one of the possible directions of a future work.
The main idea of frequency-based miners is to
find the most probable events and precedence
relationships over them. Here, the fundamental metric
is a significance that can be determined for event
classes (i.e., activities) and binary precedence
relations over them (i.e., transitions). Significance is
the absolute or case frequency of activities or
transitions that are occurred in the event flow. We
decide which elements to remain by evaluating their
significance and filtering them: more frequently
observed events and transitions are deemed more
significant and therefore included in the model.
Fuzzy logic does not guarantee a reachable graph
which is desired to see the complete behaviours of
process traces. So, we modify model construction by
performing the depth-first search to check whether
each node of the DFG is a descendant of the initial
state and a predecessor of the terminal state. If the
model does not match these conditions, we add edges
with respect to their significance to the model until
we get a reachable graph. This way, we overcome the
possibility of discovering an unsound model (without
the option to complete the process).
Within the used visual notation, the green vertex
(“start”) indicates the beginning of the process and
shows the total number of cases presenting in the log,
and the red vertex (“end”) is related to a terminal
state. The graph’s internal vertices and edges show
the absolute frequencies of events and transitions,
respectively: more value, darker or thicker element.
5 RESULTS
In this section, all process maps shown are obtained
by the tool described previously. They were adjusted
manually with activity and transition rates of 70% and
0%, respectively, which mean that only activities and
transitions with significance more than or equal to 0.3
and 1.0 are included in the model. In other words, we
aim to see only the main paths with some event
variations. Below we present a clinicians’ opinion
and interpretation of the results we obtained.
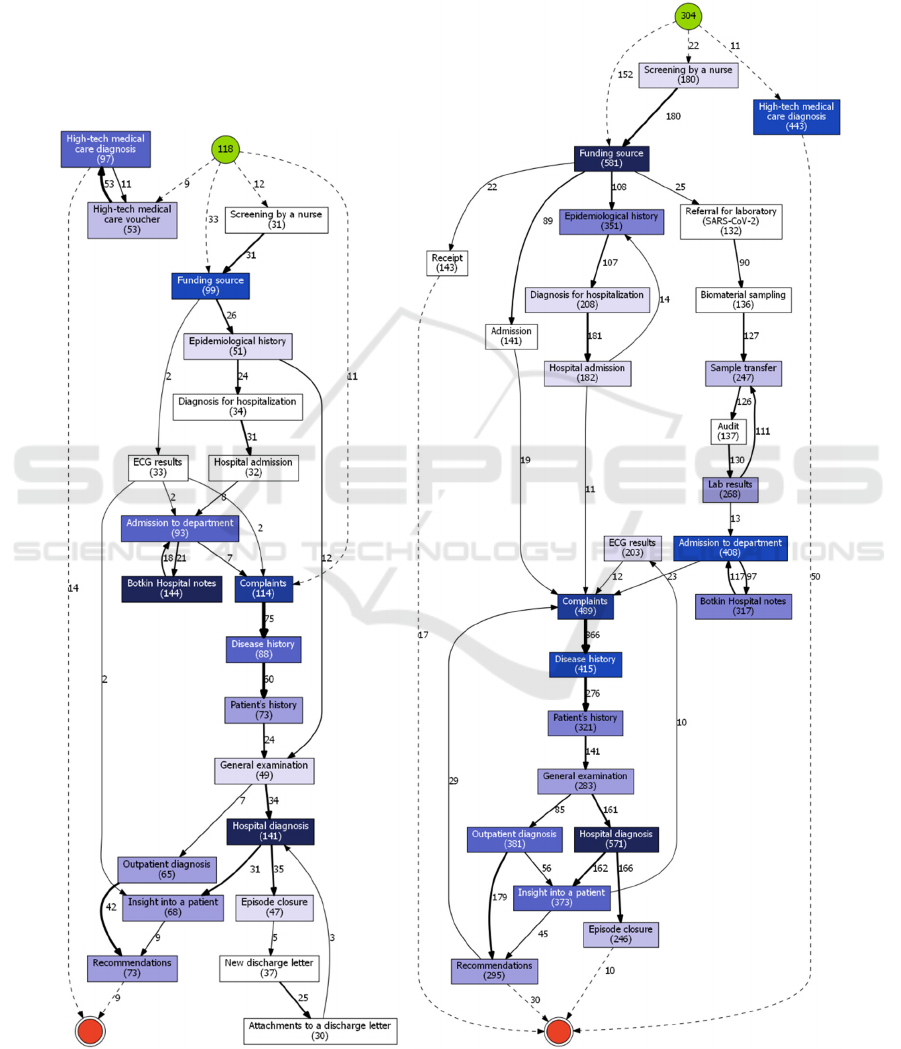
5.1 Non-COVID (“routine”) Mode
The difference in sizes of process models
immediately catches eye. The models of hospital’s
normal mode (Fig. 2) are smaller than clinical
pathways during adaptation to COVID-19 treatment
(Fig. 3-4). In addition, from these graphs, one can see
the increased number of patient inflows in the
pandemic waves.
It is very natural, that patients admitted for
COVID-19 treatment follow a far more elaborate
path. Curiously enough, these patients, in fact, have
far more similar (or uniform, even) treatment course
in general, in comparison to the patients, who were
treated for any other condition at Almazov Centre,
when they presented with COVID-19 symptoms and
had to undergo treatment for that too. Since these
“any other condition” type of patients have different
diagnoses that should be treated differently, it is only
natural, that they have less in common in terms of
clinical pathways.
5.2 COVID-19 (“emergency”) Mode
The processes identified in the periods of infection
cases declining (Fig. 2) are pretty like, apart from the
fact that number of patients increased after the first
wave. So, analysis of treatment processes during
COVID-19 outbreaks is of greater interest. As one
can see, patients were initially screened by a nurse
and after that admitted to the hospital. Next,
paperwork was followed by the first examination by
a doctor. Here, medical staff gathered information
about patients and evaluated their health state. One of
the mandatory steps in COVID-19 diagnostics and
treatment are PCR or SARS-CoV-2 antibody tests
and electrocardiogram (ECG), which completely
meet the official recommendations. The fact that
ECG appeared in almost all cases is remarkable. The
ECG is recommended in all versions of federal
clinical practice guidelines, because it is not only a
part of standard cardiological screening test, but also
an important tool of COVID-19 treatment’s adverse
effects prevention. Any viral infection or pneumonia
can increase the risk of development abnormal heart
rhythms and acute coronary syndrome, which can
impact the prognosis very severely, if not detected in
a timely manner. Moreover, some types of
medication, used for treatment of patients with
COVID-19 Treatment Process Identification: A Case Study in Russian Hospital for Cardiology
759
COVID-19, are known to cause cardiac
cardiotoxicity, which can be detected by screening for
QT interval prolongation in a series of ECGs. “Botkin
Hospital notes”, which are present in both periods, is
a historical name for thermometry records and other
nursing care events.
Some important differences between the first and
the second “emergency mode” periods should be
noted (Fig. 3-4).
Firstly, there are three additional events in the
second period: Morse Fall Scale risk assessment,
thromboembolic complication risk assessment, and
Figure 2: Clinical pathways for 2020/03/01-2020/05/12 (left) and 2020/08/01-2020/12/08 (right).
COVID-ex 2022 - Special Session on "COVID-19 epidemic data mining and EXploration"
760
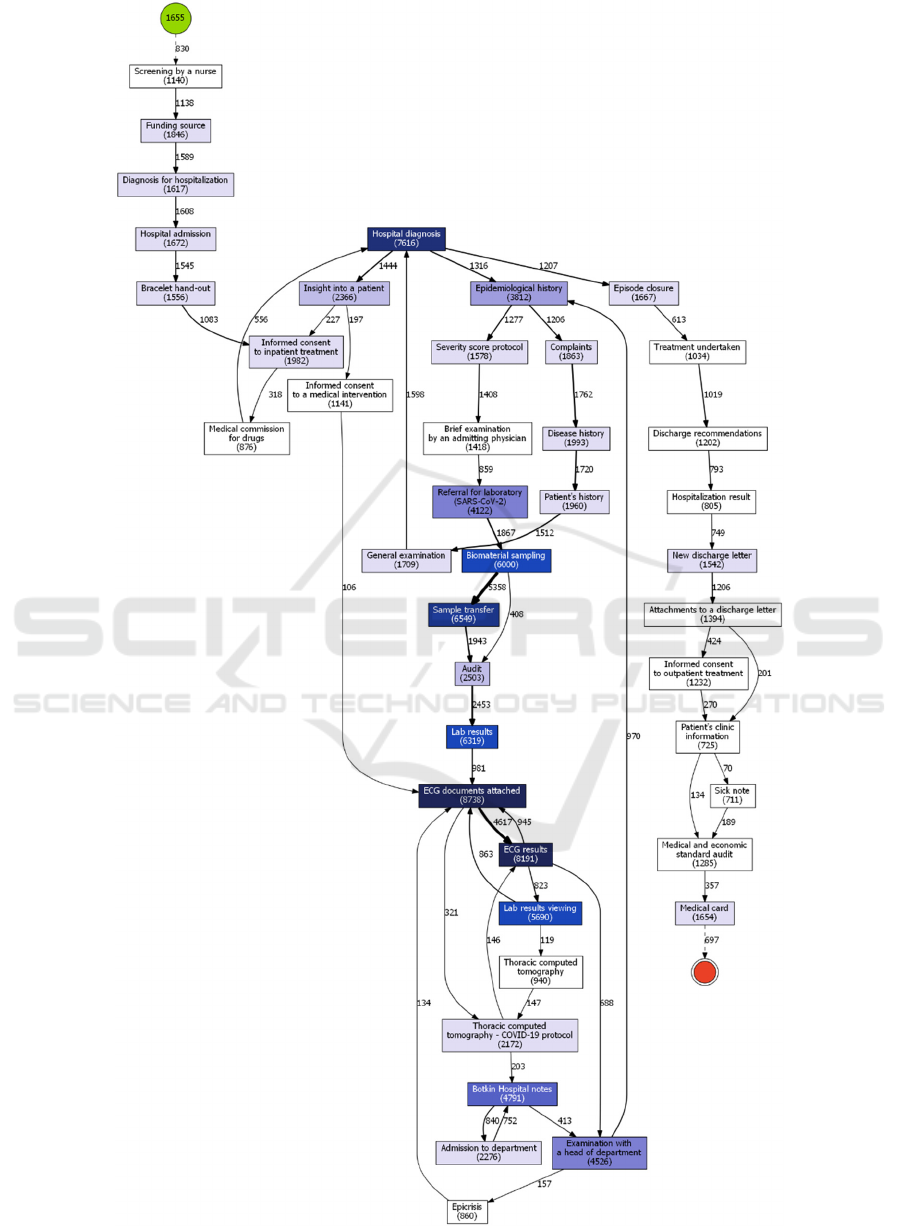
Figure 3: Clinical pathway for 2020/05/13-2020/07/31 (1
st
wave).
COVID-19 Treatment Process Identification: A Case Study in Russian Hospital for Cardiology
761
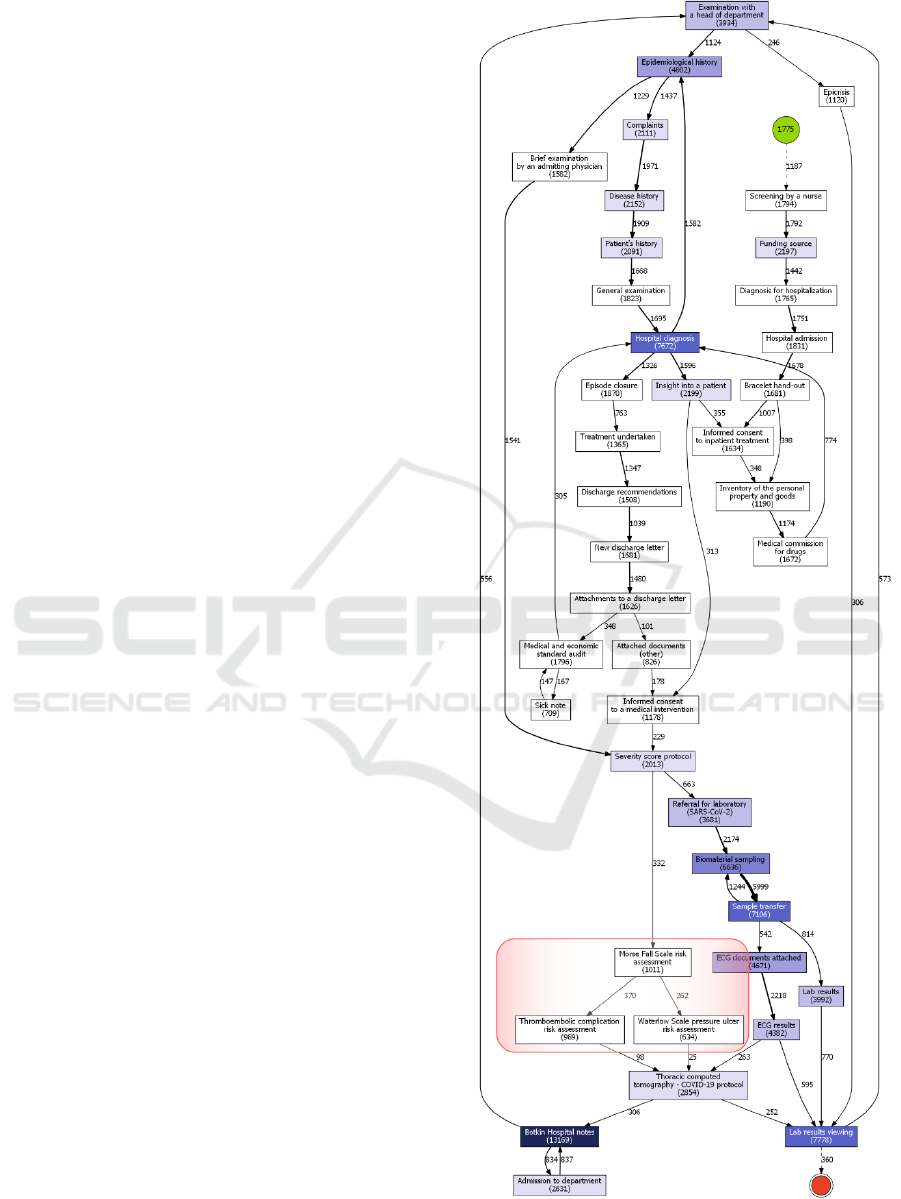
Waterloo pressure ulcer risk assessment. These
assessments were introduced by the federal control
institutions between the first COVID-19 wave and the
second one, which explains their absence during the
first COVID-19 period; but if we compare second
COVID-19 period with periods just right before and
after it, it is clear that these assessments were a far
more common thing in COVID-19 treatment process.
This is probably due to far more severe course of the
disease compared to any other conditions that patients
might have been admitted to Almazov Centre with.
So, this increased attention to prevention of typical
inpatient risks can be viewed as a sign of concerns
about COVID-19 complications being more
prominent during the second COVID-19 period.
Secondly, it seems that during this period more
patients had to stay in a hospital (maybe after being
transferred to another ward) after the end date of
second COVID-19 period, since there are clearly a lot
more cases in which the last point in patient’s
pathway is “Lab results viewing” event. This could
have no particular clinical meaning, since lab test
results can be added to EHR after the documents for
the discharge have been prepared. However, since
some other clinical processes directly precede this
event (such as various risk assessments), there is also
a very high possibility, that it is caused by the fact that
during the second COVID-19 period there was a
larger proportion of patients, whose condition was
somewhat (or significantly) severe. Our calculations
support the fact that an average hospital stay was 2.5
days longer the second time, if we consider the event
“New discharge letter” as finalising the treatment
process. Although overall the reasons of this feature
have to be investigated further.
Finally, a minor change of adding the “Inventory
of personal property and goods” event should be
noted. Of course, it is a standard procedure for any
kind of medical institution, but the fact that it starts to
appear in HIS records is a sign of the uptrend for
digitalization in health care as well.
6 DISCUSSION
As was assessed from the previous section, the
official guidelines were almost fully met in both
COVID-19 waves. We say “almost” because we
analyse treatment process with high-level abstraction
and there are aspects which should be considered
more granularly.
First, one is interested in examining the
composition and amount of laboratory research since
there is a separate section in the clinical guidelines
Figure 4: Clinical pathway for 2020/12/09-2021/03/15
(2
nd
wave). Main changes are highlighted in red.
COVID-ex 2022 - Special Session on "COVID-19 epidemic data mining and EXploration"
762
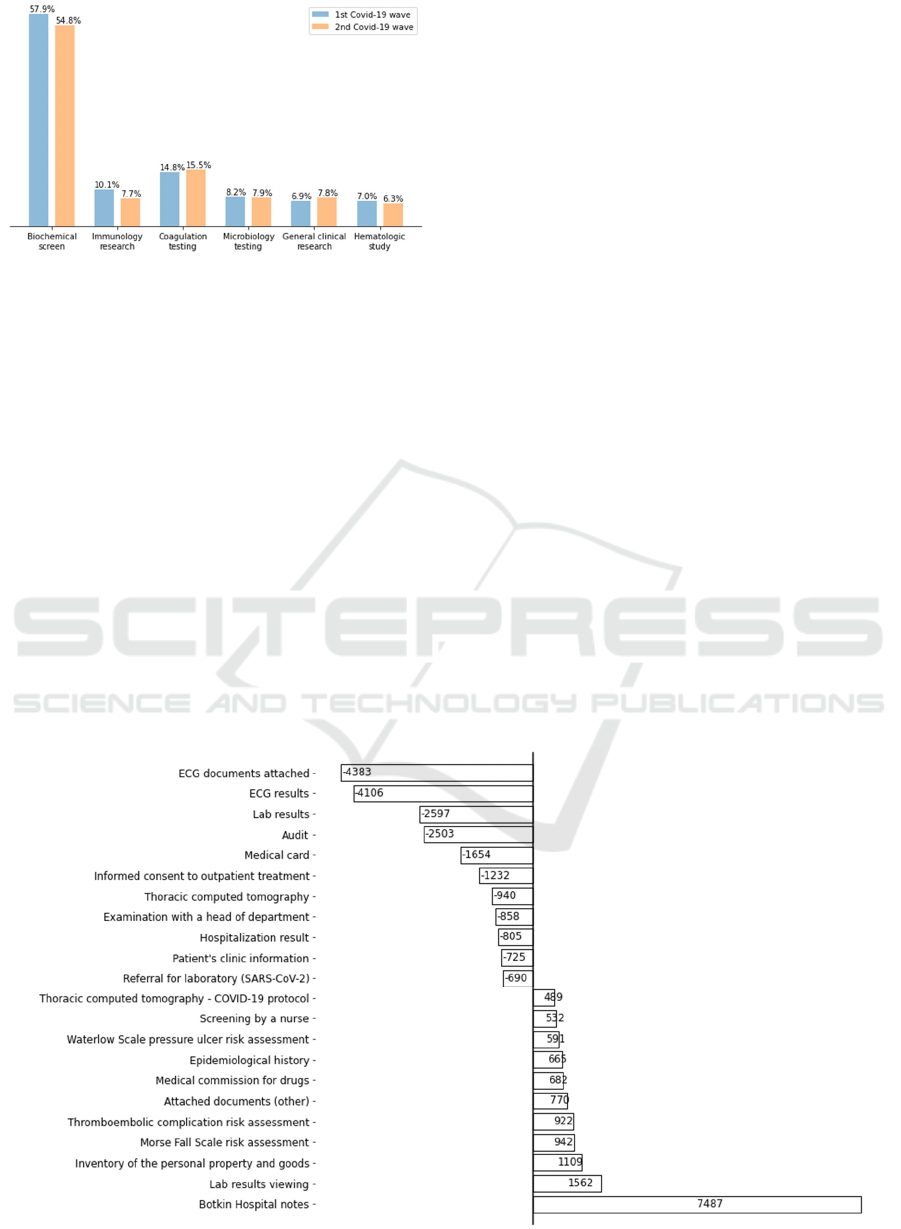
Figure 5: Amount of laboratory test types assigned
to patients in Covid-19 waves.
dedicated to tests. As seen in Figure 5, the ratio of lab
test types is nearly the same in both periods.
Biochemical screen prevails other testing types.
According to the guidelines, biochemical screening as
well as general clinical research should be run once in
a mild (outpatient) case, every second or third day in a
moderate (hospitalization) case, and every day in a
severe (intensive care) case; other lab measures should
be assessed mostly once and then for medical reasons.
That is why biochemical tests are a half of all labs
amount. However, general clinical research has the
same suggested frequency but not the same performing
in reality. This deviation can be explained by purposes
of the tests: general clinical research aims to assess
overall health, while biochemical screen helps to
specify a cause and which internal organs are targeted.
So, the last test type is performed more often to monitor
target organs health during the treatment.
Coagulation testing includes assessments of
measurements such as a d-dimer, activated partial
thromboplastin time, prothrombin ratio, etc.;
microbiology and immunology testing determine the
presence of SARS-CoV-2 and its antibodies,
respectively; hematologic study extends general
clinical research by platelet level analysis. This range
of tests covers the recommended scope of labs.
However, one measurement was not evaluated
contrary to the recommendations. It is NT-proBNP,
the N-terminal prohormone of brain natriuretic
peptide. The main reason is that this test, although
being very specific, is quite costly and, realistically,
cannot be performed routinely for every patient.
Moreover, there are various other methods of
diagnosing cardiac failure and cardiac toxicity.
Second, we can see that ECGs were performed
almost twice as often in the second wave as in the first
wave (Fig. 6). This fact is explained by the
differences in treatment schemes. During the first
wave, the medication guidelines included drugs with
proven cardiac toxicity, such as hydroxychloroquine.
So, there were a need in monitoring heart condition
more carefully (QT interval prolongation screen in
the first admission and then on every fifth day for
target patients). To the second wave, the treatment
was revised and alternative medications were
suggested. Here, ECGs were done in a case of target
groups or in a small number of cases, where the
previous treatment scheme was chosen for some
reasons.
Figure 6: The difference between event frequencies in the 2
nd
and 1
st
Covid-19 waves adjusted by the number of patients.
COVID-19 Treatment Process Identification: A Case Study in Russian Hospital for Cardiology
763

A new CT protocol, dedicated to COVID-19
diagnosis, was developed since the start of the 1
st
wave, so we can see a lot more of the specific
“Thoracic computed tomography – COVID-19
protocol” events. Thermometry was performed more
frequently, as it is implied by an increased amount of
“Botkin hospital notes” events. Meanwhile,
frequencies of performing CT (standard protocol) and
lab tests decreased (Fig. 6).
Finally, new treatment recommendations,
developed until and during the second wave, stated
that virus elimination period was shorter than in case
of usage of previous drug combinations. As we
revealed in the previous subsection, the length of stay
was longer the second time. The second “emergency”
mode in Almazov Centre was 1 month longer than the
first one (Fig. 1). At the same time, there were more
of the completed episodes of care (event “Episode
closure” in Fig. 3-4) but less arranged beds during the
second wave. Since the number of patients involved
in the process (depicted in the green vertex) is less
than completed episodes, we can refer to readmission
cases or patient transferring. Nevertheless, there are
still questions and paradoxes regarding in-hospital
times.
7 CONCLUSIONS
Some limitations present in our study and we have to
mention them. First, the variation in patient treatment
processes due to different patient models was not
taken into account. It could affect resulting process
models and possibly make them less general as was
in case of periods between COVID-19 waves (Fig. 2).
For example, patients admitted with a high-tech
medical care voucher usually need a surgery, while
many patients with other funding sources do not.
Also, clinical pathways differ for medical specialties.
The similarities and dissimilarities of these kinds of
clinical pathways provide a promising substrate for
further research. Second, in order to clearly trace the
impact of changes in clinical practice guidelines on
clinical pathways, the latter should be investigated in
more detail, because these changes often were minor
and could not possibly affect the key elements of
patient’s trajectory, such as necessary laboratory tests
or CT scans. Third, data structure we had included
static and dynamic elements. For example, “Hospital
diagnosis” could be changed several times, and the
system recorded it as a new instance. The same can
be stated about laboratory tests, ECGs, and other
procedures, that were usually performed several to
plenty of times during one treatment course. We
partially addressed this issue in Section 3.2, but it still
could be reflected in the model as most frequent
events. Finally, we did not consider other
methodologies to address the problem. Clinical
pathways can be analysed through modelling, e.g.,
simulation or other probabilistic models. However,
we also aimed to see the capacity of the emerging
discipline to model complex and ad-hoc processes.
Nevertheless, this work provides a promising
insight into how patient pathways can be modelled.
As it turned out, process mining has the potential for
addressing this problem. It demonstrates that the
more standard is this pathway, the easier it is to see it
in full detail, which raises a question of designing
proper patient models for any kind of treatment
processes research. In this paper, we identified
COVID-19 clinical pathways in Russian hospital for
cardiology during different pandemic periods using
process mining. Given peculiarities of the hospital
information system, we developed an approach for
analysing treatment flow. We confirmed clinical
practices compliance with the official guidelines,
which evolved while accumulating experience in
disease management.
ACKNOWLEDGEMENTS
This work was supported financially by the Ministry
of Science and Higher Education of the Russian
Federation, Agreement No. 075-15-2021-1013
(08.10.2021) (Internal project number
13.2251.21.0067). The authors also wish to thank the
colleagues from Almazov National Medical Research
Centre for the data provided and valuable
cooperation.
REFERENCES
Baker, K., Dunwoodie, E., Jones, R. G., Newsham, A.,
Johnson, O., Price, C. P., Wolstenholme, J., Leal, J.,
McGinley, P., Twelves, C., & Hall, G. (2017). Process
mining routinely collected electronic health records to
define real-life clinical pathways during chemotherapy.
International Journal of Medical Informatics, 103, 32–
41. https://doi.org/10.1016/J.IJMEDINF.2017.03.011
Batista, E., & Solanas, A. (2019). Process mining in
healthcare: A systematic review. 2018 9th International
Conference on Information, Intelligence, Systems and
Applications, IISA 2018. https://doi.org/10.1109/
IISA.2018.8633608
Demirhan, R. (2020). The Effects of Hospital Organization
on Treatment During COVID-19 Pandemic. Southern
COVID-ex 2022 - Special Session on "COVID-19 epidemic data mining and EXploration"
764

Clinics of Istanbul Eurasia, 31. https://doi.org/10.147
44/scie.2020.32154
Elkhovskaya, L., & Kovalchuk, S. (2021). Feature
Engineering with Process Mining Technique for Patient
State Predictions. Lecture Notes in Computer Science
(Including Subseries Lecture Notes in Artificial
Intelligence and Lecture Notes in Bioinformatics),
12744 LNCS, 584–592. https://doi.org/10.1007/978-3-
030-77967-2_48
Erdogan, T. G., & Tarhan, A. (2018). Systematic Mapping
of Process Mining Studies in Healthcare. IEEE Access,
6, 24543–25567. https://doi.org/10.1109/ACCESS.20
18.2831244
Funkner, A. A., Yakovlev, A. N., & Kovalchuk, S. v.
(2017). Data-driven modeling of clinical pathways
using electronic health records. Procedia Computer
Science, 121, 835–842. https://doi.org/10.1016/
j.procs.2017.11.108
Garcia, C. dos S., Meincheim, A., Faria Junior, E. R.,
Dallagassa, M. R., Sato, D. M. V., Carvalho, D. R.,
Santos, E. A. P., & Scalabrin, E. E. (2019). Process
mining techniques and applications – A systematic
mapping study. Expert Systems with Applications, 133,
260–295. https://doi.org/10.1016/J.ESWA.2019.05.003
Günther, C. W., & van der Aalst, W. M. P. (2007). Fuzzy
mining - Adaptive process simplification based on
multi-perspective metrics. International Conference on
Business Process Management, 328–343.
https://doi.org/10.1007/978-3-540-75183-0_24
Kempa-Liehr, A. W., Lin, C. Y. C., Britten, R., Armstrong,
D., Wallace, J., Mordaunt, D., & O’Sullivan, M. (2020).
Healthcare pathway discovery and probabilistic
machine learning. International Journal of Medical
Informatics, 137, 104087. https://doi.org/10.1016/
J.IJMEDINF.2020.104087
Meng, Y., Leng, K., Shan, L., Guo, M., Zhou, J., Tian, Q.,
& Hai, Y. (2020). A clinical pathway for pre-operative
screening of COVID-19 and its influence on clinical
outcome in patients with traumatic fractures.
International Orthopaedics 2020 44:8, 44(8), 1549–
1555. https://doi.org/10.1007/S00264-020-04645-3
Pegoraro, M., Shankar, M., Benevento, E., Aalst, W.,
Martin, L., & Marx, G. (2021). Analyzing Medical Data
with Process Mining: a COVID-19 Case Study.
Suriadi, S., Andrews, R., ter Hofstede, A. H. M., & Wynn,
M. T. (2017). Event log imperfection patterns for
process mining: Towards a systematic approach to
cleaning event logs. Information Systems, 64, 132–150.
https://doi.org/10.1016/J.IS.2016.07.011
Thai, P. Q., Toan, D. T. T., Son, D. T., Van, H. T. H., Minh,
L. N., Hung, L. X., Toan, N. van, Hoat, L. N., Luong,
D. H., Khue, L. N., Khoa, N. T., & Huong, L. T. (2020).
Factors associated with the duration of hospitalisation
among COVID-19 patients in Vietnam: A survival
analysis. Epidemiology & Infection, 148.
https://doi.org/10.1017/S0950268820001259
van der Aalst, W. (2016). Process mining: Data science in
action. In Process Mining: Data Science in Action.
Springer Berlin Heidelberg. https://doi.org/10.1007/
978-3-662-49851-4
van der Aalst, W. M. P. (2019). A practitioner’s guide to
process mining: Limitations of the directly-follows
graph. Procedia Computer Science, 164, 321–328.
https://doi.org/10.1016/J.PROCS.2019.12.189
Yang, Y., Shen, C., & Hu, C. (2020). Effect of COVID-19
Epidemic on Delay of Diagnosis and Treatment Path for
Patients with Nasopharyngeal Carcinoma. Cancer
Management and Research, 12, 3859. https://doi.org/
10.2147/CMAR.S254093
COVID-19 Treatment Process Identification: A Case Study in Russian Hospital for Cardiology
765
