
Urban Sprawl Analysis in Kutupalong Refugee Camp, Bangladesh
Filip Loncar
a
and Pedro Cabral
b
NOVA IMS, Universidade Nova de Lisboa, Campus de Campolide, 1070-312, Lisbon, Portugal
Keywords: Urban Sprawl, Refugee Camp, Unmanned Aerial Vehicle, Support Vector Machine, Maximum Likelihood
Classification.
Abstract: Urban sprawl is a common phenomenon associated with geographical and political challenges such as refugee
settlements and environmental extremes. Urban sprawl related to refugee or habitation settlement has been
an area of active interest because of humanitarian and environmental problems. For example, higher rates of
urban sprawling are positively correlated with higher rates of deforestation. The present study explored the
viability and reproducibility of different classification techniques in assessing urban sprawl among Rohingya
refugees in the Kutupalong refugee camp in Bangladesh. These classification methods include the Support
Vector Machine (SVM) and Maximum Likelihood Classifier (MLC). The urban sprawl was measured based
on the classification of urban and non-urban classes. The SVM yielded better overall accuracy performance
compared to MLC classification. The study showed that urban class exhibited exponential growth from 2.01
km
2
to 5.37 km
2
within nine months. On the contrary, the non-urban class shrunk from 12.58 km
2
to 9.95 km
2
during the same period due to a high influx of refugees and rapid camp expansion.
1 INTRODUCTION
Remote sensing has become popular in the field of
humanitarian action because it is an independent and
reliable source of information that allows both a quick
response to emergencies and monitoring of gradual
changes that are associated with human settlements,
including rehabilitation, sprawling, migration, and
refuge (Lang et al., 2020, Braun et al., 2016 ;
Blaschke et al., 2014 Lang et al., 2015). Remote
sensing is extremely important when observations in
the field are not possible manually due to limited
budget, legal barriers, and security aspects (Chen,
n.d.). The observation of specific places from space is
not only crucial for decision making involving
responses to natural disasters and emergencies
concerning the human race but also helps to develop
a general understanding of an area and the way trends
and temporal dynamics have shaped the special and
spatial patterns (Chang et al., 2011; Bello & Aina,
2014).
Approximately one million refugees of the
Rohingya minority population in Myanmar crossed
the border to Bangladesh seeking shelter from a
systemic operation and prosecution (Faye, 2021).
a
https://orcid.org/0000-0002-1518-8531
b
https://orcid.org/0000-0001-8622-6008
This caused significant expansions of the Kutupalong
refugee camp within two months and a reduction in
the vegetation in surrounding forests. Different
humanitarian and Human Rights Organizations
demanded frameworks camp monitoring and
environmental impact analysis (Sahana et al., 2019).
The refugee camp is situated in Ukhia, CoxBazar,
Bangladesh. The oppressions and extortions of the
Rohingya refugees caused the Kutupalong refugee
camp to expand (Braun et al., 2019a)The refugee
camps nowadays are more permanent than simple
transitory settlements, therefore are considered as
urban areas. The variables such as size, population
density, layout, infrastructure concentration, socio-
occupational profile, and trading activities are
supporting factors to consider refugee camps as urban
areas (Montclos & Kagwanja, 2000). The present
work provides novel information by exploring the
urban sprawl dynamics of the Rohingya refugees at
the Kutupalong refugee camp through remote sensing
techniques.
The research question focuses on how
urbanization has changed following the outbreak of
the Rohingya emergency by analysing four (4) drone
Loncar, F. and Cabral, P.
Urban Sprawl Analysis in Kutupalong Refugee Camp, Bangladesh.
DOI: 10.5220/0010970200003185
In Proceedings of the 8th International Conference on Geographical Information Systems Theory, Applications and Management (GISTAM 2022), pages 83-90
ISBN: 978-989-758-571-5; ISSN: 2184-500X
Copyright
c
2022 by SCITEPRESS – Science and Technology Publications, Lda. All rights reserved
83
images from 2017 and 2018, by answering the
following questions:
1. Which machine learning classifier
technique yields better performance in urban sprawl
classification in the Refugee camp context?
2. How much km
2
has urban class increased
over the period of 9 months in Kutupalong Refugee
Camp?
2 DATA AND METHODS
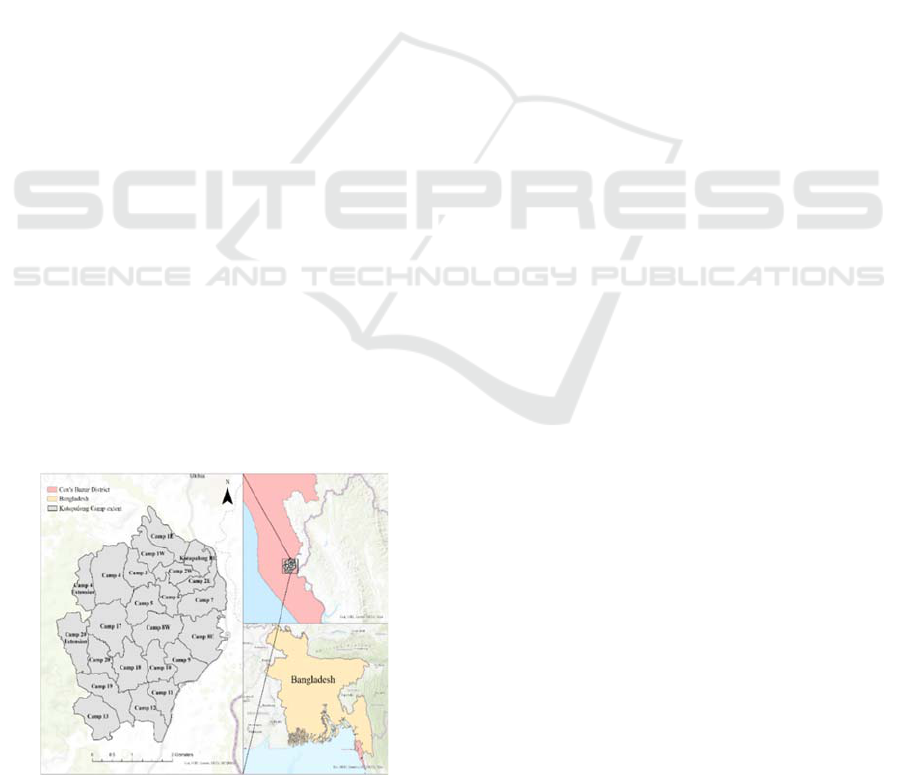
2.1 Study Area
Kutupalong refugee camp is located in south-eastern
Bangladesh along the border with Myanmar. The
camp administrative area is defined by the following
coordinates 21.2126°N 92.1634°E, and with a total
area of 14.5 km
2
, it hosts a population of 860,356
registered refugee individuals and 187,423 families
(as of June 30, 2020, UNHCR). When Rohingya
minority left Myanmar's adjacent Rakhine state as a
consequence of religious and ethnic persecution,
which culminated in brutal crackdowns and
systematic executions beginning on August 25, 2017,
Kutupalong became the world's biggest refugee
camp. The study area in this research focuses on
Kutupalong camp and its extensions located in Ukhia
Upzalla in the district of Cox’s Bazar region and its
extensions. Figure 2 below represents the study area.
Kutupalong area is situated on a mix of plains and
small hills, extending into the Chittagong Hill tracts
bordering Myanmar. The area is characterized by
heavy rain on the Chittagong Hill tracts has resulted
in numerous landslides. The administration of the
district has introduced a policy on restricted tree-
cutting to limit erosion in the hope of limiting further
landslides and related fatalities (Braun et al., 2019b).
Figure 1: Study Area.
2.2 Data
The methodology for the present study included the
acquisition of the images from IOM Bangladesh –
Needs and Population Monitoring (NPM) Cox's
Bazar Rohingya Refugees Settlements UAV
Imagery, which were stored at data.humdata.org. The
retrieved image packaged were downloaded in tiff
format with mosaiced images. The images were
combined and georeferenced, with Red, Blue, and
Green bands. The dates of the images were taken
from December 2017 to February, July, and
September 2018 following the outbreak of violence in
August 2017 in Rakhine State, Myanmar. The
Imagery type is UAV with a resolution of 10 cm,
projection WGS84 _Zone 46 N. While there were
images from the entire Cox’s Bazar Refugee and
different camps stored in the repository, this research
only focuses on the Kutupalong camp, located in
Cox’s Bazar region. The information on flight
altitude and swath with is unknown to researchers.
The spatial database in shapefile format with an
outline of camps, settlements, and sites where
Rohingya refugees are staying in Cox’s Basar has
been acquired from data.humdata.org provided by the
Inter Section coordination Group. The database
contains the camp-block boundary (admin level-2 or
camp sub-division) of Rohingya refugees in Cox's
Bazar, Bangladesh. Since the research is excluding
the remaining camps of in Cox’s Bazar disrtirct, the
shapefile was clipped leaving out only the
Kutupalong camp and its extensions.
The shapefile of the study area is divided per
camp into 23 sub-regions (polygons) with a total area
consisting of 14.5 km
2
. The biggest camp is Camp 4
with an area of 1.15 km
2
being on the northwest side
of the study region to the smallest being camp 6 on
the mid-eastern side with 0.36 km
2
.
2.3 Methods
The diagram in Figure 2 explains the workflow of the
research. The study is based on four different images
from 4 different dates to analyse urbanization within
the area of sprawl. Moreover, this research explores
different remote sensing supervised classification
methods (Support Vector Machine and Maximum
Likelihood Classification) to assess which performs
better analysing urbanization in refugee settlements.
GISTAM 2022 - 8th International Conference on Geographical Information Systems Theory, Applications and Management
84
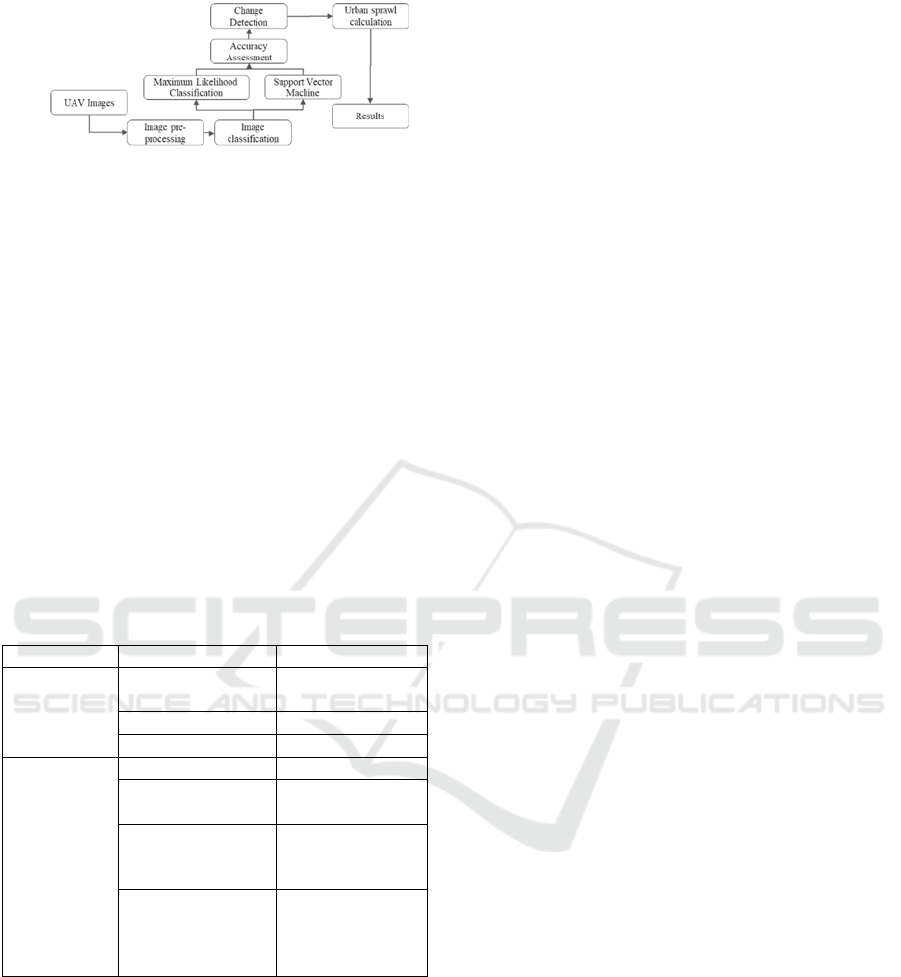
Figure 2: Data and methodology used for image
classification and result validation.
2.3.1 Supervised Classification
The suggested technique consists of two-different
classification assessments. The performance of
various classifiers with found distinct dataset
combinations from different dates in the same study
area, to determine which of the two will yield superior
results for urbanization. As one of the aims of the
research is to understand which supervised
classification provides the best results for mapping
the urbanization in refugee settlements, MLC and
SVM were tuned in.
To detect and understand urbanization, the
authors have decided to create two classes – Urban
and Non-Urban. Table 1 explains the categories and
definitions of the classes:
Table 1: Classification nomenclature.
Class Level 1 class Description
Urban Residential Refugee housing
units
Commercial Residential areas
Industrial Warehouses
Non-Urban Agriculture Farmlands
Green Space Grasslands,
shrublands
Waterbody Natural or
artificial
waterbodies
Undeveloped Vacant land, bare
land or land
under
construction
2.3.2 Image Classification Accuracy
When evaluating the effectiveness of a classification
model applied to remote sensing data, accuracy
measures are used to determine how near the model's
predictions are to reality. As a result, accuracy
evaluation compares the predicted labels assigned to
an item using an MLC to its actual label using
ground-truth data (test dataset).
A confusion matrix (or error matrix) is commonly
used to determine classification accuracy. The
classification accuracy is a confusion matrix table
shows a correspondence between the classification
result and reference image (images being ground truth
data in this research). This enables for more in-depth
examination than a simple fraction of the right
classifications (accuracy). If the data set is
imbalanced, that is, when the number of observations
in various classes varies considerably, accuracy will
produce false results (Maxwell & Warner, 2020)
From the confusion matrix, and following
research development, we can compute several
accuracy metrics, such as:
Overall Accuracy: calculated by summing the
number of correctly classified values and
dividing by the total number of values.
User’s accuracy: The probability is calculated
by dividing the number of properly predicted
values by the total number of values projected to
belong to a class. The user’s accuracy is from
the standpoint of the map user.
Producer accuracy: The number of properly
identified pixels in each category (on the major
diagonal) divided by the number of reference
pixels “known” to be of that category yields the
following results (the column total).
Kappa Coefficient: The kappa coefficient
assesses the degree of agreement between
categorization and truth values. A kappa value
of one indicates complete agreement, whereas a
value of zero indicates no agreement.
2.3.3 Urban Sprawl Analysis with
Shannon’s Entropy
The study aims to analyze the process of the built-up
campsites over a period of 9 months in Cox’s Bazaar,
Bangladesh. While there is a wide variety of metrics
that are used to measure the degree of urban sprawl,
this research has adopted the Shannon’s Entropy
Index. The Shannon Entropy is an index or
indication, which is capable of computing spatial
concentration or dispersion in any spatial unit. The
entropy values vary from 0 to 1, which 0 means that
entropy values are maximally concentrated in one
region, while 1 means that values are unevenly
dispersed across space. The entropy value increases
as built-up regions are dispersed from a city core or
road network. This demonstrates whether the urban
growth is more scattered or dense (Tewolde & Cabral,
2011). The model is calculated using the formula
below:
𝐻𝑛 𝑝𝑖
log
1/𝑝𝑖
/log
𝑛
Urban Sprawl Analysis in Kutupalong Refugee Camp, Bangladesh
85
Where 𝑝𝑖 𝑥𝑖 /
∑
𝑥𝑖
and 𝑥𝑖 is the density of
land development, which is equal to the amount of
built-up land divided by the total amount of land in
the 𝑖th of 𝑛 total zones.
3 RESULTS
3.1 Support Vector Machine
We have deployed ArcGIS Pro for supervised image
classification. Support Vector Machine (SVM)
supervised classification has been performed over the
4 UAV Images from the Kutupalong Refugee Camp
region from 4 different dates to detect urban sprawl
and camp expansion. Since Analysing UAV images
with high resolution requires stronger computing
power, and after multiple failed attempts to perform
SVM classification using original resolution, the
image size was reduced using resample function in
ArcGIS Pro to X being 0.5 and Y being 0.5. When
resampling the image, we understand that the
resolution of the file with be altered, however since
computational power was limited we have decided to
accept the risk.
Image segmentation is a key component in object-
based classification workflow. The segmented
images produced have grouped neighboring pixels
together, that are similar in color and shape. The
segmented images produced for 4 different dates were
acceptable. Following acceptance of segmented
images, the training samples for 2 classes were
collected for urban and non-urban classes. SVM has
been performed with default 500 maximum number
of samples per class, with active chromaticity color
and means digital number activated.
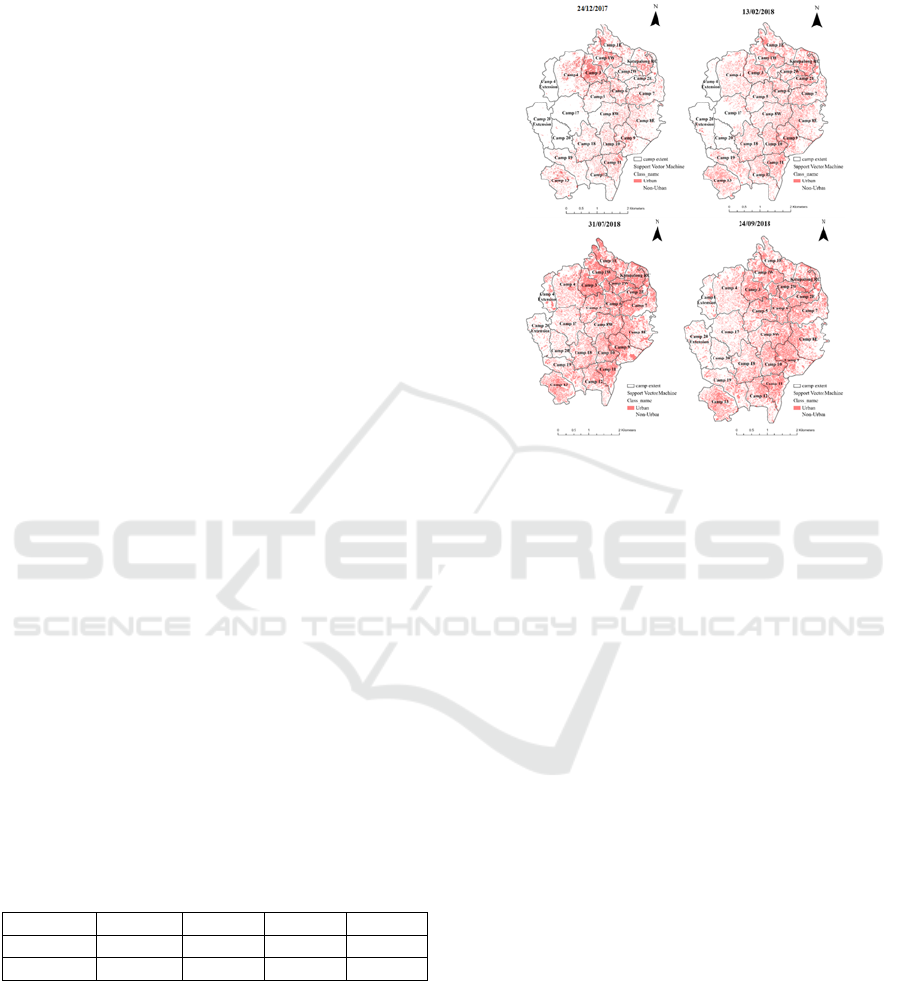
Maps in Figure 3 are outputs of SVM supervised
classification. The red polygons are representing
urban areas, while the grey ones are non-urban.
Table 2 SVM: Representing the numbers of square
kilometers (km
2
) for each of the classes on each date.
Class/Date 24-12-17 12-02-18 31-07-18 24-09-18
Urban 2.01 2.91 4.63 5.37
Non-Urban 12.58 11.68 9.22 9.95
Upon completion of classification, the researcher
will calculate the actual classified areas in square
kilometers from all the 4 map outputs to compare the
results. Firstly, the SVM classified maps will be
converted to vector layer that is shapefile, using
reclassified and export raster to polygon functions.
Upon conversion, using polygons that have the same
class were merged Calculate Geometry Attributes
function was performed in order to n calculate the
total square kilometer area of each class and compare
between the dates.
Figure 3: Support Vector Machine - Kutupalong Refugee
Camp.
Area wise statistics has been calculated in ArcGIS
Pro with above table 2 representing a number of km
2
for four different dates for each of our classes, we can
conclude that the urban class has an exponential
growth for only around 9 months from 2.01 km
2
on
the first image of 24/12/2017 to 5.37 km
2
on the last
image of 24/09/2018, which reads 13.7% of the total
area on the first image to 35% total on the last image
taken. The non-urban class however has reduced
from 12.58 km
2
to 9.95 km
2
(from 86 % of the total
area to 65%). The SVM classifier is showing higher
are for non-urban class on 31-07-18 date compared to
24-09-18 date (9.22 km
2
to 9.95 km
2
)
Even though the time span of the 3rd and 4th
image is not the longest (2 months compared to 2nd
and 3rd image which is around 5 months) we can
notice the highest growth of urban class between 31-
07-18 and 24-09-18, from 4.63 km
2
to 5.37 km
2
.
3.2 Maximum Likelihood Classification
MLC has been performed over the four images from
different dates in the study area. Following the same
methodology as for the SVM classifier, the researcher
is interested to see the urbanization over the study
area in Kutupalong Camp, Bangladesh, two different
classes were used – Urban and Non-Urban. Training
samples in form of polygons were collected for each
class as follows. The MLC showed good performance
GISTAM 2022 - 8th International Conference on Geographical Information Systems Theory, Applications and Management
86
in classifying very high spatial resolution images as it
was not failing during the classification run process,
unlike the SVM classification. However, to fairly
compare the two classifications, we performed the
MLC classification with resampled in order to fairly
compare the classification performances.
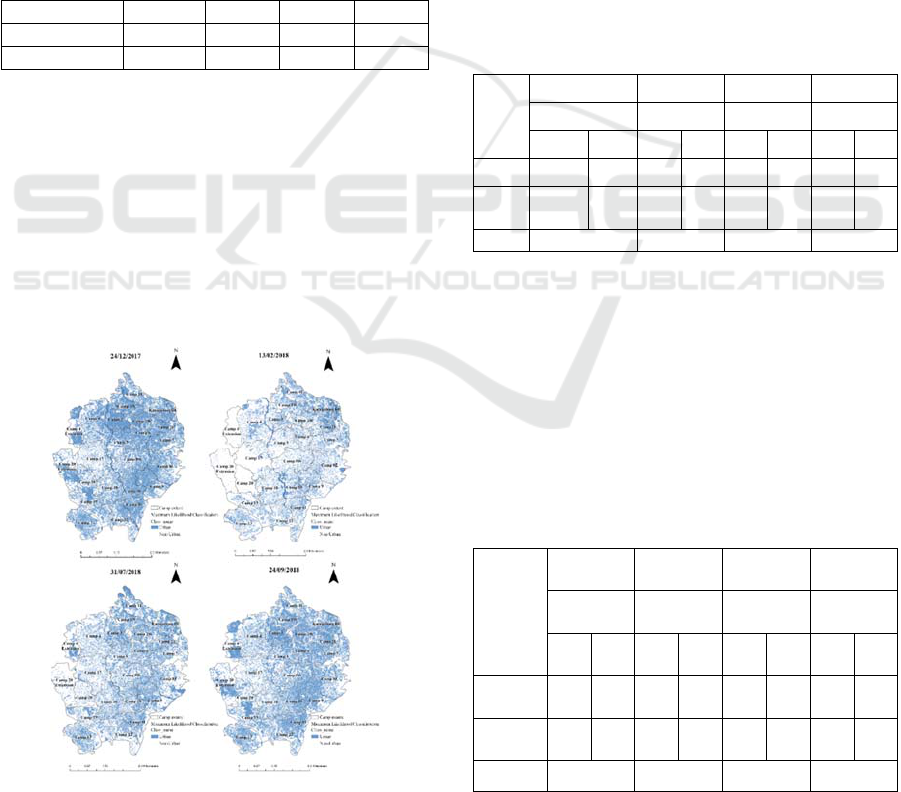
The maps in Figure 5 below are the results of
supervised classification using a Maximum
Likelihood Classification. The blue polygons indicate
the classified urban class over the study area.
After classification is complete, the actual
classified area in square kilometers for all four maps
has been calculated, to understand the classification
by calculating the geometry attributes of urban and
non-urban classes.
Table 3: Representing a number of square kilometers (km
2
)
for each of the classes on each date.
Class/Date 24-12-17 12-02-18 31-07-18 24-09-18
Urban 3.2 3.6 5.25 7.8
Non-Urban 11.3 10.9 9.25 6.7
Unlike in the case of SVM, with MLC we can
understand that the most significant change in terms
of urban class expansion is between the third and last
image dates (31-07-18 to 24-09-18), which
percentage-wise gives an increase from 36% of the
total area on the third image, to 54% of the total area.
In the case of the non-urban class, the same timespan
(31-07-18 to 24-09-18) gives the highest decrease in
terms of the area from 9.25 km
2
to 6.7 km
2
(percentage-wise this gives us a decrease from 64%
to 46%).
Figure 4: Maximum Likelihood Classification - Kutupalong
Refugee Camp.
3.3 Accuracy Assessment
The main goal of the research is to evaluate the
performance of the two classifiers over the different
time periods and to determine which of the classifiers
produces superior results.
For each of the classified images (SVM and MLC)
the random 100 points have been computed in
ArcGIS Pro in order to get the accuracy metrics. The
related UAV image for each date has been used for
ground truth testing against the 100 random points
produced. After the ground truth comparison with
classifiers, confusion matrices have been computed to
get overall accuracy, user accuracy, producer
accuracy, and Kappa Index of agreement.
The results indicate that both classifiers scored
high overall accuracy and performed well when
classifying UAV imagery in an environment such as
refugee camp settlements.
Table 4: Confusion Matrix - Support Vector Machine.
Class/
Date
24-12-17 13-02-18 31-07-18 24-09-18
OA=85% OA=90% OA=94% OA=83%
UA PA UA PA UA PA UA PA
Urban 100% 48% 90% 69% 96% 91% 91% 67%
Non-
Urban
83% 100% 90% 97% 94% 97% 79% 95%
Kappa 0.57 0.72 0.89 0.64
The overall accuracy yielded good results for the
SVM classifier, having a minimum value of 83% and
a maximum value of 85%. User accuracy and
producer accuracy also showed favorable results,
with exception of 48% of producer accuracy of urban
class for the first date of SVM classified image. The
kappa coefficient and the degree of agreement
between categorization and truth values vary from
0.57 for the first image to 0.89 for the third image.
Table 5: Confusion Matrix - Maximum Likelihood
Classification.
Class/
Date
24-12-
17
13-02-18 31-07-18 24-09-18
OA=81
%
OA=86
%
OA=87
%
OA=85
%
U
A
P
A
U
A
P
A
U
A
P
A
U
A
P
A
Urban
86
%
54
%
84
%
68
%
72
%
90
%
76
%
90
%
Non-
Urban
79
%
95
%
87
%
94
%
95
%
86
%
93
%
82
%
Kappa 0.54 0.65 0.71 0.69
Urban Sprawl Analysis in Kutupalong Refugee Camp, Bangladesh
87
Maximum Likelihood Classification has
produced similar results in comparison to SVM
classified. The minimum overall accuracy is 81% for
the first image and varies to a maximum of 87% for
the third image. User accuracy and producer
accuracy have shown good scores however slightly
less when in comparison to the SVM classifier. The
Kappa coefficient and degree of agreement between
categorization and true values is varying from 0.54
for the first image to 0.71 for the third image.
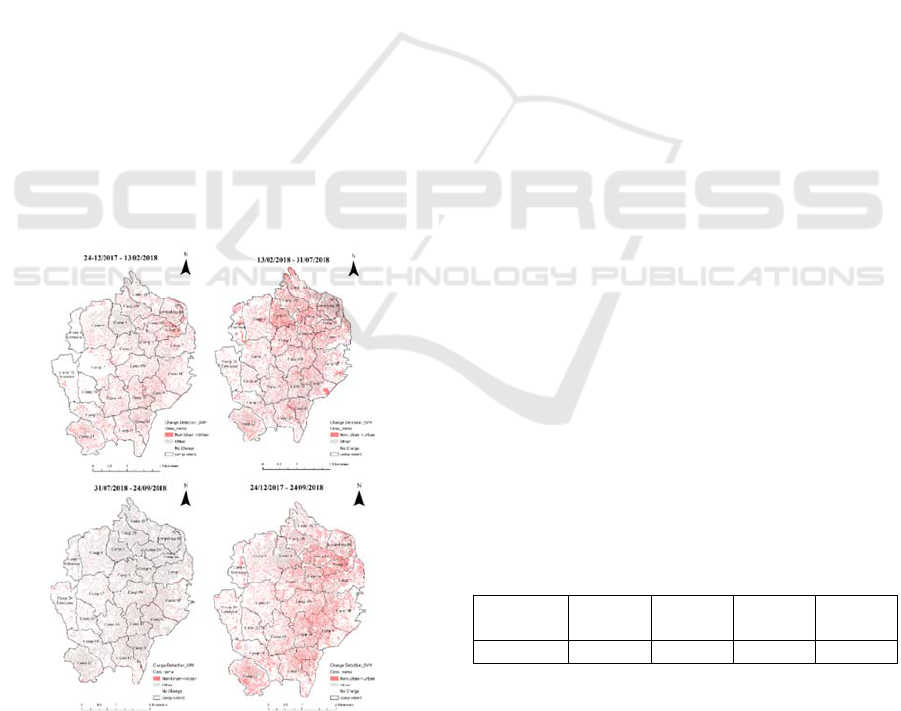
3.4 Change Detection: Support
Vector Machine
To visualize the urban sprawl and detect changes
between the dates, Change Detection Wizard of
ArcGIS Pro has been utilized. The categorical change
method of change detection has been configured over
the 4 classified raster images. Processing was set to
the full extent and class configuration is as follows:
• From Classes: Non-Urban
• To Classes: Urban and Non-Urban
This would give us the outputs where Non-Urban
pixels have changed to Urban class, and where Non-
Urban Class did not change. The smoothing
Neighbourhood was set to none. Figure 4 represents
the change analysis of subsequential images from the
first to the last date.
Figure 5: Change Detection Maps - Support Vector
Machine.
With overlaying the study area extent which has
information on sub-camps and the classified raster
image, we can compute the camp-wise statistics of
SVM supervised classification for four (4) different
dates, to understand the direction urban sprawl is
taking.
In terms of urban class, Camp 3, Camp 1W,
Kutupalong RC, and Camp 6 had the highest value of
urban class on the first image (24/12/2017) with 53%,
32%, 25%, and 23% respectively, while in the case of
the last image (24/09/2018) Camp 10, Camp 11,
Camp 12 and Camp 13 showed highest values of
urban class with 70%, 59%, 58%, and 57%
respectively. However, the highest increase of urban
class within camps compared between the first and
the last image can be noticed in Camp 10, Camp 11,
Camp 12, and Camp 13 with an increase of 45%, 43%
33%, and 32% respectively. These camps that show
the highest change in terms of urbanization are all
located in the south of the study area.
3.5 Shannon’s Diversity Index
Shannon’s Diversity Index shows us species diversity
in the community. In the context of this research, it is
giving us an understanding of the urban sprawl
composition and class richness and evenness over
time (Bourne & Conway, 2014). The diversity index
of the urban class for SVM classifier for dates 24-12-
2017, 13-02-2018, 31-07-2018 and 24-09-2018
0.4 , 0.5 , 0.65 and 0.62 respectively. The trend of
results of Shannon’s diversity index for both
classifiers shows lower diversity between the first two
image dates, however, it has an exponential growth in
value for the third and fourth dates. This has shown
that the urban sprawl in the Kutupalong refugee camp
has increased, due to the influx of refugees and urban
expansion as a need for more housing. If the urban
class is unevenly distributed throughout space, the
increased value of Shannon’s Diversity index reflects
that (K. Madhavi Lata et al., 2009).
Table 6: Evolution of Shannon's Diversity Index for MLC
and SVM Classifier.
Date/
Classifier
24/12/1
7
12/02/1
8
31/07/1
8
24/09/1
8
SVM 0.40 0.50 0.62 0.65
4 DISCUSSION
In terms of computing power, MLC has an advantage
in analysing very high spatial resolution imagery.
GISTAM 2022 - 8th International Conference on Geographical Information Systems Theory, Applications and Management
88

MLC classification has successfully analysed original
10 cm resolution images, while the SVM has failed to
do so. Finally, to create a fair comparison, we decided
to reduce and change the spatial resolution of raster
datasets and set rules for aggregating or interpolating
values across the new pixel size to 0.5.
The Kappa coefficient corrects standardized
measures of agreement between two categorical
scores produced by the two rates. Based on Landis
and Koch measurement of observer agreement The
Kappa interpretation of SVM classification gives us
an understanding that agreement is substantial for
values of 0.57, 0.72, and 0.64 and almost perfect
agreement for 0.89. The values for MLC
classification have a similar trend of values where
classification of images 1-4 have values of 0.54, 0.65,
0.71, and 0.69 respectively. In a comparison of the
two classifications, the Kappa coefficient for the
MLC classifier shows higher agreement with
exception of the last-date image where MLC yields
better results.
These results answer the research question,
indicating that the SVM classifier is superior and
gives better performance in classifying urban classes,,
that is refugee settlements in the context of the
research.
When it comes to calculating urbanization, the
research indicates that there has been an exponential
expansion of urban class from 24-12-17 to 24-09-18
from 2.01 km
2
to 5.37 km
2
for SVM. The non-urban
class however reduced from 12.58 km
2
to 9.95 km
2
.
The results found in the research are relevant for
urban sprawl analysis in refugee camp settlement and
Humanitarian actors.
The evolution and increase in the values of
Shannon’s Diversity Index indicate that there is an
increase in urban sprawl and development tends to be
more dispersed over a period of time. This indicates a
rapid increase in urban sprawl. The results of this
index give us the idea of spatiotemporal patterns of
urban growth in Kutupalong Refugee camp.
5 CONCLUSION
We demonstrated the application of remote sensing
classification techniques using 4 UAV images from
different dates to identify and calculate the urban
sprawl in Kutupalong Refugee Camp, Bangladesh
which is under great urban expansion due to the influx
of Rohingya refugees from neighbouring Myanmar.
The Rohingya emergency was one of the biggest
crises in 2017, which has severely affected the
change of the physical landscape of the host
community in Bangladesh.
The research analysed the expansion of the
refugee camp from 2017 to 2018. The objective was
to understand which of the techniques yielded better
results. The research was conducted to understand
and evaluate the performance and agreement of two
different machine learning classifiers – Support
Vector Machine and Maximum Likelihood
Classification.
To answer the research question of which
machine learning classifier technique yields better
performance in urban sprawl classification in
Refugee camp context, both of the classifiers’
performances were similar in terms of overall
accuracy for both of the classes under analysis. In
terms of overall accuracy, the advantage has been
given to SVM classifier as it produced slightly better
results.
REFERENCES
Bello, O. M., & Aina, Y. A. (2014). Satellite Remote
Sensing as a Tool in Disaster Management and
Sustainable Development: Towards a Synergistic
Approach. Procedia - Social and Behavioral Sciences,
120. https://doi.org/10.1016/j.sbspro.2014.02.114
Blaschke, T., Hay, G. J., Kelly, M., Lang, S., Hofmann, P.,
Addink, E., Queiroz Feitosa, R., van der Meer, F., van
der Werff, H., van Coillie, F., & Tiede, D. (2014).
Geographic Object-Based Image Analysis –
Towards a new paradigm. ISPRS Journal of
Photogrammetry and Remote Sensing, 87.
https://doi.org/10.1016/j.isprsjprs.2013.09.014
Bourne, K. S., & Conway, T. M. (2014). The influence of
land use type and municipal context on urban tree
species diversity. Urban Ecosystems, 17(1).
https://doi.org/10.1007/s11252-013-0317-0
Braun, A., Fakhri, F., & Hochschild, V. (2019a). Refugee
Camp Monitoring and Environmental Change
Assessment of Kutupalong, Bangladesh, Based on
Radar Imagery of Sentinel-1 and
ALOS-2. Remote Sensing, 11(17), 2047.
https://doi.org/10.3390/rs11172047
Braun, A., Fakhri, F., & Hochschild, V. (2019b). Refugee
Camp Monitoring and Environmental Change
Assessment of Kutupalong, Bangladesh, Based on
Radar Imagery of Sentinel-1 and ALOS-2. Remote
Sensing, 11(17), 2047.
https://doi.org/10.3390/rs11172047
Braun, A., Lang, S., & Hochschild, V. (2016). Impact of
Refugee Camps on Their Environment A Case Study
Using Multi-Temporal SAR Data. Journal of
Geography, Environment and Earth Science
International, 4(2). https://doi.org/10.9734/JGEESI/
2016/22392
Urban Sprawl Analysis in Kutupalong Refugee Camp, Bangladesh
89

Chang, A., Eo, Y., Kim, S., Kim, Y., & Kim, Y. (2011).
Canopy-cover thematic-map generation for Military
Map products using remote sensing data in inaccessible
areas. Landscape and Ecological Engineering, 7(2).
https://doi.org/10.1007/s11355-010-0132-1
Chen, J. , Z. Y. , Z. A. , & F. H. (n.d.). Deep learning from
multiple crowds: A case study of humanitarian
mapping. IEEE Transactions on Geoscience and
Remote Sensing , 1713–1722.
Faye, M. (2021). A forced migration from Myanmar to
Bangladesh and beyond: humanitarian response to
Rohingya refugee crisis. Journal of International
Humanitarian Action, 6(1). https://doi.org/
10.1186/s41018-021-00098-4.
K. Madhavi Lata, v. Krishna Prasad, K. V. S. Badarinath,
& v. Raghavaswamy. (2009). Measuring urban sprawl:
A case study of Hyderabad. Geospatial World.
Lang, S., Füreder, P., Kanz, O., Card, B., Roberts, S., &
Papp, A. (2015). Humanitarian emergencies: causes,
traits and impacts as observed by remote sensing.
Remote Sensing of Water Resources, Disasters, and
Urban Studies, 483–512.
Lang, S., Füreder, P., Riedler, B., Wendt, L., Braun, A.,
Tiede, D., Schoepfer, E., Zeil, P., Spröhnle, K.,
Kulessa, K., Rogenhofer, E., Bäuerl, M., Öze, A.,
Schwendemann, G., & Hochschild, V. (2020). Earth
observation tools and services to increase the
effectiveness of humanitarian assistance. European
Journal of Remote Sensing, 53(sup2).
https://doi.org/10.1080/22797254.2019.1684208
Maxwell, A. E., & Warner, T. A. (2020). Thematic
Classification Accuracy Assessment with Inherently
Uncertain Boundaries: An Argument for Center-
Weighted Accuracy Assessment Metrics. Remote
Sensing, 12(12). https://doi.org/10.3390/rs12121905
Montclos, M.-A. P. D., & Kagwanja, P. M. (2000). Refugee
Camps or Cities? The Socio-economic Dynamics of the
Dadaab and Kakuma Camps in Northern Kenya.
Journal of Refugee Studies, 13(2).
https://doi.org/10.1093/jrs/13.2.205
Sahana, M., Jahangir, S., & Anisujjaman, MD. (2019).
Forced Migration and the Expatriation of the Rohingya:
A Demographic Assessment of Their Historical
Exclusions and Statelessness. Journal of Muslim
Minority Affairs, 39(1). https://doi.org/10.1080/
13602004.2019.1587952
Tewolde, M. G., & Cabral, P. (2011). Urban Sprawl
Analysis and Modeling in Asmara, Eritrea. Remote
Sensing, 3(10). https://doi.org/10.3390/rs3102148.
GISTAM 2022 - 8th International Conference on Geographical Information Systems Theory, Applications and Management
90
