
A Real-time Explainable Anomaly Detection System for Connected
Vehicles
Duc Cuong Nguyen
1
, Kien Dang Nguyen
1
and Simy Chacko
2
1
HCL Vietnam, Vietnam
2
HCL Technologies, India
Keywords:
Automotive Security, Anomaly Detection, Explainable AI, Deep Learning, Connected Vehicle.
Abstract:
Anomaly detection is one of the key factors to identify and prevent attacks on connected vehicles. It makes cars
more secure and safer to use in the new era of connectivity. In this paper, we propose a real-time explainable
deep learning-based anomaly detection system that effectively identifies anomalous activities in connected
vehicles. Our approach provides real-time alerts for on-the-road connected vehicles with clear output that
makes it easily comprehensible. By evaluating our approach on a simulated driving environment, we can
showcase its effectiveness (AUC value of 0.95) and provide insights on different attack scenarios that would
threaten the safety of car users.
1 INTRODUCTION
Vehicles are becoming more connected than ever.
This makes them a potential target for malicious ac-
tors. Subsequently, cyberattacks on connected cars
have become more popular. Automotive security
hence has evolved from physically securing door
locks to secure communication, data protection, and
much more. An important part of automotive sys-
tems is in-vehicle communication as it enables many
useful, advanced features for the convenience and
safety of car users. In-vehicle communication is com-
prised of multiple electronic control units (ECUs)
that exchange information with each other. Such
communication is enabled by different technologies
such as FlexRay, LIN (Local Interconnect Network),
etc., with the most popular one being CAN (Con-
troller Area Network). While CAN was intended
to be used in an isolated local network, it has been
shown to be vulnerable to remote attacks (Koscher
et al., 2010), (Checkoway et al., 2011), especially
with the recent advance in vehicle’s communication
such as vehicle-to-everything, vehicle-to-vehicle, and
vehicle-to-infrastructure, etc. Hijacking an ECU via
Cellular, Wi-Fi, Bluetooth, etc., allows attackers to
intercept a vehicle’s communication network. This
would threaten the safety of car users (e.g., sudden
brake, or suddenly shutting off the car engine on high-
ways) and result in threats to human life. This calls
for advanced techniques to prevent attacks on the ve-
hicle’s network. Hence, the ability to identify and pre-
vent live attacks on connected vehicles becomes a key
factor to the security of connected cars. Anomaly de-
tection system, therefore, becomes an integral part of
connected vehicles.
Rule-based and signature-based approaches have
been developed to deal with known attacks (Mitchell
and Chen, 2012). While these approaches could effi-
ciently identify attacks that have been studied, they
could not deal with unknown attack scenarios. To
fill this gap, machine learning-based approaches have
been proposed to deal with unknown attacks (Müter
and Asaj, 2011), (Kang and Kang, 2016), (Taylor
et al., 2016). Despite being a complex domain that re-
quires expertise for users to comprehend, most prior
works on using machine learning, specifically on us-
ing deep learning (Hanselmann et al., 2020) to iden-
tify anomaly only provided solutions as a black-box
i.e., whether a given activity or event was anomalous.
The lack of transparency makes it increasingly diffi-
cult for layman users to inspect the sources and rea-
sons for anomalous events that have been reported.
This however is very critical to automotive security
because of its instantaneous nature. When a car is
on the road, network communication is monitored in
real-time to detect anomalous events. In case such an
event happens, it requires immediate (often manual)
investigation and response. Hence, the detection re-
sults should be accurate and more importantly must
provide insightful information to the investigators.
Nguyen, D., Nguyen, K. and Chacko, S.
A Real-time Explainable Anomaly Detection System for Connected Vehicles.
DOI: 10.5220/0010968500003194
In Proceedings of the 7th International Conference on Internet of Things, Big Data and Security (IoTBDS 2022), pages 17-25
ISBN: 978-989-758-564-7; ISSN: 2184-4976
Copyright
c
2022 by SCITEPRESS – Science and Technology Publications, Lda. All rights reserved
17

Further, prior works often were evaluated purely on
collected (or synthesized) static vehicle data to exam-
ine how well their approaches could detect anomalous
events. It is hence unknown how such approaches
work on live attacks on on-the-road vehicles.
In aiming to fill this gap, we propose a Real-time
Explainable Anomaly Detection approach (RE XAD)
that leverages deep learning techniques to iden-
tify anomalous events in the connected vehicle’s
network. RE XAD uses Long Short-term Memory
(LSTM) (Hochreiter and Schmidhuber, 1997) lay-
ers in combination with AutoEncoder techniques
(Rumelhart et al., 1986) to learn patterns of normal
events. Later when an anomalous event takes place,
it will have characteristics that deviate from normal
patterns, hence will be detected by R E XAD. REXAD
provides details attribution of a detected anomalous
event: (1) why it is detected, and (2) what makes
it abnormal. To the best of our knowledge, we are
the first to provide a real-time anomaly detection sys-
tem for connected vehicles that combines explainable
deep learning techniques. Unlike existing work, we
evaluate R E XAD on a driving simulator with different
live attack scenarios. Our results show that R E XAD
could detect anomalous events in vehicle’s communi-
cation network with an area under the ROC (Receiver
operating characteristic) curve (AUC) value of 0.95
and a response time of 8 milliseconds. In summary,
we make the following tangible contributions:
• We propose a real-time explainable deep learning-
based anomaly detection system with an AUC
value of 0.95 and an average response time of 8
milliseconds
1
.
• We design and implement 3 different live attacks
in simulated environments. This provides insights
into how such attacks would work in (close to)
real-life situations.
• Our evaluation of RE XAD with simulated driv-
ing environment suggests that RE XAD could iden-
tify dangerous yet subtle attacks that could result
in (potential) fatal accidents in all experimented
cases.
The remainder of this paper is organized as fol-
lows. Works that are related to anomaly detection in
the automotive domain are briefly discussed in Sec-
tion 2. Our approach and its implementation are then
described in Section 3. Section 4 provides details on
our evaluation setup. Section 5 describes our results.
We discuss our findings and the limitation of our work
in Section 6. Section 7 then concludes our paper.
1
We ran our live detection experiments and the PGDrive
simulator on a 2.5GHz Amazon work-space with 2 cores
and 8 GB of RAM.
2 RELATED WORK
Anomaly detection system has been introduced to
traditional computers as an effective countermeasure
against intrusion attacks (Noble and Cook, 2003).
The goal of an anomaly detection system in a vehi-
cle’s communication channel is to detect anomalous
events happening within the communication of elec-
trical control units e.g., messages being intercepted
and manipulated by attackers. There are two main
types of anomaly detection approaches: rule-based
(or signature-based) and anomaly-based. With the
rule-based approach, patterns of anomalous behav-
iors are defined beforehand, and anomaly detectors
would look for events that exhibit similar (or identi-
cal) characteristics and flag them as anomalous (Ilgun
et al., 1995). This approach requires the databases
(or the sets of rules) of known anomalous behaviors
to be updated frequently to cope with new attacks.
On the other hand, such an approach would likely
be advantageous when it comes to deployment and
performance, especially in terms of understand abil-
ity. With the anomaly-based approach, patterns of
normal behaviors are defined, and anomaly detectors
would look for behaviors that deviate from the nor-
mal ones (Ilgun et al., 1995). This approach can de-
tect unknown attacks on connected vehicles and of-
ten needs rarer updates on its normal patterns. Par-
ticularly, Boumiza and Braham proposed an intrusion
detection system based on Hidden Markov Models
(Boumiza and Braham, 2019). Müter and Asaj mea-
sured information entropy and compared it with a nor-
mal threshold to detect anomalous events (Müter and
Asaj, 2011).
With the recent advancements in machine learn-
ing, researchers have started to use deep learning to
detect abnormal activities in-vehicle networks. Kang
et al. developed an intrusion detection system us-
ing Deep Neural Network (Kang and Kang, 2016).
Long Short-term Memory has also been used to de-
tect anomalous events in time-series data (e.g., se-
quence of data in order) (Taylor et al., 2016). While
advanced machine learning-based approaches have an
edge over traditional approaches, they lack clarity on
how an event is considered anomalous (e.g., why is
it considered abnormal). How a decision is made
by machine learning models has been largely over-
looked.
3 METHODOLOGY
RE XAD leverages unsupervised learning techniques
namely AutoEncoder to detect anomalous events.
IoTBDS 2022 - 7th International Conference on Internet of Things, Big Data and Security
18

X
1
Encoder
(LSTM)
Decoder
(LSTM)
Bottleneck
Input Reconstructed input
They should be similar (ideally identical)
X ≈ X’
X
2
X
3
…
Input sequence: X
Output sequence: X’
…
…
X
n
X’
1
X’
2
X’
3
…
…
…
X’
n
Figure 1: Overview of RE XAD’s architecture.
This means, labeled data is not needed for RE XAD to
learn. Instead, R E XAD learns from patterns of nor-
mal behaviors, and an anomalous behavior which de-
viates from the patterns would be deemed anomalous.
Figure 1 shows the architecture of our deep learning
model. Our first goal is to provide real-time feedback,
so we aim for an as simple yet effective model as pos-
sible. Therefore, we abstain from complex network
architectures (e.g., stacked AutoEncoder with hun-
dred of network units). Our model is essentially an
AutoEncoder with 2 LSTM layers (as input and out-
put) which can make sense of time series data. The
Encoder (input layer) encodes the input data while
the Decoder (output layer) reconstructs the encoded
data. The reconstructed data will be then compared
with the original input to identify reconstruction er-
rors. Given the normal data that our model learns
during the training phase, a specific threshold for re-
construction error can be set to later separate normal
and abnormal data. We opt for this very simple yet
effective network architecture because this can poten-
tially provide us with nearly instantaneous detection
results to be used in real-time detection. When the
model learns enough of normal data, the Decoder is
then capable of reconstructing the encoded data with
only minimal, acceptable loss (reconstruction error).
When the model receives anomalous data which devi-
ates from the normal patterns, the reconstructed data
will have a higher loss value than usual. Hence, such
data will be considered anomalous.
Further, we leverage PGDrive (Li et al., 2020) to
simulate cars running on the road and obtain a training
dataset. This also allows us to build different attack
scenarios to evaluate our model. Our model is then
integrated into PGDrive as a plugin to detect anoma-
lous events of on-the-road vehicles.
3.1 Training
PGDrive provides different options to drive a sim-
ulated car: manually, expert (trained deep learning
model), and combined. To create a training dataset,
we use the expert mode which simulates an au-
tonomous vehicle. The car would enter a trip and
try to complete with success. We let the car run
in the expert mode for nearly 12 hours to generate
training data (i.e., normal data). When a trip ends
(or the car crashes), a new trip will start with ran-
domized map configurations. In the end, we have
obtained 941,555 data records after excluding crash-
related data. Our original data includes 5 features:
speed, steering, distance to sides, throttle-brake, ve-
locity direction. We performed correlation analysis
to exclude features from pairs that were highly cor-
related (e.g., throttle brake vs. speed, distance to left
side vs. distance to right side, velocity direction vs.
speed). The final data contains 3 features: speed,
steering, and distance to right (the distance between
the vehicle and the right side of the road). The data
was split into training (80%) and validation (20%)
sets. Before training, we further applied data normal-
ization to scale data into standard ranges. Afterward,
a mean square error was used as a loss function to
measure the reconstruction error (difference between
original data and reconstructed data). The smaller the
error is, the better our model has learned and hence
can reconstruct an output sequence that is close to
its corresponding input sequence (ideally identical).
We trained our model with a time-step of 10, batch
size of 5012, and the LSTM layers (input and out-
put) with 128 hidden states. This combination dur-
ing our experiments provides us the best results while
requiring reasonable computational power (e.g., this
network configuration could also easily be trained on
CPUs), and providing nearly instantaneous detection
results (i.e., 8 milliseconds). We stopped training our
model when the training loss and validation loss did
A Real-time Explainable Anomaly Detection System for Connected Vehicles
19

not decrease any more. In our experiments, the opti-
mal number of epochs is 250, training time is 1 hour
8 minutes on a server with Nvidia Tesla V100 GPU
and 32GB RAM.
3.2 Identifying Error’s Threshold
The next step in our approach is to identify a thresh-
old that ideally separates normal data from abnor-
mal ones. If a reconstruction error exceeds a specific
threshold, it means the input sequence does not share
much similarity with the normal data that our model
has learned during the training phase. Hence, such
an input sequence would be considered anomalous.
To this end, we calculated the mean error that our
model produced when applying it to the training (nor-
mal) data. We sorted the error in ascending order and
took 99% as the threshold percentile. This means if
a reconstruction error is higher than 99% of the error
during the training phase, the corresponding input se-
quence will be considered anomalous. This resulted
in a mean threshold (of 3 features) of 0.0139 while
speed, steering, and distance-to-side have threshold
values of 0.0053, 0.0174, and 0.02 respectively.
3.3 Explaining Model Output
Our final goal is to make the output of our model
explainable. When the whole reconstruction error
of an output sequence to a given input sequence ex-
ceeds a specific threshold, RE XAD further calculates
the reconstructed error of each feature of the data se-
quence with the threshold. This provides information
on which feature contributes to the anomaly of the
event. For example, when speed is suddenly being
changed drastically (e.g., from 10 km/h to 60 km/h
within milliseconds) and such an event will be caught
by RE XAD. By calculating the reconstruction error
of the whole data sequence and each feature’s se-
quence separately RE XAD could attribute the source
of the anomaly to data features. Further, to make
more sense of the output, we calculate the distance
to the threshold of each feature of anomalous events.
This provides investigators information on how much
the current anomaly is e.g., reconstructed speeds error
exceeds a normal threshold by 1.0 (seemingly non-
negligible) or only by 0.001 (relatively small). Inves-
tigators can decide by themselves and prioritize the
detected anomalous events to examine.
4 EVALUATION
In this section, we describe our attack design and how
we performed these attacks to generate anomalous
events. We then describe the evaluation metrics that
we have used in our evaluation.
4.1 Attack Design
We extended PGDrive (Li et al., 2020) to simulate
realistic attack scenarios on connected vehicles. To
evaluate how well our system performs we built an
attack controller that can intercept network signals
of on-the-road vehicles. The attack-controller works
as an extension to PGDrive. Further, we assumed
that an attacker has already gained access to the in-
vehicle communication network. We used the attack
controller to perform three attack scenarios (Plateau
and Continuous attacks are inspired by the work of
Hanselmann et al. (Hanselmann et al., 2020)):
• Take-over attack: An attacker can get a foothold
in the automotive communication network and ar-
bitrarily change the signals. Thus, the attacker
would become the driver and directly control the
car.
• Plateau attack: An attacker changes the value of
a feature to a constant value over a period. The
value would immediately soar or drop to a specific
value.
• Continuous attack: To avoid detection of sud-
den value changes, the attacker would gradually
change a feature’s value to a target value. The
value will slowly be altered with small changes.
We further improved this attack by introducing
the change by a specific (relatively small) per-
cent of the current value. This attack hence has
two sub-types namely step changes and percent-
age changes.
Given the above attacks
2
, a malicious actor could per-
form dangerous actions that threaten the safety of the
driver and passengers in the car, as well as of other ve-
hicles (e.g., driving the car out of the road or collide
other vehicles). In the scope of this paper, we choose
the steering wheel to attack, however, the techniques
are applicable to all features (i.e., sensors).
While performing these attacks, the signal data
was gathered and assigned labels automatically.
2
We do not consider suppressing and flooding attacks in
our evaluation because these belong to denial of service at-
tack category and could be effectively detected (Wang et al.,
2002), (RoselinMary et al., 2013), and hence are out of
scope for this paper.
IoTBDS 2022 - 7th International Conference on Internet of Things, Big Data and Security
20
Specifically, when signals were intercepted by our at-
tack controller, the manipulated signals were labeled
as anomalous. Otherwise, signals that were not in-
tercepted by our attack controller were automatically
labeled as normal data. All of our attacks were per-
formed on (simulated) live vehicles. This provides
us insights on (1) how the attacks affect on-the-road
vehicles, and (2) how well our model performs in de-
tecting live anomalous activities.
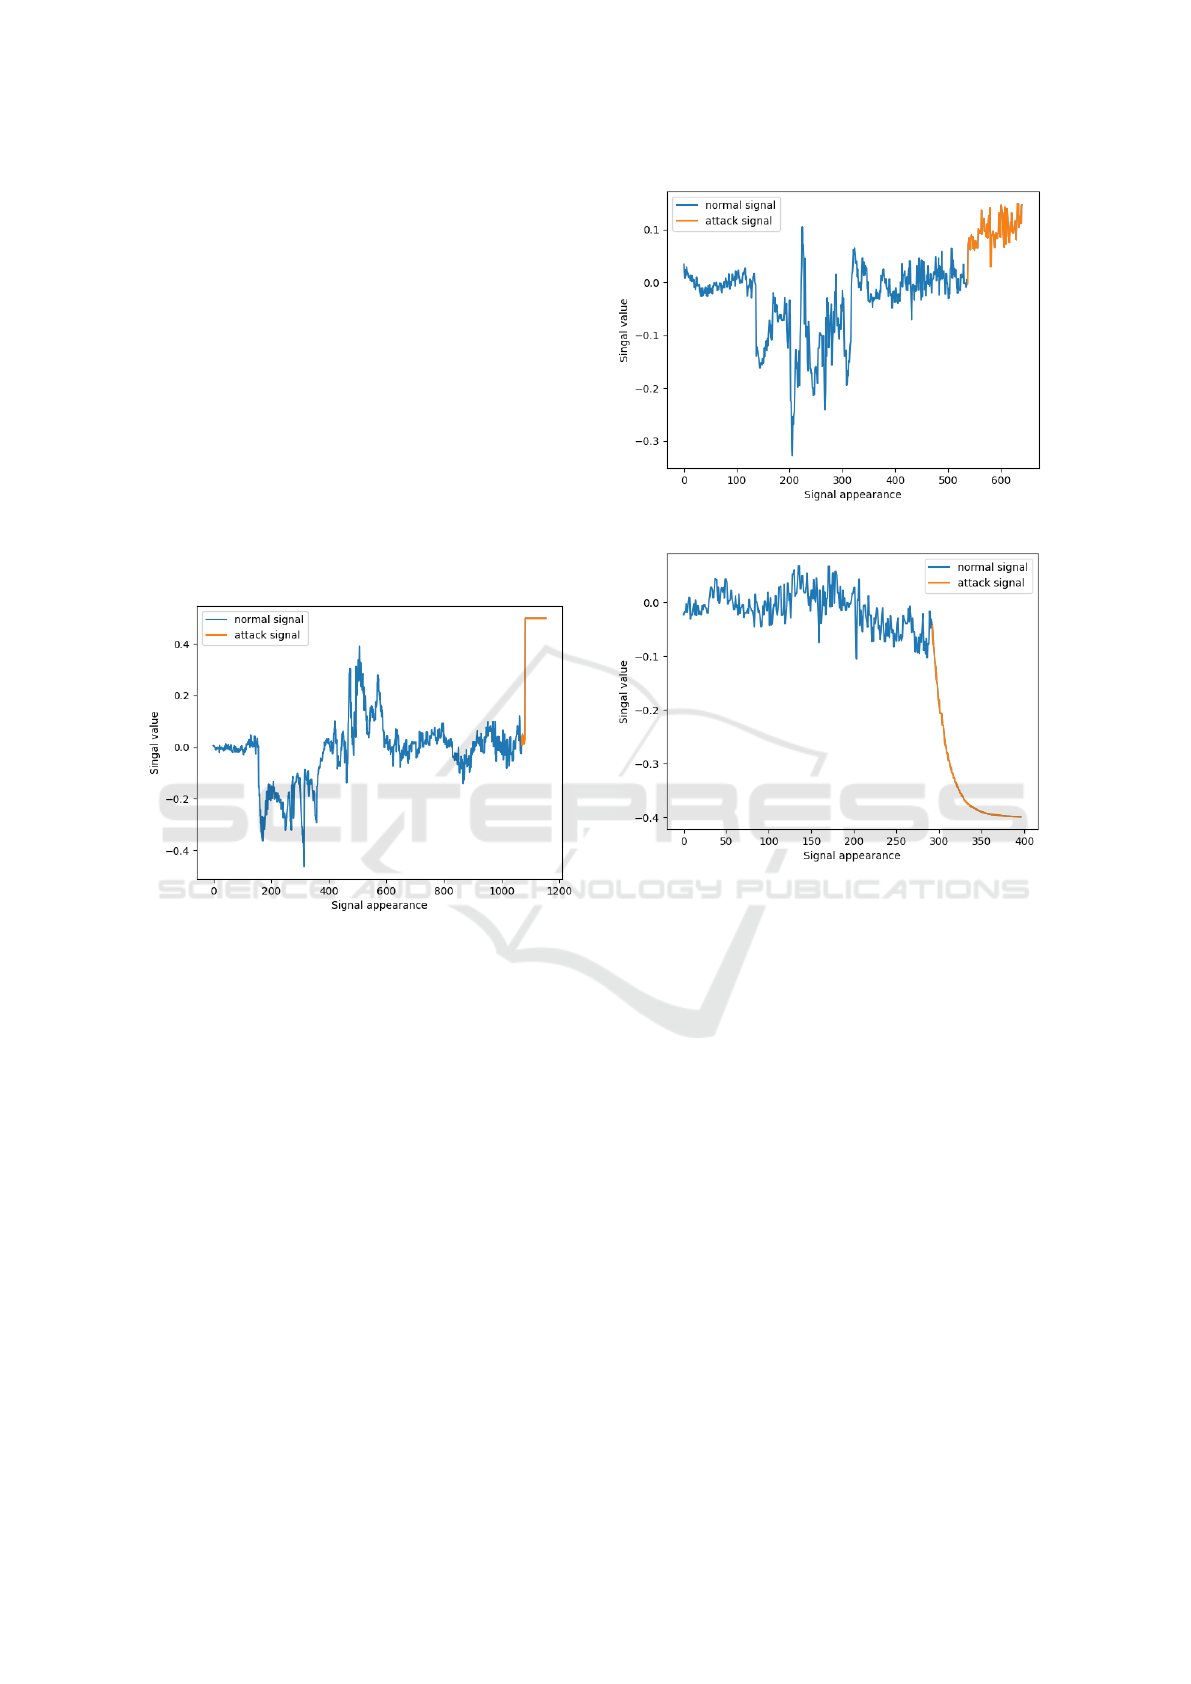
Figure 2 shows an example of a plateau attack
on the steering wheel of a live simulated car. We
can see that the signals change drastically when the
attack happens. This can be detected by conven-
tional anomaly detection systems (e.g., rule-based
approaches) because such significant changes would
yield a red flag to rule-based or signature-based ap-
proaches.
Figure 2: A plateau attack on the steering wheel.
Figure 3 shows an example of the take-over at-
tack. In this attack, the malicious actor could con-
trol the car in his own interest. An ideal anomaly de-
tection system should be able to distinguish different
drivers, hence could detect this type of attack. This at-
tack is more advanced than the plateau attack because
it usually does not yield any significant changes. This
makes it unlikely susceptible to conventional anomaly
detection systems.
Figure 4 shows an example of a continuous at-
tack on steering wheel signals. We could see that the
changes look, to some extent, similar to normal sig-
nals. In this example, the attacker has a target value
for the steering wheel and aims to slowly change the
steering wheel to this value by adding a specific per-
cent to the current value. In this example, 11.4% of
the previous value is added as a delta for the next val-
ues. The attacker repeats this process until the target
value is met. In this example, after 104 steps, the car
has been driven out of the road.
Figure 3: A take-over attack on the steering wheel.
Figure 4: A continuous attack on the steering wheel.
4.2 Evaluation Metrics
Given that our data is highly imbalanced, with most
of the data being normal while only a very small frac-
tion is anomalous, we opt for the AUC (JA and BJ.,
1982) as our evaluation metric. This also has been
shown as an effective and well-known measure for
imbalance classification (Chawla, 2005) (Prati et al.,
2004). A random guessing model has an AUC value
of 0.5 while a perfect model has an AUC value of 1.0.
5 RESULTS
We deployed our model on a 2.5 GHz Amazon
Workspace with 2 cores and 8GB of RAM to simu-
late on-the-road vehicles, and to detect live attack. In
this section, we describe our detection results, discuss
a running example for a better explanation, and pro-
vide a rough idea of how R E XAD performed compared
with prior works in similar directions.
A Real-time Explainable Anomaly Detection System for Connected Vehicles
21
5.1 Detection Results
In our evaluation, RE XAD could respond with detec-
tion results with-in 8 milliseconds. Table 1 provides
details of our evaluation with regard to the measured
AUC values. For each attack category, we ran 4 sepa-
rate attacks and recorded data. In total, we performed
16 separate attacks on live vehicles. All attacks were
detected by RE XAD. Specifically, 13 attacks (81.25%
of all attacks) resulted in crashes (i.e., fatal accidents)
or cars being driven out of the road. All in all, our
model has obtained a mean AUC value of 0.95. For
the cases in which RE XAD did not identify anomalous
events, they mostly belonged to the continuous attack
categories. This was due to the evasiveness of such at-
tacks where they tried to mimic driver’s behavior, and
only slightly modify a feature’s value. The first mod-
ified values have been considered normal by R E XAD,
however, such attacks have been all eventually de-
tected by RE XAD. We provide a running example in
the following section for better clarity.
Table 1: Model evaluation.
Attack AUC value
Continuous step 1 0.94
Continuous step 2 0.96
Continuous step 3 0.96
Continuous step 4 0.96
Plateau 1 0.98
Plateau 2 0.97
Plateau 3 0.98
Plateau 4 0.97
Takeover 1 0.96
Takeover 2 0.95
Takeover 3 0.94
Takeover 4 0.93
Continuous percentage 1 0.98
Continuous percentage 2 0.95
Continuous percentage 3 0.87
Continuous percentage 4 0.92
Mean AUC 0.95
5.2 A Running Example
Applying RE XAD on the attack described in Figure
4 (in Section 4), RE XAD could detect the anoma-
lous events with an AUC value of 0.98. Specifically,
it missed the first 38 signals due to the evasiveness
of such an attack. The attack only slightly changed
the current value of a sensor (e.g., steering wheel) to
evade anomaly detection systems. RE XAD could de-
tect the attack within an interval of 38 signals, and
with a distance of 76 signals before the car was driven
out-of-road.
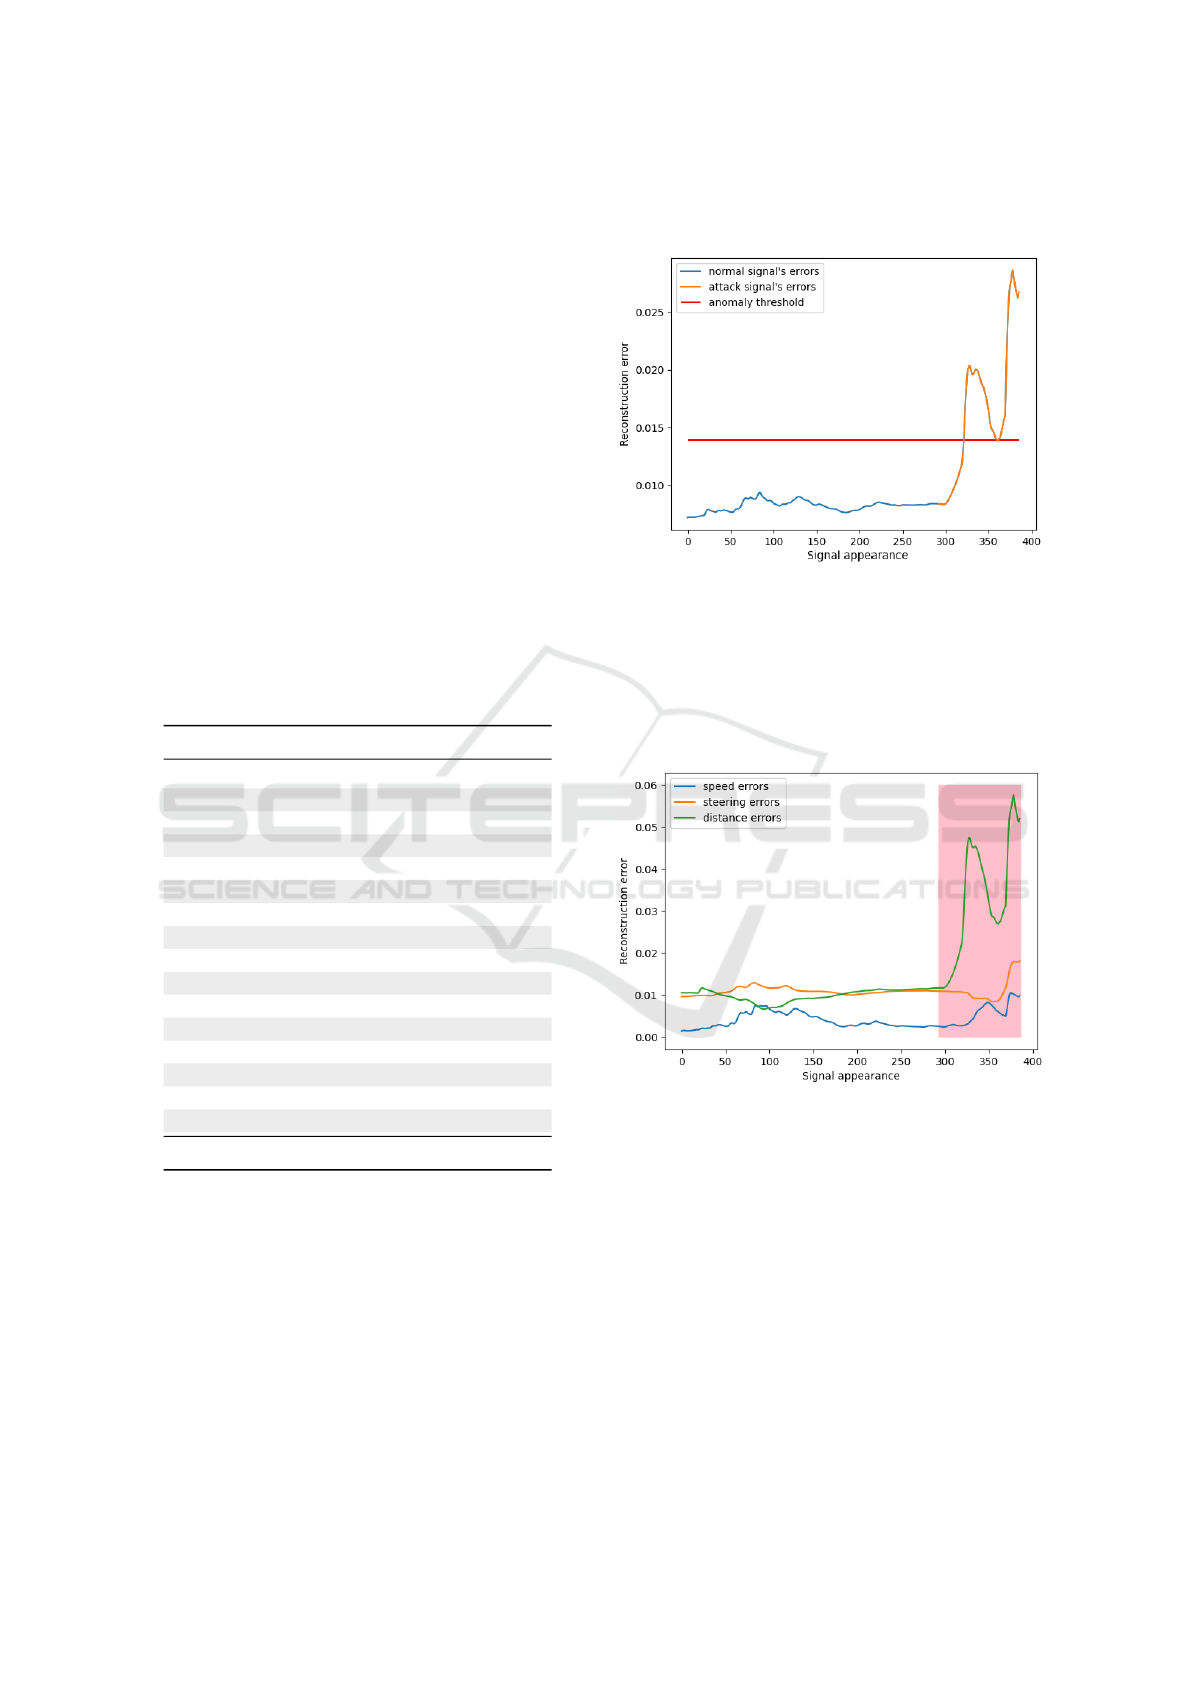
Figure 5: Reconstruction errors of the attack in Figure 4.
Figure 5 shows the reconstruction errors of normal
signals (before the attack) and the malicious signals
(during the attack) of the attack illustrated in Figure
4. Prior works on deep learning techniques to detect
anomalies would usually stop here with a binary out-
come e.g., there is an anomalous event at time t.
Figure 6: Reconstruction error of each feature of the attack
in Figure 4. The malicious signal’s window is marked in
pink.
With R E XAD we further provide the source attri-
bution of such anomalous events. Figure 6 shows the
reconstruction errors of each feature in our model. We
can see that steering and distance to side have higher
error values. Additionally, having separate thresholds
for each feature, RE XAD could then provide better in-
sights on how far a specific feature’s reconstruction
error exceeds the given threshold (e.g., how much
anomalous an event is, and how much anomaly is at-
tributed by each feature). When an inspector obtains
such a result, (s)he can immediately start looking at
distance to side first to examine.
IoTBDS 2022 - 7th International Conference on Internet of Things, Big Data and Security
22

5.3 Comparison with Prior Work
To compare RE XAD with prior works we would need
to train different models using the same dataset. How-
ever, we have different configurations (e.g., sam-
pling rate, different sets of features, etc.,). There-
fore, a close comparison is not possible unless two
approaches use the same benchmarks to evaluate their
models. Unfortunately, such benchmarks do not ex-
ist yet, to the best of our knowledge. In this sec-
tion, we only wish to provide a rough idea of how
RE XAD performs in comparison with other works in
the fields. Though, the goal of RE XAD is completely
different from any prior works: real-time and explain-
able anomaly detection.
Compared with LATTE (Kukkala et al., 2021) — a
recent work on leveraging deep learning techniques
for detecting anomaly in vehicles — RE XAD has a
substantially higher AUC value (0.95 vs. 0.79). Com-
pared with CANet (Hanselmann et al., 2020) R E XAD
has comparable AUC scores. However, RE XAD’s net-
work architecture is much simpler which is better
suited for real-time detection. This is also a strong dif-
ference between RE XAD and CANet where we focused
on Interpretation of the results and Real-time detec-
tion while CANet focused on high dimensional input
data. Besides, attacks evaluated on CANet were con-
ducted on offline data while attacks on RE XAD were
conducted on live simulated vehicles.
6 DISCUSSION
6.1 Real-time Explainable Anomaly
Detection
This work shows that with a simple network architec-
ture for AutoEncoder (single input LSTM layer and
single output LSTM layer), we can effectively detect
anomalous events in-vehicle communication network
(e.g., AUC value of 0.95). Given its simplicity, we can
easily integrate our approach into the existing system
with a response time of only 8 milliseconds.
Further, by calculating the distance to (ab)normal
threshold of the whole data sequence as well as of
each separate feature, we can provide source attribu-
tion of the anomalous events. This makes our sys-
tem explainable which sets it apart from prior work
on anomaly detection using deep learning techniques.
When an anomalous event takes place on a vehicle’s
communication network, such an event would usually
be reported to the central hub for further (often man-
ual) investigation. Explainability makes such a task
easier to perform. In this case, an investigator can im-
mediately prioritize the events with higher anomalous
error and focus on features that contribute the most to
the anomaly score.
Explainability. In this work, we provide details of
anomaly attribution and the extent of anomaly (e.g.,
how much the current anomalous event is). Prior
works could also make use of LIME (Ribeiro et al.,
2016) or SHAP (Lundberg and Lee, 2017) to approxi-
mate black-box models to provide explanation of their
outputs. LIME are often used in classification (i.e., la-
beled data) while SHAP could be used to explain deep
learning models. In our work, we have access to our
deep learning model internally, hence using such ap-
proaches is considered out of scope.
6.2 End-to-end Solution for Anomaly
Detection Systems
In this work, we only focus on an anomaly detec-
tion system with the assumption that an attacker has
already gained access to in vehicle’s communication
network and can arbitrarily manipulate network mes-
sages. To have a complete end-to-end solution, it is
desirable to have additional security mechanisms to
prevent (to a certain extent) such malicious accesses
in the first place such as having a firewall, using con-
ventional static approaches. Additionally, a central
hub for managing security alerts and taking actions
accordingly would be an integral part of an end-to-
end solution.
Finally, in this paper, actions to take when anoma-
lous events are detected are considered out of scope.
This is however an important part of incident re-
sponse. Future work could investigate solutions to
safely guard and take actions when such an event hap-
pens to protect the safety of vehicle’s passengers.
6.3 Federated Learning for Vehicle’s
Anomaly Detection
Learning from a single vehicle would not make an
anomaly detection system robust while having data
from multiple vehicles is desirable to build an effec-
tive and robust anomaly detection system in practice.
This however comes with a catch, namely the security
and privacy of car users. As car users, we would not
want all our information sent to central servers for any
purpose due to privacy (and security) reasons. Feder-
ated learning (Kone
ˇ
cn
`
y et al., 2016) comes nicely in
to tackle this challenge, especially with the nature of
cars being equipped with multiple (sensitive) sensors.
A Real-time Explainable Anomaly Detection System for Connected Vehicles
23

With federated learning, each vehicle will train an al-
gorithm (e.g., AutoEncoder with LSTM) on their own
and only provides model weights to a central server.
The central server then will aggregate a global model
using necessary information (e.g., weights) provided
by all vehicles without owning the vehicle’s data.
Such a model could then be used by every vehicle.
Future work could investigate such a system to avoid
security & privacy concerns of car users.
6.4 Limitations
In this work, we only consider 3 features (after ex-
cluding highly correlated ones), while other poten-
tially interesting features could be studied such as
GPS, wheel pressure, etc. This is yet an inherited lim-
itation of the simulation we used. Future work could
investigate simulation techniques that take into ac-
count more useful sensor information (and vehicle’s
environment) to study different vehicle’s anomaly de-
tection settings.
While the output of our model is explainable, we
cannot provide a generalization of the predictions e.g.,
a specific characteristic that makes an input sequence
(or a feature of an input sequence) anomalous. This
is indeed a limitation of our work. However, to the
best of our knowledge, existing works in the field of
Explainable AI also only provide an approximation
of black-box models to explain them with potential
biases, high-performance overhead, etc.
Further, with the limited outcome scenarios in the
simulator we use, we can only gather info on whether
the car crashes, run out-of-road, or run over lanes.
Future work could develop new simulators that pro-
vide information on the passenger and their interac-
tion with the vehicles so we could ideally study their
safety under the different advanced attacks.
Besides, there is a certain delay in detecting
anomalous events in the (advance) continuous attacks.
Within an average interval of 30 - 40 records (300 -
400 milliseconds), RE XAD could detect the anoma-
lous events but not immediately. This however is part
of the attack’s nature e.g., only slightly changing the
value to evade anomaly detection. Future work could
investigate approaches to immediately detect such at-
tacks e.g., using more advanced deep learning tech-
niques.
Finally, we cannot closely compare our work with
existing work in similar directions due to the lack
of benchmarks. Despite having different goals (i.e.,
our distinguish goal was a real-time, explainable
anomaly detection system), it would be desirable to
see how RE XAD and other approaches work on the
same datasets. Future work could investigate com-
mon benchmarks to evaluate anomaly detection sys-
tems for connected vehicles.
7 CONCLUSION
This paper proposes a real-time explainable anomaly
detection system namely RE XAD. Our approach lever-
ages state-of-the-art deep learning techniques namely
LSTM and AutoEncoder to detect anomalies. To eval-
uate R E XAD we designed and implemented 4 differ-
ent attack categories. Our evaluation proves that de-
spite using a simple network configuration RE XAD
could effectively detect (advance) anomalous events
in connected vehicles i.e., AUC value of 0.95 and a
response time of 8 milliseconds. By testing R E XAD
in a simulated environment, our work provides in-
sights on the outcome of different attacks, and how
such an anomaly detection system could detect the at-
tacks in advance. Further, our work calls for actions to
further investigate and integrate real-time explainable
advanced machine learning techniques to anomaly de-
tection in connected vehicles on on-the-road vehicles.
REFERENCES
Boumiza, S. and Braham, R. (2019). An efficient hidden
markov model for anomaly detection in can bus net-
works. In 2019 International Conference on Software,
Telecommunications and Computer Networks (Soft-
COM), pages 1–6.
Chawla, N. V. (2005). Data Mining for Imbalanced
Datasets: An Overview, pages 853–867. Springer US,
Boston, MA.
Checkoway, S., McCoy, D., Kantor, B., Anderson, D.,
Shacham, H., Savage, S., Koscher, K., Czeskis, A.,
Roesner, F., and Kohno, T. (2011). Comprehensive
experimental analyses of automotive attack surfaces.
In Proceedings of the 20th USENIX Conference on Se-
curity, SEC’11, page 6, USA. USENIX Association.
Hanselmann, M., Strauss, T., Dormann, K., and Ulmer, H.
(2020). Canet: An unsupervised intrusion detection
system for high dimensional can bus data. IEEE Ac-
cess, 8:58194–58205.
Hochreiter, S. and Schmidhuber, J. (1997). Long Short-
Term Memory. Neural Computation.
Ilgun, K., Kemmerer, R., and Porras, P. (1995). State tran-
sition analysis: a rule-based intrusion detection ap-
proach. IEEE Transactions on Software Engineering,
21(3):181–199.
JA, H. and BJ., M. (1982). The meaning and use of the area
under a receiver operating characteristic (roc) curve.
Radiology, pages 29–36.
Kang, M.-J. and Kang, J.-W. (2016). Intrusion detection
system using deep neural network for in-vehicle net-
work security. PloS one, 11(6):e0155781–e0155781.
IoTBDS 2022 - 7th International Conference on Internet of Things, Big Data and Security
24

Kone
ˇ
cn
`
y, J., McMahan, H. B., Yu, F. X., Richtárik, P.,
Suresh, A. T., and Bacon, D. (2016). Federated learn-
ing: Strategies for improving communication effi-
ciency. NIPS Workshop on Private Multi-Party Ma-
chine Learning.
Koscher, K., Czeskis, A., Roesner, F., Patel, S., Kohno, T.,
Checkoway, S., McCoy, D., Kantor, B., Anderson, D.,
Shacham, H., and Savage, S. (2010). Experimental
security analysis of a modern automobile. In 2010
IEEE Symposium on Security and Privacy, pages 447–
462.
Kukkala, V. K., Thiruloga, S. V., and Pasricha, S. (2021).
Latte: Lstm self-attention based anomaly detection in
embedded automotive platforms. ACM Transactions
on Embedded Computing Systems (TECS), 20(5s):1–
23.
Li, Q., Peng, Z., Zhang, Q., Qiu, C., Liu, C., and Zhou,
B. (2020). Improving the generalization of end-to-end
driving through procedural generation. arXiv preprint
arXiv:2012.13681.
Lundberg, S. M. and Lee, S.-I. (2017). A unified ap-
proach to interpreting model predictions. In Guyon, I.,
Luxburg, U. V., Bengio, S., Wallach, H., Fergus, R.,
Vishwanathan, S., and Garnett, R., editors, Advances
in Neural Information Processing Systems 30, pages
4765–4774. Curran Associates, Inc.
Mitchell, R. and Chen, I.-R. (2012). Specification based
intrusion detection for unmanned aircraft systems. In
Proceedings of the First ACM MobiHoc Workshop on
Airborne Networks and Communications, Airborne
’12, page 31–36, New York, NY, USA. Association
for Computing Machinery.
Müter, M. and Asaj, N. (2011). Entropy-based anomaly
detection for in-vehicle networks. In 2011 IEEE In-
telligent Vehicles Symposium (IV), pages 1110–1115.
Noble, C. C. and Cook, D. J. (2003). Graph-based anomaly
detection. In Proceedings of the Ninth ACM SIGKDD
International Conference on Knowledge Discovery
and Data Mining, KDD ’03, page 631–636, New
York, NY, USA. Association for Computing Machin-
ery.
Prati, R. C., Batista, G. E. A. P. A., and Monard, M. C.
(2004). Class imbalances versus class overlapping:
An analysis of a learning system behavior. In Mon-
roy, R., Arroyo-Figueroa, G., Sucar, L. E., and Sossa,
H., editors, MICAI 2004: Advances in Artificial Intel-
ligence, pages 312–321, Berlin, Heidelberg. Springer
Berlin Heidelberg.
Ribeiro, M. T., Singh, S., and Guestrin, C. (2016). "why
should i trust you?": Explaining the predictions of any
classifier. In Proceedings of the 22nd ACM SIGKDD
International Conference on Knowledge Discovery
and Data Mining, KDD ’16, page 1135–1144, New
York, NY, USA. Association for Computing Machin-
ery.
RoselinMary, S., Maheshwari, M., and Thamaraiselvan, M.
(2013). Early detection of dos attacks in vanet using
attacked packet detection algorithm (apda). In 2013
international conference on information communica-
tion and embedded systems (ICICES), pages 237–240.
IEEE.
Rumelhart, D. E., Hinton, G. E., and Williams, R. J. (1986).
Learning Internal Representations by Error Propaga-
tion, page 318–362. MIT Press, Cambridge, MA,
USA.
Taylor, A., Leblanc, S. P., and Japkowicz, N. (2016).
Anomaly detection in automobile control network
data with long short-term memory networks. 2016
IEEE International Conference on Data Science and
Advanced Analytics (DSAA), pages 130–139.
Wang, H., Zhang, D., and Shin, K. G. (2002). Detecting syn
flooding attacks. In Proceedings. Twenty-First Annual
Joint Conference of the IEEE Computer and Com-
munications Societies, volume 3, pages 1530–1539.
IEEE.
A Real-time Explainable Anomaly Detection System for Connected Vehicles
25
