
Fairness of In-session Dropout Prediction
Nathalie Rzepka
1
, Katharina Simbeck
1
, Hans-Georg Müller
2
and Niels Pinkwart
3
1
Hochschule für Technik und Wirtschaft, Treskowallee 8, Berlin, Germany
2
Department of German Studies, University of Potsdam, Potsdam, Germany
3
Department of Computer Science, Main University, Berlin, Germany
Keywords: Fairness, Dropout Prediction, Algorithmic Bias.
Abstract: The increasing use of machine learning models in education is accompanied by some concerns about their
fairness. While most research on the fairness of machine learning models in education focuses on
discrimination by gender or race, other variables such as parental educational background or home literacy
environment are known to impact children's literacy skills too. This paper, therefore, evaluates three different
implementations of in-session dropout prediction models used in a learning platform to accompany German
school classes with respect to their fairness based on four different fairness measures. We evaluate the models
for discrimination of gender, migration background, parental education, and home literacy environment.
While predictive parity and equal opportunity are rarely above the defined threshold, predictive equality and
slicing analysis indicate that model quality is slightly better for boys, users with higher parental education,
users with less than ten books, and users with a migrant background. Furthermore, our analysis of the temporal
prediction shows that with increasing accuracy of the model, the fairness decreases. In conclusion, we see that
the fairness of a model depends on 1) the fairness measure, 2) the evaluated demographic group and 3) the
data with which the model is trained.
1 INTRODUCTION
Algorithmic decision-making processes are playing
an increasing role in all areas of life. In addition to
education, AI models are used in marketing,
healthcare, human resources, and economics.
However, the assumption that all decisions made by
algorithms are fair and objective has already been
refuted in numerous studies. One example for
algorithmic bias is the application of a computer
calculated score (risk assessment) to predict the
likelihood of criminals to relapse that has been proven
to be discriminatory against defendants of black skin
color, mislabeling them as high risk almost twice as
often as defendants of white skin color (Angwin et al.
2016). Experiments testing the performance of
different face recognition algorithms have shown
both the commercial and the nontrainable algorithms
to be racially and sexually biased, having lower hit
accuracies when it comes to certain cohorts (females,
blacks, age 18-30) compared to the remaining cohorts
within their demographics (Klare et al. 2012). A study
using the Google Translate API to translate sentences
from gender-neutral languages into English has
shown the program’s tendency to use male defaults,
especially in sentences related to male dominated
fields such as STEM jobs (Prates et al. 2020).
The growing use of machine learning models in
educational contexts therefore goes hand in hand with
concerns about their fairness. Many studies have
already evaluated different applications and found
discriminatory tendencies. For example, in (Gardner
et al. 2019; Hu and Rangwala 2020; Riazy and
Simbeck 2019). In their review, Baker et al. (2021)
criticize the fact that most studies examine
discrimination based on gender and race - other
characteristics are considered much less frequently.
However, especially in the case of discrimination by
models in education, other factors are crucial. This is
because many studies have already shown that
educational success is strongly linked to the social
background of the family (Carroll et al. 2019; Lee and
Burkam 2007; Steinlen and Piske 2013). Bias in the
educational context can become relevant, for
example, when implementing dropout prediction
models. Dropout prediction models in massive open
online courses (MOOCs) or higher education have
already been created extensively in many studies
316
Rzepka, N., Simbeck, K., Müller, H. and Pinkwart, N.
Fairness of In-session Dropout Prediction.
DOI: 10.5220/0010962100003182
In Proceedings of the 14th International Conference on Computer Supported Education (CSEDU 2022) - Volume 2, pages 316-326
ISBN: 978-989-758-562-3; ISSN: 2184-5026
Copyright
c
2022 by SCITEPRESS – Science and Technology Publications, Lda. All rights reserved

(Tasnim et al. 2019; Okubo et al. 2017; Stapel et al.
2016; Sun et al. 2019; Wang et al. 2017; Xing and Du
2019).
In our setting, we consider different
implementations of a temporal in-session dropout
prediction model that has been created in the context
of an online learning platform for German spelling
and grammar skills. The platform is mainly used in
secondary school lessons and offers various exercises
in all orthographic domains. Since the temporal in-
session dropout prediction model we studied is
applied in school lessons, it differs from MOOCs in
some respects: the homework assigned there is
obligatory for students and the time frame is also not
individual, but set by the teachers. Dropouts in
MOOCs also differ from dropouts on our platform, as
in the German school system you cannot drop through
a course, but only through the whole grade level. We
therefore consider the in-session dropout, i.e. the
early termination of a session without finishing the
assignments. From a didactic point of view it is
preferable that learners complete a set of excercises
in one training session. Dropping out early, e.g. due
to frustration, stops the learning process. Despite the
differences to MOOCs, we believe it is useful to
investigate platforms used in the school context to
find out more about the integration of online learning
in the classroom.
To evaluate the models in terms of their fairness,
we consider not only classical variables such as
gender and migration background, but also parental
educational background and home literacy
environment (HLE). For this purpose, we proceed as
follows: first, we will summarize the theoretical
foundations of algorithmic bias and fairness and of
dropout prediction. Then, we will describe the study
setting, including the data set, the in-session dropout
prediction models and the different groups for whose
discrimination the model is examined. The selected
fairness measures will then be calculated per group
and model and interpreted.
2 RELATED WORK
2.1 Algorithmic Bias
In education, machine learning based models are used
for example in dropout- or at-risk predictions,
adaptive learning environments which give
personalized feedback and correction, automated
scoring systems, or identification of struggling
students (Kizilcec and Lee 2020). As interventions,
feedback or scoring has a huge impact on the
students’ educational path, these applications and
models should be evaluated regarding fairness.
Algorithmic fairness, however, is discussed not only
in educational contexts but in almost all aspects of our
lives (Hajian et al. 2016; O'Neil 2016).
When talking about algorithmic fairness, the
term algorithmic bias is often used as well. However,
the terms are not synonymous: in the Merriam
Webster dictionary bias is defined as "a tendency to
believe that some people, ideas, etc., are better than
others that usually results in treating some people
unfairly" (Merriam-Webster Dictionary 2021a). Bias
can occur in different stages of machine learning, and
thus can lead to unfair models. Fairness is defined as
"the quality or state of being fair; especially fair or
impartial treatment; lack of favoritism toward one
side or another." (Merriam-Webster Dictionary
2021b). We therefore start with the description of
causes and origins of bias. Later on we introduce
disadvantaged groups and describe different fairness
metrics.
2.1.1 Causes and Origins of Algorithmic
Bias
There are different attempts to define causes or to
locate the sources of biases in machine learning
models (Pessach and Shmueli 2020). Pessach and
Shmueli for example differentiate between four
causes. The first one derives from bias in the dataset
which is replicated by the machine learning models.
The second one describes bias origins from missing
data or data selection biases which result in not
representative datasets. Further, there could be proxy-
attributes which are non-sensitive attributes that
derive from sensitive attributes. Lastly, if the goal is
to minimize the overall aggregated prediction error, a
model could benefit the majority group over
minorities (Pessach and Shmueli 2020). Mitchell et
al. categorize two components of biased data,
statistical bias and societal bias (Mitchell et al. 2021).
Statistical bias occurs in the mismatch between the
training sample and the reality, e.g., when the dataset
is not representative. Societal bias, on the other hand,
reflects the world as it is and replicates pre-existing
discrimination in reality (Mitchell et al. 2021).
2.1.2 Disadvantaged Groups
There are several groups that can be discriminated
against by machine learning model implementations.
Some group characteristics are protected by law, such
as gender, race, ethnicity, sexual orientation, religion,
or disability (Baker and Hawn 2021). However,
discrimination goes beyond that. Most research on
Fairness of In-session Dropout Prediction
317

educational practices focuses on fairness regarding
gender, race, and nationality (Baker and Hawn 2021).
Research on gender-related discrimination thus
defines only two groups of gender (male and female)
without considering non-binary or transgenders.
Baker and Hawn (2021) argue that there is a huge
research gap on bias in education considering other
disadvantaged groups, such as urbanicity,
socioeconomic status, native language, disabilities,
speed of learning or parental education background.
2.2 Definitions and Measures for
Fairness
There are various measures of algorithmic fairness,
which are comprehensively described in (Kizilcec
and Lee 2020; Mitchell et al. 2021; Verma and Rubin
2018). There is no ground truth in measuring fairness
and different measures should be chosen based on the
context, as they come with different advantages or
disadvantages (Pessach and Shmueli 2020). All
fairness criteria cannot be satisfied simultaneously
(Pessach and Shmueli 2020). Most of the measures
are statistical and rely on the confusion matrix: true
positive (TP), false positive (FP), false negative (FN),
true negative (TN). In their work, Verma and Rubin
(2018) group fairness metrics into three categories:
Definitions based on predicted outcome (1) focus
solely on the predictions for different demographic
distributions and do not consider the actual outcome.
Definitions based on predicted and actual outcomes
(2), on the other hand, consider both. Definitions
based on predicted probabilities and actual outcome
(3) use the predicted probability score instead of the
binary prediction outcome. Kizilcec and Lee (2020)
define three statistical notions of fairness:
independence, separation, and sufficiency.
Independence is satisfied if the protected and
unprotected groups have the same opportunity for a
predicted outcome. Separation and Sufficiency, on
the other hand, go further and do not only consider
prediction outcome but also actual outcome.
Separation requires therefore that an algorithm’s
prediction is correct and incorrect at similar rates for
different groups (Kizilcec and Lee 2020). Sufficiency
is satisfied if the proportions of correctly predicted
forecasts are equal across subgroups (Baker and
Hawn 2021).
To validate a machine learning model for
fairness, accuracy metrics are used to evaluate how
much the effectiveness of the predictive model differs
between the respective subgroups. Once the
difference in accuracy of a predictive model from two
groups exceeds a threshold, the algorithm is
considered discriminatory because demographic
parity is no longer ensured (Riazy and Simbeck
2019).
In the following, we describe four notions of
fairness that will be used in the later model
evaluation. Note, however, that there are much more
measures of fairness extensively described in other
work, for example in (Verma and Rubin 2018). We
define 𝑆 as the protected variable, 𝑌 as the attribute to
be predicted and 𝑅 as the prediction outcome.
One definition based on predicted and actual
outcomes is predictive parity (PP), which is
satisfied if both subgroups have equal predictive
positive value (Verma and Rubin 2018). Predictive
positive value is defined by
𝑃𝑃𝑉 =
𝑇𝑃
𝑇𝑃 + 𝐹𝑃
(1)
and often referred to as precision. Formally,
predictive parity is defined as:
P(Y =1
|
R=1,S=s1)=P(Y =1
|
R =1,S = s2) (2)
Predictive Equality (PE) is a classifier satisfied
if both subgroups have equal false positive
rates
(Verma and Rubin 2018). False positive rate is
defined by
𝐹𝑃𝑅 =
𝐹𝑃
𝐹𝑃 + 𝑇𝑁
(3)
Respectively, predictive equality is defined as:
P(R =1
|
Y=0,S=s1)=P(R =1
|
Y =0,S = s2) (4)
Equal Opportunity (EO) is satisfied, if both
groups have equal false negative rates (Verma and
Rubin 2018). False negative rate is defined by
𝐹𝑁𝑅 =
𝐹𝑁
𝑇𝑃 + 𝐹𝑁
(5)
Subsequently, equal opportunity is defined by:
P(R =0
|
Y=1,S=s1)=P(R =0
|
Y =1,S = s2) (6)
Slicing Analysis (SA) demands equal AUROC.
The receiver operating characteristic curve plots TPR
against FPR at different thresholds. From that the area
under the curve can be calculated using an integration
process.
2.3 Dropout Prediction
Predicting students’ dropout is one of the major
research interests in educational data mining (Dalipi
CSEDU 2022 - 14th International Conference on Computer Supported Education
318

et al. 2018; Luan and Tsai 2021). Many investigations
focus on student dropout in MOOCs and higher
education (Dalipi et al. 2018; Prenkaj et al. 2020).
The huge dropout rates can either be student-related,
MOOC- related, or both (Dalipi et al. 2018). Student-
related reasons for dropping out are especially lack of
motivation, but also lack of time or insufficient
background knowledge and skills (Dalipi et al. 2018).
Course design or lack of interactivity, as well as
hidden costs, are MOOC-related reasons for dropping
out (Dalipi et al. 2018). Other than in MOOCs,
dropout in higher education is defined differently, for
example by learning behavior, by passing a course, or
earning a certificate (Sun et al. 2019).
The data for dropout prediction models is
mostly student engagement data, clickstream data
(Dalipi et al. 2018), or student behavior data (Jin
2020). Other features can describe the student
demographic, assignment grades, or social network
analysis (Sun et al. 2019). Liang et al. (2016) define
the data flow in dropout prediction models in eight
stages. First, there is the user raw behavior log
containing raw data. After that, the data is cleaned and
pre-processed which results in a user table and action
table. Then, feature engineering is performed and, if
necessary, the predictors are labeled. The data is
subsequently split into training and test sets and a
binary classification model is tuned. As a result, and
the last stage of data flow, the predictive model is
calculated.
Prenkaj et al. (2020) differentiates between two
cases of dropout prediction: plain dropout
formulation and recurrent dropout formulation. While
the plain dropout formulation is independent in time,
the recurrent dropout formulation uses information
from previous phases/ weeks to predict the dropout
status of a student. Xing and Du (2019) define similar
categories which they call fixed-term and temporal
dropout prediction. Temporal models are modeled for
each week separately and use data only until the
current week. The advantage of this is that
developments during the course are considered and
interventions can be made each week. In temporal
dropout prediction, course activity features change
within each week whereas profile data or course data
features are static (Hagedoorn and Spanakis 2017).
The prediction strategy can be classified into
three categories: analytics examination, classic
learning methods, and deep learning (Prenkaj et al.
2020). Analytic examination describes the use of
basic statistics while classic learning methods include
traditional machine learning models. The most
commonly used machine learning algorithms in
student dropout prediction are logistic regression,
decision tree classifier, and support vector machines
(Dalipi et al. 2018). However, various models have
been implemented to tackle different purposes of
dropout prediction. Sun et al. (2019), for example,
used a temporal model based on a recurrent neural
network (RNN). This is advantageous because there
is no need for feature engineering as the clickstream
log data can be directly fed into the model. To
perform a temporal prediction mechanism, Xing and
Du’s model is as well built using a deep learning
algorithm, which calculates dropout probability rates
to prioritize interventions for at-risk students (Xing
and Du 2019). Wang et al. (2017) proposed a
combination of a convolutional neural network and
recurrent neural network for a dropout prediction
model to be able to skip the manual feature selection
process. Other researchers use Ada boost (Hagedoorn
and Spanakis 2017), random forest (Del Bonifro et al.
2020), or survival analysis (Chen et al. 2018).
In their review, Shahiri et al. (2015) discussed
important attributes on predicting student
performance. One of the most frequent attributes is
cumulative grade point average (CGPA), which has
been shown to be the most significant input variable
in a coefficient correlation analysis (Shahiri et al.
2015). Internal assessments, for example in a quiz or
assignments are another valuable attribute to predict
student performance. Attributes of students
demographic include gender, age, family
background, and disability and are as well often used
(Shahiri et al. 2015). Further attributes are extra-
curricular activities, high school background, or
social interaction network (Shahiri et al. 2015).
3 RESEARCH QUESTIONS &
STUDY SETTING
Although there are many articles on dropout
prediction models, this paper explores some aspects
that have not been studied before. We investigate the
discriminatory potential of in-session dropout
prediction models, not classical MOOC dropout
predictions. Furthermore, we consider different
fairness metrics and compare different ML
implementations. We also consider rarely studied
demographic features, such as HLE and parental
education. Our research questions are therefore as
follows:
RQ1: How fair are in-session dropout prediction
models considering different fairness measures?
Fairness of In-session Dropout Prediction
319

RQ2: What is the potential for discrimination by in-
session dropout prediction models for different
demographic groups?
RQ3: How do different ML implementations of
prediction models differ with respect to their
discrimination potential?
Our data is obtained from the platform
orthografietrainer.net, an online learning platform for
the acquisition of spelling skills of the German
language. The in-session dropout prediction model
was trained with learning process data from this
platform and predicts whether a user will end a
session early or not. A session is considered exited
early, if the session is left without completing the
assigned set of exercises.
The goal is to be able to intervene during the
processing of an assignment to support the user in
successfully completing the session. The evaluation
of the model in terms of fairness will look at different
demographic groups. To find out about the users’
demographic characteristics, a survey is carried out.
The prediction model is then applied to the different
groups and the results are examined with different
fairness metrics. In the following, the study is
described by the data set, the prediction model, and
the fairness evaluation method.
3.1 Data Set
The online learning platform orthografietrainer.net
offers exercises for spelling and grammar skills, for
example for capitalization, separate and compound
spelling, or comma formation. The target group
ranges from fifth grade to graduating classes, as well
as users from adult education or students at
university. The platform is mainly used by teachers to
assign homework to students, which can then be
solved on the platform. The users receive automated
corrections, and the teachers can then view an
evaluation. Due to the Covid-19-pandemic, access
numbers have risen sharply, which shows that the
platform was used in distance learning formats.
The data set consists of 181,792 sessions from
52,032 users and all assignments were performed
between 1
st
of March and 31
st
of April 2020.
To measure fairness, we use both, variables that
derive from the registration process such as gender,
and variables obtained in a survey that could be
answered voluntarily by users of the platform. The
survey collects data on people's social background,
the importance of school grades, interests and
enjoyment of German lessons. It is automatically
displayed to each user three months after registration
on the platform. A total of 2749 people took part in
the survey from March to June in 2020.
A peculiarity of the platform is the structure of the
exercises: If the teacher assigns an exercise to a class,
this task is displayed to the students as pending.
Exercises consist of 10 sentences devoted to a
specific orthographic area, for example,
capitalization. If a mistake is made while working on
the task, new variations of the exercise sentences are
added, and the task expands dynamically. Before a
session is finished successfully, all previously wrong
sentences are displayed at the end of the session
again. As a result, exercises can consist of 60 or more
sentences if many mistakes are made. Consequently,
a session must at least consist of ten sentences if the
assignment is finished without mistakes. It can thus
be finished successfully with more than ten sentences
if the previously wrong sentence is answered
correctly later and the versions of this sentence are
answered correctly too. Figure 1 shows the count of
sentences an their sentence number. Some session
have been exited before the tenth sentence and are
thus unsuccessful. There is as well a drop after the
tenth sentence, which shows all the sessions that are
successfully ended without any mistakes.
Figure 1: Count of Sentences and Sentence Numbers.
3.2 In-session Dropout Prediction
Model
As stated above, the platform orthografietrainer.net is
mostly used in blended-classroom scenarios, for
example by assigning homework on the platform.
Traditional prediction models cannot be applied on
that case, as the whole setting is different: instead of
a self-contained course, individual homework
assignments and exercises are carried out on online
platforms that accompany school lessons. A course
dropout as in MOOCs or in higher education courses
is therefore not as transferable. To deal with this
CSEDU 2022 - 14th International Conference on Computer Supported Education
320
scenario, an in-session dropout prediction model is
applied. This is a temporal prediction model that
predicts for each exercise sentence of an assignment
whether a user will leave the session early or not.
Instead of a course dropout, an early exit of the
session is thus predicted. Herewith, different machine
learning models have already been tested in previous
studies to obtain a termination prediction within a
session (Rzepka et al. 2022). The temporal dropout
prediction model includes assignment and user
features which are either obtained directly from the
platform’s log data or calculated in the feature
engineering process. The model uses on the one end
demographic attributes such as gender, class level, or
user group and assignment features on the other hand
such as count of correct processed tasks, field of
grammar, difficulty of the sentences, or count of
pending tasks. To construct a temporal dropout
prediction, matrices are defined which include only
the processed tasks until the current sentence
position. Consequently, the prediction is re-run after
each sentence is processed and improves as the
number of sentences increases.
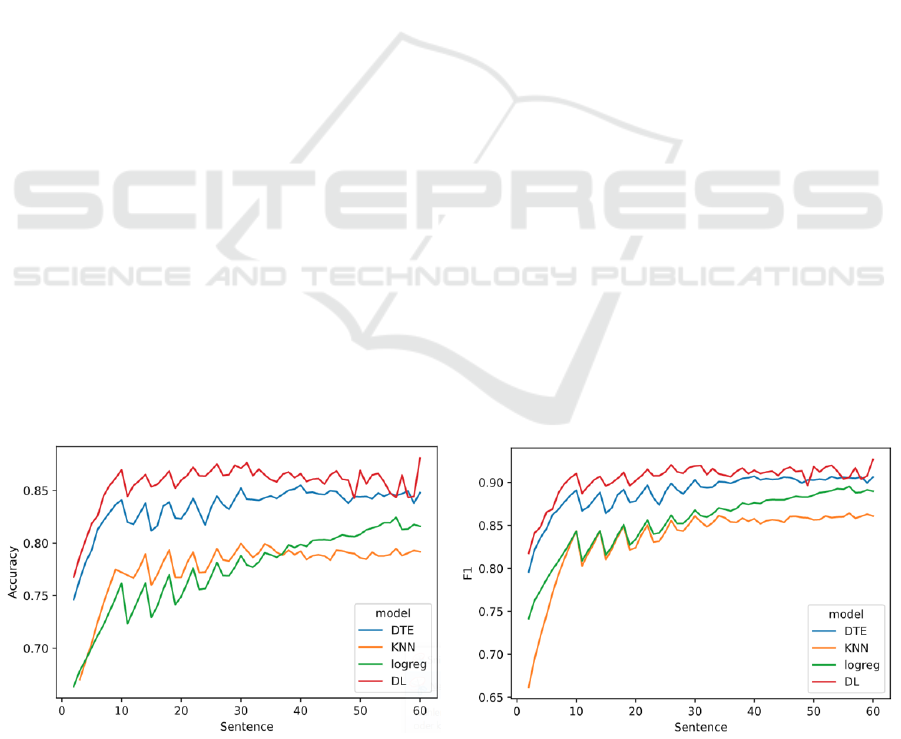
As a result, the Deep Learning Model (DL)
showed the highest accuracy up to 87%. This is
followed by the Decision Tree (DT) with a maximum
value of up to 85%. Furthermore, k-nearest neighbor
(KNN) and logistic regression (LogReg) were tested
but showed lower accuracies (Figure 1). The F1-score
shows best results for the deep learning model
followed by the decision tree classifier. Lower scores
are calculated for KNN and logistic regression. All
models improve strongly during the first ten
sentences and flatten out after. For the subsequent
calculations regarding fairness, the best models (DL
and DT) and one of the less good models (KNN) are
considered.
3.3 Fairness Evaluation
Our aim is to evaluate the in-session dropout
prediction model regarding fairness. For our analysis,
we therefore examine the performance of the
predictive model on four variables:
• First spoken language
• parents’ education
• number of books in the household
• gender
The first language attribute describes the language
the user has learned first at home (mother tongue) and
is an indicator for migration background. Spelling
skills and children’s literacy as a whole have been
found to be linked to migration background and level
of education of parents (Carroll et al. 2019; Lee and
Burkam 2007; Steinlen and Piske 2013). In
households where German is not the first language,
children tend to have poor results examining language
skills (Steinlen and Piske 2013). We split the data by
students whose first language was German and all
other languages.
Regarding the question about the parents’
education background in the survey, the users could
answer 0, 1 and 2. In our study we distinguish
between users with at least one parent with a high
school diploma and parents without a high school
diploma and thus grouped the answers of 1 and 2.
The third variable is the number of books in the
household, which is often part of questionnaires
measuring cultural capital (Noble and Davies 2009)
and hereby used as an indicator for home literacy
environment (HLE). Several studies linked the HLE
to children’s literacy skills (Carroll et al. 2019;
Figure 2: Accuracy and F1-Score per Sentence and Model (DTE=Decision Tree Classifier, KNN=k-Nearest Neighbor,
logreg=Logistic Regression, DL=Deep Learning).
Fairness of In-session Dropout Prediction
321

Griffin and Morrison 1997; Sénéchal and LeFevre
2002). For the number of books in the household, four
answers were possible in the survey: less than ten
books, more than 10 and less than 50 books, more
than 50 and less than 100, more than 100. We split the
user in two groups, one having less than 10 books in
their household and the other having more than 100.
In this attribute, we deliberately consider only the
edge cases, as we have seen that the differences are
otherwise too small and number of books in the
household is only estimated by the students.
The last attribute describes the user’s gender,
which can be male or female. This variable is not
obtained by the survey, but during the registration
process. Moreover, the attribute is part of the training
data as well, while the other three attributes are not.
After splitting the user groups according to the
variables as described above, we join them with the
learning process data of the respective users. To have
temporal predictions, we build matrices for each
sentence position. This results in 60 matrices
containing the information for the current sentence
and all previous ones. A matrix can thus be defined as
𝑥
, where 𝑖 describes the sentence position.
We then predict the early exit of the sessions with the
three pretrained models, the decision tree classifier,
the deep learning model, and the k-nearest neighbour
model. As these are temporal dropout prediction
models, we have 60 predictors for each session and
each model.
To evaluate model performance, we use the
metrics Predictive Parity (PP), Equal Opportunity
(EO), Predictive Equality (PE) and Slicing Analysis
(SA), which are described in section 2. It should be
noted that PP and SA are interpreted differently than
EO and PE. As PP and EO rely on precision and AUC
positive results are best. EO and PE, on the other
hand, rely on FPR and FNR and therefore negative
results are best. To be able to compare results, we
specifiy the directions of how the fairness measures
are calculated so that in all cases, a positive outcome
is to the benefit of the advantaged group, a negative
outcome to the benefit of the protected group.
The protected groups are male (gender), other
than German (first language), no high school diploma
(parental education), less than 10 books (books in the
household). PP and SA are calculated by
= 𝑛𝑜𝑡 𝑝𝑟𝑜𝑡𝑒𝑐𝑡𝑒𝑑 – 𝑝𝑟𝑜𝑡𝑒𝑐𝑡𝑒𝑑 (7)
EO and PE, on the other hand are calculated the
opposite way
= 𝑝𝑟𝑜𝑡𝑒𝑐𝑡𝑒𝑑 – 𝑛𝑜𝑡 𝑝𝑟𝑜𝑡𝑒𝑐𝑡𝑒𝑑 (8)
It cannot be expected that there are no
differences in model quality between groups, so it is
important to define thresholds that delineate from fair
to unfair. Different thresholds were defined in
previous studies, such as 0,04 for equal opportunity
by (Chouldechova 2017), 0,05 for predictive parity,
and 0,02 for slicing analysis by (Riazy and Simbeck
2019) and 0.01 as well as 0.03 for slicing analysis by
(Gardner et al. 2019). We set the thresholds to
𝑇ℎ𝑠
= |0,03| (lower threshold) and 𝑇ℎ𝑠
=
|0,05| (higher threshold).
As a temporal dropout prediction model
calculates predictors for each of the up to 60
sentences, we as well have 60 results per model and
fairness measure. To be able to interpret the results
more easily, we calculate the mean for each ten
sentences, leading to six results per model and
fairness measure.
4 RESULTS
In the following, we will present the results regarding
the model fairness for first language vs. second
language learners, users with high/low parental
education, users with high/low number of books in
the household, and gender. The attribute first
language (Table 1) is fair according to the metrics
predictive parity, equal opportunity, and slicing
analysis. All three measures remain below the
threshold of 𝑇ℎ𝑠
= |0,03| and 𝑇ℎ𝑠
= |0,05|
for each model. Predictive equality, however, shows
values lower -0,03, and for the decision tree and KNN
model even lower -0,05. As the protected group is
defined as users, whose first language is not German,
the model quality is slightly better for learners with
German as a 2
nd
language, as fewer false-positive
dropout predictions are found for them.
Parents’ education (Table 2) is similar regarding
predictive parity and equal opportunity, as they
remain below the threshold. Predictive equality and
slicing analysis, on the other hand, show disparities
above the thresholds of 0,05 in the last ten sentences.
As the protected group is defined as users with
parents without a high school diploma, the model
quality is slightly higher for users with at least one
parent with higher education, fewer false positives are
encountered for them. Moreover, in the deep learning
model, inequalities are starting earlier, already as of
the 20th sentence.
CSEDU 2022 - 14th International Conference on Computer Supported Education
322
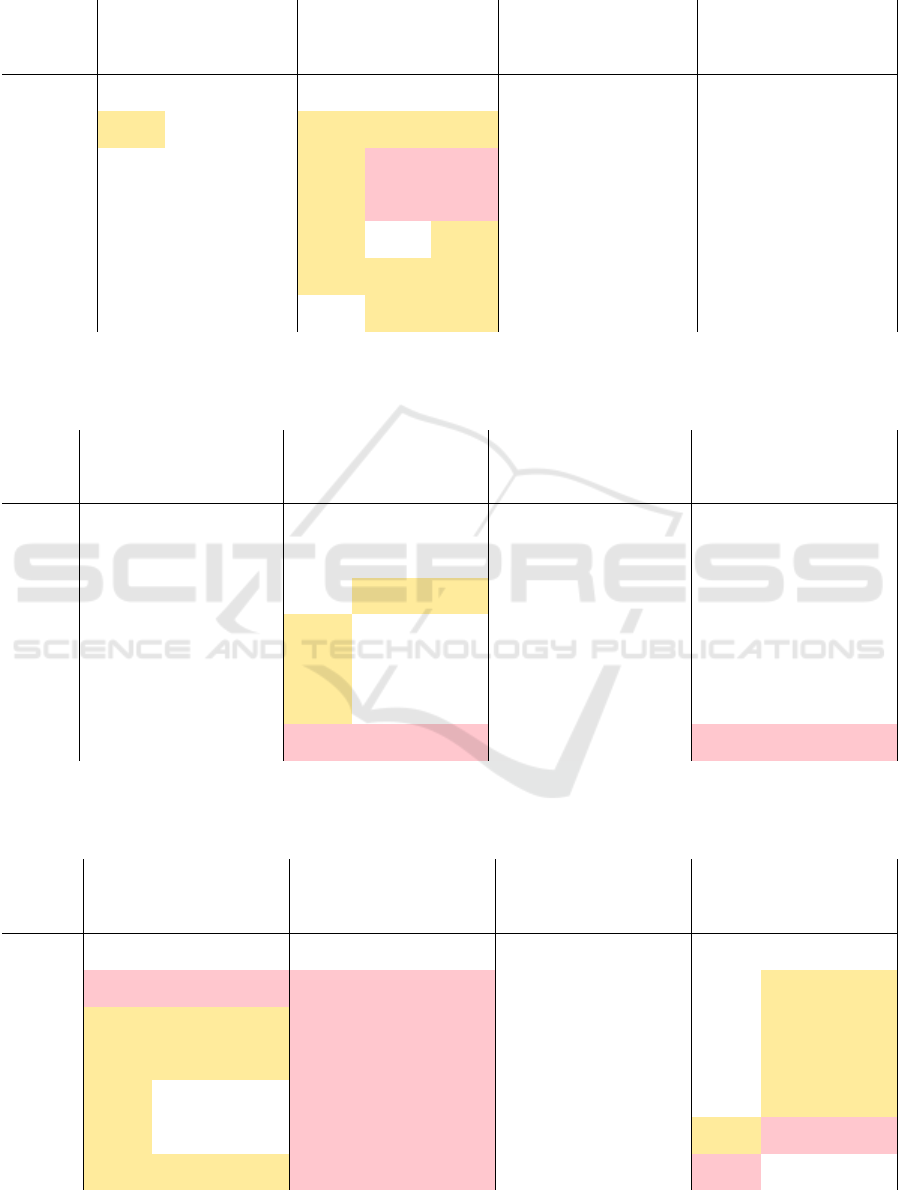
Table 1: Results of the metrics Predictive Parity (PP), Equal Opportunity (EO), Predictive Equality (PE), and Slicing Analysis
(SA) for the attribute first language. Models: DL=Deep Learning , DTE=Decision Tree Classifier, KNN=k-Nearest Neighbor.
EO
PE PP
SA
model DL DTE KNN DL DTE KNN DL DTE KNN DL DTE KNN
Sentence
2 to 9 -0,032 -0,028 -0,028 -0,042 -0,041 -0,041 0,010 0,013 0,013 0,002 -0,007 -0,007
10 to 19 -0,024 -0,025 -0,025 -0,050 -0,058 -0,058 0,004 0,003 0,003 -0,001 -0,017 -0,017
20 to 29 -0,024 -0,026 -0,026 -0,034 -0,057 -0,057 0,006 0,005 0,005 0,003 -0,016 -0,016
30 to 39 -0,022 -0,016 -0,016 -0,036 -0,030 -0,030 0,007 0,009 0,009 0,007 -0,007 -0,007
40 to 49 -0,019 -0,014 -0,014 -0,044 -0,046 -0,046 0,008 0,008 0,008 0,004 -0,016 -0,016
50 to 60 -0,016 -0,014 -0,014 -0,019 -0,041 -0,046 0,014 0,014 0,014 0,006 -0,013 -0,016
Table 2: Results of the metrics Predictive Parity (PP), Equal Opportunity (EO), Predictive Equality (PE), and Slicing Analysis
(SA) for the attribute parents education. Models: DL=Deep Learning , DTE=Decision Tree Classifier, KNN=k-Nearest
Neighbor.
EO
PE PP
SA
model DL DTE KNN DL DTE KNN DL DTE KNN DL DTE KNN
Sentence
2 to 9 -0,020 -0,022 -0,022 -0,002 -0,007 -0,007 0,002 0,002 0,002 0,009 0,008 0,008
10 to 19 -0,013 -0,022 -0,022 -0,029 -0,030 -0,030 -0,001 -0,001 -0,001 0,007 -0,004 -0,004
20 to 29 -0,005 -0,010 -0,010 0,030 0,0180 0,018 0,004 0,004 0,004 0,005 0,014 0,014
30 to 39 -0,005 -0,004 -0,004 0,047 -0,010 -0,010 0,007 0,004 0,004 0,004 -0,003 -0,003
40 to 49 -0,004 -0,005 -0,005 0,044 -0,009 -0,009 0,009 0,006 0,006 -0,007 -0,002 -0,002
50 to 60 -0,026 -0,021 -0,021 0,133 0,111 0,111 0,016 0,015 0,015 0,058 0,066 0,066
Table 3: Results of the metrics Predictive Parity (PP), Equal Opportunity (EO), Predictive Equality (PE), and Slicing Analysis
(SA) for the attribute number of books in household. Models: DL=Deep Learning , DTE=Decision Tree Classifier, KNN=k-
Nearest Neighbor.
EO
PE PP
SA
model DL DTE KNN DL DTE KNN DL DTE KNN DL DTE KNN
Sentence
2 to 9 -0,065 -0,051 -0,051 -0,102 -0,122 -0,122 0,011 0,010 0,010 -0,008 -0,035 -0,035
10 to 19 -0,046 -0,050 -0,050 -0,133 -0,147 -0,147 0,006 0,002 0,002 -0,005 -0,049 -0,049
20 to 29 -0,042 -0,044 -0,044 -0,079 -0,107 -0,107 0,012 0,010 0,001 -0,003 -0,032 -0,032
30 to 39 -0,034 -0,029 -0,029 -0,067 -0,103 -0,103 0,010 0,009 0,009 0,003 -0,037 -0,037
40 to 49 -0,031 -0,017 -0,017 -0,163 -0,119 -0,119 0,001 0,007 0,007 -0,041 -0,051 -0,051
50 to 60 -0,045 -0,043 -0,043 -0,213 -0,090 -0,097 0,006 0,022 0,021 -0,076 -0,024 -0,027
Fairness of In-session Dropout Prediction
323
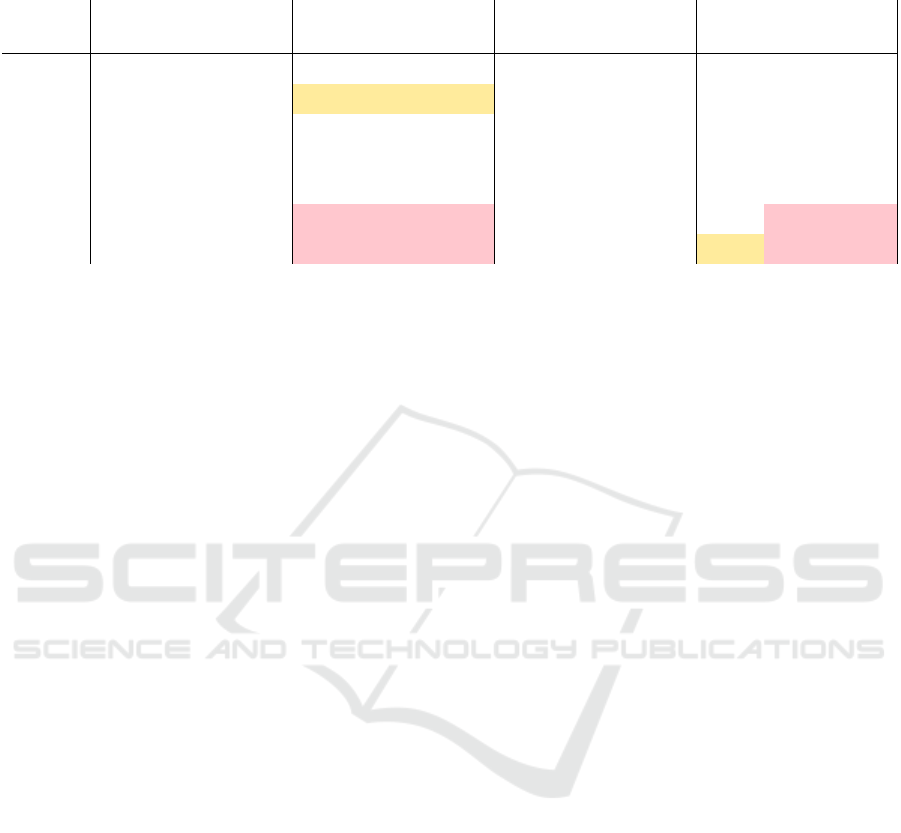
Table 4: Results of the metrics Predictive Parity (PP), Equal Opportunity (EO), Predictive Equality (PE), and Slicing Analysis
(SA) for the attribute gender. Models: DL=Deep Learning , DTE=Decision Tree Classifier, KNN=k-Nearest Neighbor.
EO
PE PP
SA
model DL DTE KNN DL DTE KNN DL DTE KNN DL DTE KNN
Sentence
2 to 9 -0,022 -0,029 -0,029 -0,036 -0,049 -0,049 0,008 0,008 0,008 -0,001 -0,010 -0,010
10 to 19 -0,011 -0,026 -0,026 0,003 -0,018 -0,018 0,009 0,007 0,007 0,007 0,004 0,005
20 to 29 -0,009 -0,021 -0,021 0,017 -0,011 -0,011 0,009 0,007 0,007 0,007 0,005 0,005
30 to 39 -0,003 -0,009 -0,009 0,008 -0,006 -0,005 0,006 0,006 0,006 0,009 0,001 0,002
40 to 49 -0,006 -0,006 -0,005 -0,079 -0,109 -0,109 -0,001 -0,003 -0,003 -0,003 -0,052 -0,052
50 to 60 0,001 0,003 0,003 -0,149 -0,155 -0,160 -0,003 -0,003 -0,003 -0,031 -0,079 -0,081
For the number of books in the household (Table
3) we do only consider users with less than ten books
and more than 100 books. Here, predictive parity
shows no inequalities. Equal opportunity, predictive
equality, and slicing analysis show values less than
-0,03 and -0,05, which suggests the model quality is
better for users with less than ten books. Specifically,
for learners from households with many books, more
false positives and false negatives are encountered as
well as a lower value of AUC
Predictive parity and equal opportunity show
again only values below the threshold for the gender
attribute (Table 4). Predictive equality and slicing
analysis are thus lower than -0,05 for the last 20
sentences. This means that the models are of higher
quality for boys.
When distinguishing between the different
machine learning models, we see few differences.
Most of the time, either all three values are above the
threshold or they are not.
5 CONCLUSION AND OUTLOOK
In our study, we evaluated an in-session dropout
prediction model regarding fairness for four different
variables which are known to have impact on
children’s literacy skills. We explored the following
research questions:
RQ1: How fair are in-session dropout prediction
models considering different fairness measures?
RQ2: What is the potential for discrimination for
different demographic groups?
RQ3: How do different ML implementations of
prediction models differ with respect to their
discrimination potential?
The results with regards to research questions 1 and 2
are mixed. The fairness measure of predictive parity
never exceeds the threshold. This means, that the
probability for a predicted early termination to truly
terminate the session early is equal for protected and
unprotected groups. The same holds true for equal
opportunity, except for the HLE attribute. The
probability of session termination which was
incorrectly predicted to be a successful session is
higher for users with more than 100 books in the
household. If the model outcome leads to
interventions, these users would not get the
intervention they need, as the model would predict
them to successfully finish the session.
In contrast,
predictive equality is above the threshold for all
attributes. This means that a successfully finished
session is incorrectly predicted as an early
termination. In an educational setting, this leads to
interventions for users who would not need them.
Depending on the intervention, this can hinder users
to achieve high levels of learning, for example, if
tasks are adjusted based on the prediction. Slicing
Analysis is as well often above the threshold.
The results have shown that the fairness of a
model is assessed differently by various definitions.
It is a matter of context which definitions should be
used, and which are more important than others. In an
educational setting, users who don’t receive help and
interventions although they need it, are as poor as
users who do not reach high levels of learning
although they would be able to accomplish it.
With regards to research question 3, we see that
different implementations do not make much
difference in evaluation in terms of fairness.
However, interesting correlations emerge in the
temporal analysis. The longer the session, the more
data about the user is available, the better the
accuracy, but at the same time, the fairness decreases.
This may indicate that the additional data in longer
CSEDU 2022 - 14th International Conference on Computer Supported Education
324

sessions can be used to improve the prediction, but at
the same time may also have a discriminatory
influence. This results in a trade off between accuracy
and fairness. This is particularly evident for the
variables parental education background and gender.
Another interesting finding is that discrimination
is higher for variables that are not balanced (such as
number of books in the household). The attribute
gender, on the other hand, is fairly well balanced and
also has the lowest disparities.
Overall, our work shows that in-session prediction
models can be discriminatory. However, this is
largely dependent on three factors: on the one hand,
different metrics produce different results; on the
other hand, different demographic subgroups can be
found in user groups, which can be affected by
discrimination to different degrees; at the same time,
training data (in our case, sentence numbers) have an
influence and fairness decreases with higher model
accuracy. In our study, ML implementation did not
affect the fairness of the model.
Our study comes with several limitations which
need to be considered in further interpretations. First,
the survey for three of four attributes is conducted
voluntarily among users. This results in a selection
bias, as we only investigate data of users who were
willing and motivated enough to answer the survey.
Secondly, the variable gender was part of the model’s
training process while the other attributes were not.
Last, the attributes parental education and
number of
books in the household are grouped in two, although
more than two answers were possible in the survey.
Our research has shown that temporal dropout
prediction, even in in-session scenarios, is at risk to
discriminate different groups. We see three factors
that affect the fairness of the model: 1) different
fairness metrics, 2) demographic groups, 3) different
training data. We therefore suggest always evaluating
predictive models using several measures and placing
the results into context. Furthermore, our analysis has
shown, that it is important not only to evaluate
discrimination with regard to gender or migration
background but to extend the examination to
variables that are known to have an impact on the
educational path, such as parental education or HLE.
Further research should consider ways to address the
disparities through pre-, in-, or post-process methods.
Our work looks at the evaluation of an online
platform specifically for teaching German.
Nevertheless, our research can be transferred to other
subjects. Especially platforms that are used in a
school context are used in particular for assigning
homework, like Orthografietrainer.net. However,
transferring MOOC dropout predictions is not
possible and the use of our approach is recommended.
Again, it is important to look at multiple
measures, as improving one definition of fairness can
lead to a worsening of another.
ACKNOWLEDGEMENTS
This research was funded by the Federal Ministry of
Education and Research of Germany in the
framework “Digitalisierung im Bildungsbereich”
(project number 01JD1812A).
REFERENCES
Angwin, J.; Larson, J.; Mattu, S.; Kirchner, L. (2016):
Machine bias: There’s software used across the country
to predict future criminals. And it’s biased against
blacks. In ProPublica 2016. Available online at
www.propublica.org/article/machine-bias-risk-
assessments-in-criminal-sentencing.
Baker, R. S..; Hawn, A. (2021): Algorithmic Bias in
Education. In Int J Artif Intell Educ, pp. 1–41. DOI:
10.1007/s40593-021-00285-9.
Carroll, J. M.; Holliman, A. J.; Weir, F.; Baroody, A. E.
(2019): Literacy interest, home literacy environment
and emergent literacy skills in preschoolers. In Journal
of Research in Reading 42 (1), pp. 150–161. DOI:
10.1111/1467-9817.12255.
Chen, Y.; Johri, A.; Rangwala, H. (2018): Running out of
STEM. In Proceedings of the 8th International
Conference on Learning Analytics and Knowledge.
LAK '18: ACM, pp. 270–279.
Chouldechova, A. (2017): Fair Prediction with Disparate
Impact: A Study of Bias in Recidivism Prediction
Instruments. In Big Data 5 (2), pp. 153–163.
Dalipi, F.; Imran, A. S.; Kastrati, Z. (2018): MOOC
Dropout Prediction Using Machine Learning
Techniques: Review and Research Challenges. In IEEE
Global Engineering Education Conference, updated on
5/7/2021, checked on 5/7/2021.
Del Bonifro, F.; Gabbrielli, M.; Lisanti, G.; Zingaro, S. P.
(2020): Student Dropout Prediction. In Artificial
Intelligence in Education. 21st International
Conference, AIED 2020, pp. 129–140.
Gardner, J; Brooks, C.; Baker, R. (2019): Evaluating the
Fairness of Predictive Student Models Through Slicing
Analysis. In Proceedings of the 9th International
Conference on Learning Analytics & Knowledge.
ACM.
Griffin, E. A.; Morrison, F. J. (1997): The Unique
Contribution of Home Literacy Environment to
Differences in Early Literacy Skills 1. In Early Child
Development and Care 127 (1), pp. 233–243. DOI:
10.1080/0300443971270119.
Hagedoorn, T. R.; Spanakis, G. (2017): Massive Open
Online Courses Temporal Profiling for Dropout
Fairness of In-session Dropout Prediction
325

Prediction. In 2017 IEEE 29th International
Conference on Tools with Artificial Intelligence
(ICTAI), pp. 231–238.
Hajian, S.; Bonchi, F.; Castillo, C. (2016): Algorithmic
Bias. In Proceedings of the 22nd ACM SIGKDD
International Conference on Knowledge Discovery and
Data Mining. KDD '16: ACM, pp. 2125–2126.
Hu, Q.; Rangwala, H. (2020): Towards Fair Educational
Data Mining: A Case Study on Detecting At-Risk
Students. In International Educational Data Mining
Society. Available online at https://eric.ed.gov/?id=
ed608050.
Jin, C. (2020): MOOC student dropout prediction model
based on learning behavior features and parameter
optimization. In Interactive Learning Environments,
pp. 1–19. DOI: 10.1080/10494820.2020.1802300.
Kizilcec, R. F.; Lee, H. (2020): Algorithmic Fairness in
Education. Forthcoming in W. Holmes & K. Porayska-
Pomsta (Eds.), Ethics in Artificial Intelligence in
Education, Taylor & Francis.
Klare, B. F.; Burge, M. J.; Klontz, J. C.; Vorder Bruegge,
R. W.; Jain, A. K. (2012): Face Recognition
Performance: Role of Demographic Information. In
IEEE Trans.Inform.Forensic Secur. 7 (6), pp. 1789–
1801. DOI: 10.1109/TIFS.2012.2214212.
Lee, V. E.; Burkam, D. T. (2007): Inequality at the starting
gate. Social background differences in achievement as
children begin school. 3. print. Washington, DC:
Economic Policy Institute.
Liang, J.; Yang, J.; Wu, Y.; Li, C.; Zheng, L. (2016): Big
Data Application in Education: Dropout Prediction in
Edx MOOCs. In 2016 IEEE Second International
Conference on Multimedia Big Data (BigMM), pp.
440–443.
Luan, H.; Tsai, C. (2021): A Review of Using Machine
Learning Approaches for Precision Education. In
Educational Technology & Society 24 (1), pp. 250–266.
Available online at https://www.jstor.org/stable/
26977871.
Merriam-Webster Dictionary (2021a): Bias. Available
online at https://www.merriam-webster.com/
dictionary/bias.
Merriam-Webster Dictionary (2021b): Fairness. Available
online at https://www.merriam-webster.com/
dictionary/fairness.
Mitchell, S.; Potash, E.; Barocas, S.; D'Amour, A.; Lum, K.
(2021): Algorithmic Fairness: Choices, Assumptions,
and Definitions. In Annu. Rev. Stat. Appl. 8 (1), pp.
141–163.
Tasnim, N.; Paul, M. K.; Sattar, A. H. M. S. (2019):
Identification of Drop Out Students Using Educational
Data Mining. In 2019 International Conference on
Electrical, Computer and Communication Engineering
(ECCE). Engineering (ECCE), pp. 1–5.
Noble, J.; Davies, P. (2009): Cultural capital as an
explanation of variation in participation in higher
education. In British Journal of Sociology of Education
30 (5), pp. 591–605.
Okubo, F.; Yamashita, T.; Shimada, A.; Ogata, H. (2017):
A neural network approach for students' performance
prediction. In Proceedings of the Seventh International
Learning Analytics & Knowledge Conference. ACM.
O'Neil, C. (2016): Weapons of Math Destruction. How big
data increases inequality and threatens democracy. New
York: Crown/Archetype (ProQuest Ebook Central).
Pessach, D.; Shmueli, E. (2020): Algorithmic Fairness.
arXiv preprint arXiv:2001.09784.
Prates, M. O. R.; Avelar, P. H.; Lamb, L. C. (2020):
Assessing gender bias in machine translation: a case
study with Google Translate. In Neural Comput &
Applic 32 (10), pp. 6363–6381. DOI: 10.1007/s00521-
019-04144-6.
Prenkaj, B.; Velardi, P.; Stilo, G.; Distante, D.; Faralli, S.
(2020): A Survey of Machine Learning Approaches for
Student Dropout Prediction in Online Courses. In ACM
Comput. Surv. 53 (3), pp. 1–34. DOI:
10.1145/3388792.
Riazy, S.; Simbeck, K. (2019): Predictive Algorithms in
Learning Analytics and their Fairness. In DELFI 2019.
DOI: 10.18420/delfi2019_305.
Rzepka, N.; Simbeck, K.; Müller, H.-G.; Pinkwart, N.:
Keep It Up: In-Session Dropout Prediction to Support
Blended Classroom Scenarios. In Proceedings of the
14th International Conference on Computer Supported
Education (CSEDU 2022), 2022 (forthcoming).
Sénéchal, M.; LeFevre, J. (2002): Parental involvement in
the development of children's reading skill: a five-year
longitudinal study. In Child development 73 (2), pp.
445–460. DOI: 10.1111/1467-8624.00417.
Shahiri, A. M.; Husain, W.; Rashid, N. A. (2015): A
Review on Predicting Student's Performance Using
Data Mining Techniques. In Procedia Computer
Science 72, pp. 414–422.
Stapel, M.; Zheng, Z.; Pinkwart, N. (2016): An Ensemble
Method to Predict Student Performance in an Online
Math Learning Environment. In International
Educational Data Mining Society.
Steinlen, A. K.; Piske, T. (2013): Academic achievement of
children with and without migration backgrounds in an
immersion primary school: A pilot study. In Zeitschrift
für Anglistik und Amerikanistik 61 (3), pp. 215–244.
DOI: 10.1515/zaa-2013-0303.
Sun, D.; Mao, Y.; Du, J.; Xu, P.; Zheng, Q.; Sun, H. (2019):
Deep Learning for Dropout Prediction in MOOCs. In
2019 Eighth International Conference on Educational
Innovation through Technology (EITT), pp. 87–90.
Suresh, H.; Guttag, J. V. (2019): A Framework for
Understanding Sources of Harm throughout the
Machine Learning Life Cycle. In Equity and Access in
Algorithms, Mechanisms, and Optimization, (pp. 1-9).
Verma, S.; Rubin, J. (2018): Fairness definitions explained.
In Proceedings of the International Workshop on
Software Fairness. ACM.
Wang, W.; Yu, H.; Miao, C. (2017): Deep Model for
Dropout Prediction in MOOCs. In Proceedings of the
2nd International Conference on Crowd Science and
Engineering. the 2nd International Conference. ACM,
pp. 26–32.
Xing, W.; Du, D. (2019): Dropout Prediction in MOOCs:
Using Deep Learning for Personalized Intervention. In
Journal of Educational Computing Research 57 (3), pp.
547–570. DOI: 10.1177/0735633118757015.
CSEDU 2022 - 14th International Conference on Computer Supported Education
326
