
Detection of Microcalcifications in Digital Breast Tomosynthesis
using Faster R-CNN and 3D Volume Rendering
Ana M. Mota
1a
, Matthew J. Clarkson
2b
, Pedro Almeida
1c
and Nuno Matela
1d
1
Instituto de Biofísica e Engenharia Biomédica, Faculdade de Ciências da Universidade de Lisboa, Lisboa, Portugal
2
Department of Medical Physics and Biomedical Engineering and the Centre for Medical Image Computing (CMIC),
University College London, London, U.K.
Keywords: Digital Breast Tomosynthesis, Faster R-CNN, Volume Rendering, Microcalcification Clusters.
Abstract: Microcalcification clusters (MCs) are one of the most important biomarkers for breast cancer and Digital
Breast Tomosynthesis (DBT) has consolidated its role in breast cancer imaging. As there are mixed
observations about MCs detection using DBT, it is important to develop tools that improve this task.
Furthermore, the visualization mode of MCs is also crucial, as their diagnosis is associated with their 3D
morphology. In this work, DBT data from a public database were used to train a faster region-based
convolutional neural network (R-CNN) to locate MCs in entire DBT. Additionally, the detected MCs were
further analyzed through standard 2D visualization and 3D volume rendering (VR) specifically developed for
DBT data. For MCs detection, the sensitivity of our Faster R-CNN was 60% with 4 false positives. These
preliminary results are very promising and can be further improved. On the other hand, the 3D VR
visualization provided important information, with higher quality and discernment of the detected MCs. The
developed pipeline may help radiologists since (1) it indicates specific breast regions with possible lesions
that deserve additional attention and (2) as the rendering of the MCs is similar to a segmentation, a detailed
complementary analysis of their 3D morphology is possible.
1 INTRODUCTION
Breast cancer is the type of cancer with higher
incidence, among all cancers and both sexes, and it
still represents the biggest cause of cancer mortality
among women (Sung et al., 2021). The mortality rate
from this disease has been decreasing is the last
decades due to the new therapies and the
implementation of screening programs for early
detection (Tabár et al., 2019).
The use of Digital Breast Tomosynthesis (DBT)
has been confirming its potential to address the tissue
overlapping limitations of Digital Mammography
(DM), the gold standard for breast screening until
recently. In fact, by including synthetic
mammographies generated from DBT data, DBT
alone is now used as a stand-alone modality to replace
DM (Bernardi et al., 2016; Food and Drug
a
https://orcid.org/0000-0002-1931-294X
b
https://orcid.org/0000-0002-5565-1252
c
https://orcid.org/0000-0001-5247-4011
d
https://orcid.org/0000-0002-8048-7896
Administration (FDA) U.S. , 2013; Freer et al., 2017;
Gilbert et al., 2015; Hofvind et al., 2018; Lång et al.,
2016; Zackrisson et al., 2018). DBT volume data can
be analyzed in depth through several 2D slices
(standard visualization slice-by-slice). This multi-
slice inspection leads to a longer analysis time
(because instead of two images, radiologists have to
inspect an average of sixty images per patient), which
represent a problem in daily practice and screening
environment (Caumo et al., 2018; Good et al., 2008;
Gur et al., 2009).
Computer-Aided Detection (CAD) systems based
on DBT have been implemented and evaluated in an
attempt to shorten the reading time while maintaining
the radiologist performance. However, despite the
efforts and improvements already achieved, due to
the high false positive (FP) rates and low specificity,
these CAD systems have not reached a level of
80
Mota, A., Clarkson, M., Almeida, P. and Matela, N.
Detection of Microcalcifications in Digital Breast Tomosynthesis using Faster R-CNN and 3D Volume Rendering.
DOI: 10.5220/0010938800003123
In Proceedings of the 15th International Joint Conference on Biomedical Engineering Systems and Technologies (BIOSTEC 2022) - Volume 2: BIOIMAGING, pages 80-89
ISBN: 978-989-758-552-4; ISSN: 2184-4305
Copyright
c
2022 by SCITEPRESS – Science and Technology Publications, Lda. All rights reserved

performance that can be translated into a true
improvement in the real screening of breast cancer
(Fenton et al., 2007; Katzen & Dodelzon, 2018;
Lehman et al., 2015; Sechopoulos, Teuwen, & Mann,
2020).
On the other hand, a different type of
visualization, such as 3D volume rendering (VR),
may play an important complementary role in breast
cancer diagnosis (Venson et al., 2017). With a
visualization of the object through multiple angles,
one of the advantages of VR is to provide an intuitive
understanding of the underlying data at once. In
addition, as VR yields a true depth perception
(Suetens, 2009), it can help in the analysis of lesions
such as microcalcification clusters (MCs), sometimes
referred as harder to detect in DBT. These MCs are
often spread across several slices in the slice-by-slice
visualization, making the interpretation difficult. In
this way, a better understanding of its true 3D
morphology is important to differentiate between
benign and malignant microcalcifications.
In recent years, the increase in computational
power and bigger datasets have allowed the
development of algorithms for automatic object
detection with deep learning. The region-based
convolutional neural networks (R-CNNs) are one of
the main current focuses of research and development
of these methods (Girshick, Donahue, Darrell, &
Malik, 2014). As R-CNN and its descendent “fast R-
CNN” (Girshick, 2015) are computationally
expensive and extremely slow, another method has
emerged: “Faster R-CNN” (Ren, He, Girshick, &
Sun, 2015). With this object detection network, both
the CNN-based regional proposals and the regional
classification module are trained together with
significant weight sharing, led to increased sensitivity
for object detection and faster speed.
The published studies that use deep CNNs to
detect and localize lesions in DBT are still very
limited. In fact, the few works that exist are related
with the detection of soft tissue lesions (Buda et al.,
2020; Fotin, Yin, Haldankar, Hoffmeister, &
Periaswamy, 2016; Lai, Yang, & Li, 2020; Samala et
al., 2016). Regarding the use of Faster R-CNN in
particular, (Fan et al., 2019) developed a CAD system
for masses detection in DBT using a Faster R-CNN,
which is later compared to a framework of a 3D-Mask
R-CNN for mass detection and segmentation (Fan et
al., 2020). (Li et al., 2021) propose a Faster R-CNN
that uses mammary gland distribution as a prior
information to detect architectural distortions in DBT.
In this paper, a Faster R-CNN was trained for
detecting MCs in DBT. The aim is to input a whole
DBT image into the network and have a direct answer
about the localization or absence of MCs. This
information about the location is then introduced into
a 3D VR visualization software so that a 3D volume
of interest containing the predicted MCs can be
obtained. A public simulated database was used and
the preliminary results obtained are presented. To the
best of our knowledge, this is the first study of
automatic localization of MCs in whole DBT images
and the first time the DBT output of a deep CNN is
rendered and presented as a 3D volume of interest.
2 MATERIALS AND METHODS
This work was implemented on the MATLAB
R2020a and a NVIDIA Quadro P4000 GPU computer
was used.
2.1 Database and Pre-processing
The public database of Virtual Imaging Clinical Trial
for Regulatory Evaluation (VICTRE) project which
contains a total of 2986 virtual realistic patients
imaged with DBT was used (Badano et al., 2018;
VICTRE, 2018). This database contains cases
without lesions (absent) and with malignant masses
and MCs. For training, only cases with MCs were
considered (915 in total: 665 complete breast images
and 250 images containing only MCs) and for the
testing, absent and MC cases were included (280 and
284 complete breast images, respectively). Each case
with lesion contains four MCs consisting of 5
calcified lesions modelled as 195, 179, and 171 μm of
solid calcium oxalate.
In addition to the information about the presence
or absence of MCs, in cases where MCs were present,
information about the corresponding bounding boxes
(BBs) was also given to the network. This
information, in the form of x, y and z coordinates as
well as width and height, is s in the VICTRE database.
We adopted the usual distribution of breast
density in the general population: 10% fatty, 40%
scattered, 40% heterogeneous and 10% dense. The
reconstructed cases have different dimension in x, y
and z, depending on breast density: 1624 × 1324 ×
62 , 1421 × 1024 × 57 , 1148 × 753 × 47 and
1130 × 477 × 38 for fatty, scattered, heterogeneous
and dense breasts, respectively, with a voxel size of
0.085 × 0.085 × 1 𝑚𝑚
.
The data intensity was first normalized between 0
and 1 and then squared to highlight the higher
intensity values belonging to the MCs, while
attenuate the lower ones. With this pre-processing
step our aim was to specifically increase the contrast
Detection of Microcalcifications in Digital Breast Tomosynthesis using Faster R-CNN and 3D Volume Rendering
81

of regions of higher intensities. In addition, through
binarization and region growing operations, binary
masks that keep information belonging to the breast
and make everything else zero were created
(background suppression).
2.2 Faster R-CNN Object Detector
Faster R-CNN is based on a CNN and a region
proposal network (RPN) for detecting, localizing and
classifying objects in an image. The CNN module
(typically a pre-trained CNN), outputs a set of feature
maps and, for that reason, it is also called feature
extraction network. In our work, we used the ResNet-
18 model, trained on more than a million images from
the ImageNet database ("ImageNet," 2021). The RPN
is on top of the last convolutional layer of the CNN
and it uses default bounding boxes (anchors) with
different sizes and aspect ratios over the feature maps
generated from pre-trained CNN in order to find
objects with varying sizes and shapes. It is trained to
output a set of object proposals on the image, each
with an “objectness” score, regardless of the class of
the object (it only looks if it is an object or
background). The boxes with the highest score are
called region proposals and are introduced in another
branch of the network were they are resampled to a
fixed size (ROI Pooling) and, typically using few
fully connected layers, the class of the object present
in the boundary boxes is determined. Further details
about Faster R-CNN can be found in the original
paper (Ren et al., 2015). The main parameters used to
define our Faster R-CNN are presented in Table 1.
Table 1: Parameters used to design the Faster R-CNN.
Input size 224x224x3
Anchor Boxes 42x27; 63x45; 45x41
Pre-trained CNN ResNet-18
2.3 Faster R-CNN Training
The Faster R-CNN was trained using the end-to-end
method, where the RPN and the region classification
networks were trained simultaneously along 660k
iterations. Table 2 presents the main training options
defined for this work.
During training, several regions of the image are
processed from the training database. The positive
and negative overlap range properties control which
image regions are used for training. This overlap ratio
is defined as the Intersection over Union (IoU) metric
that describes the extent of overlap between two
boxes (ground truth and predicted BB). The greater
the region of overlap, the greater the IOU. The model
was trained to minimize the mean square error loss
between the predicted BBs and the ground truth using
the Stochastic Gradient Descent optimizer
(MathWorks, 2021).
Table 2: Options used to train the Faster R-CNN.
Solver Stochastic Gradient
Descent w momentu
m
Momentu
m
0.9
Size of mini-
b
atch 1
Learnin
g
rate 1e-3
Factor for L
2
re
g
ularization 5e-4
Trainin
g
metho
d
En
d
-to-en
d
Positive Overla
p
Ran
g
e [0.3 1]
Ne
g
ative Overla
p
Ran
g
e [0 0.1]
To prevent overfitting, each image in the training
set was augmented by random reflection in the left-
right direction and rotation between -20º and 20º. In
addition, a L
2
regularization term for the weight decay
was introduced in the loss function.
2.4 Evaluation Metrics
The network's ability to accurately detect and locate
the MCs was evaluated through the Free-response
Receiver Operating Characteristic (FROC) curve
(Bunch, Hamilton, Sanderson, & Simmons, 1977).
To obtain a point on the FROC curve, a threshold
value is fixed and only the findings that have scores
above that threshold are selected. Then the sensitivity
(true positive fraction) and mean number of FPs per
image are determined.
2.5 Data Visualization
Figure 1 shows the scheme followed during and after
Faster R-CNN training. A testing set is evaluated for
the detection of MCs using the trained Faster R-CNN
and the output results (predicted BBs) are visualized.
In addition to the standard 2D visualization, the output
detection was also analyzed through 3D visualization
with VR. The 2D visualization was performed by
calculating the 2D maximum intensity projection
(MIP) considering the slice where the cluster was
detected and the four adjacent slices (two down and
two up). The 3D visualization was performed through
VR with 3D MIP considering the same slices.
The Visualization Toolkit library (VTK) version
7.1.0. (Kitware, New York, EUA) (Schroeder,
Martin, & Lorensen, 2006; VTK, 2020) was used to
develop 3D specific software in order to visualize
DBT data through VR. The opacity/color transfer
BIOIMAGING 2022 - 9th International Conference on Bioimaging
82
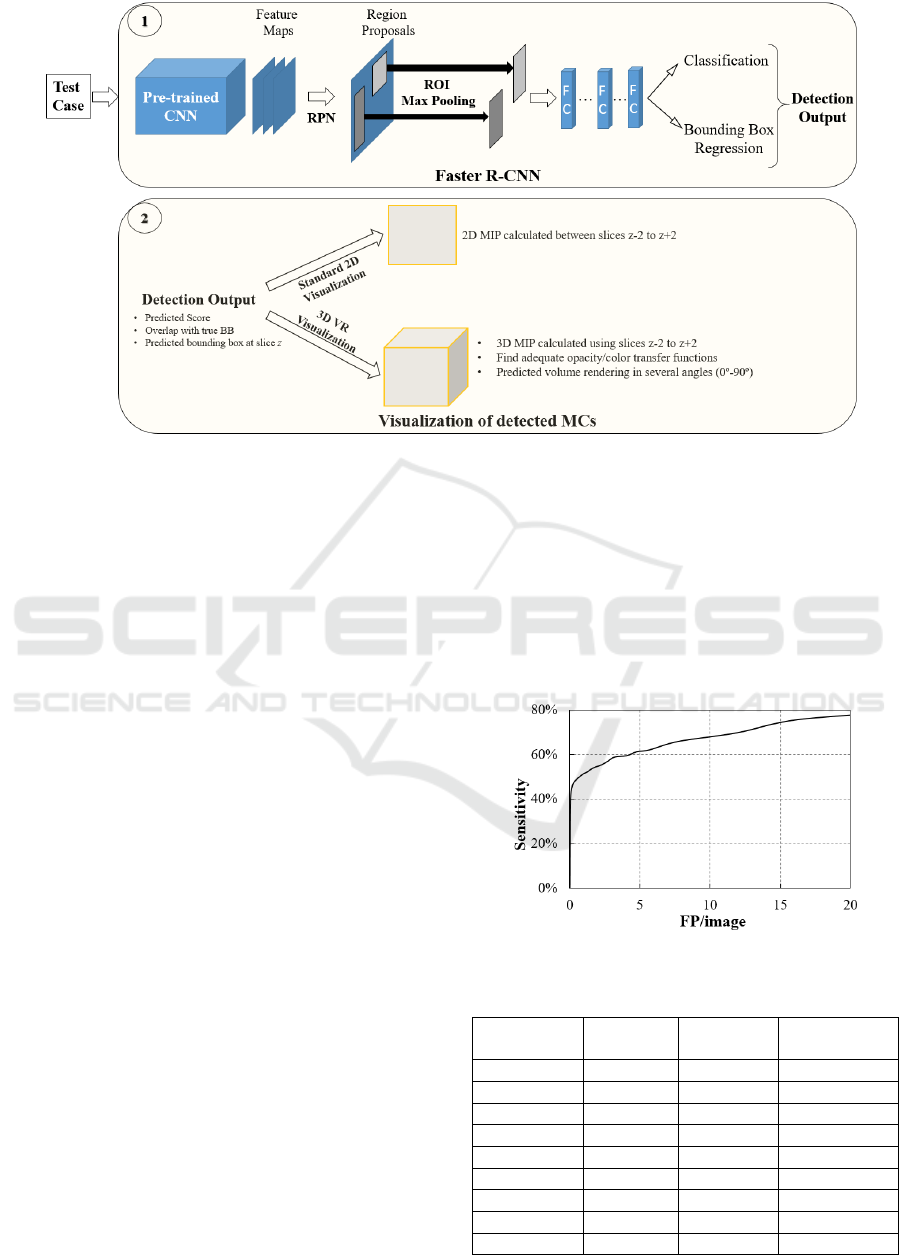
Figure 1: Pipeline followed for connection between the output of the trained Faster R-CNN and the volume rendering
visualization of the detected object.
functions for an adequate rendering of these data were
calculated accordingly to previous work (Mota,
Clarkson, Orvalho, Almeida, & Matela, 2020).
In VR, changing the azimuth of a camera rotates
its position around the focal point (Schroeder et al.,
2006) allowing an immediate notion of the entire
volume in 3D. In this way, the volume of interest
containing the detected MCs is presented from
several angles (from 0º to 90º).
3 RESULTS
The training of 660k iterations was performed during
12 days. The analysis of one test image was done in
0.6 seconds (mean time) and for an entire DBT
volume our Faster R-CNN needed, on average, 29
seconds (depending on the size).
3.1 Faster R-CNN Detection
Figure 2 presents the FROC curve for the performance
of the training model to accurately detect and locate the
MCs for several thresholds. In addition, the
discriminative sensitivity values obtained for less than
8 FP /image are detailed in the Table 3.
3.2 Data Visualization
Four examples of detection output, including the FPs
(yellow) and true positives (green) BBs, obtained
with a threshold of 0.9 are presented in Figure 3. The
corresponding score is also shown. As described,
each detected MC is presented through two
visualization modes: 2D slice-by-slice and 3D VR.
As 3D VR is inspected through several angles (0,
22.5º, 45º, 67.5º and 90º), 2D MIP slice-by-slice is
presented using xy and xz representations for
comparison with VR 0º and 90º, respectively.
Figure 2: The FROC curve for the test dataset.
Table 3: The sensitivity values for less than 8 FP/image.
Sensitivity
(%)
FP/image
# MCs
detected
# MCs
undetected
40 0.1 125 159
47 0.2 146 138
51 0.8 158 126
54 1.8 170 114
57 2.7 178 106
59 3.2 184 100
61 4.8 186 98
62 5.7 194 90
66 7.8 206 78
Detection of Microcalcifications in Digital Breast Tomosynthesis using Faster R-CNN and 3D Volume Rendering
83
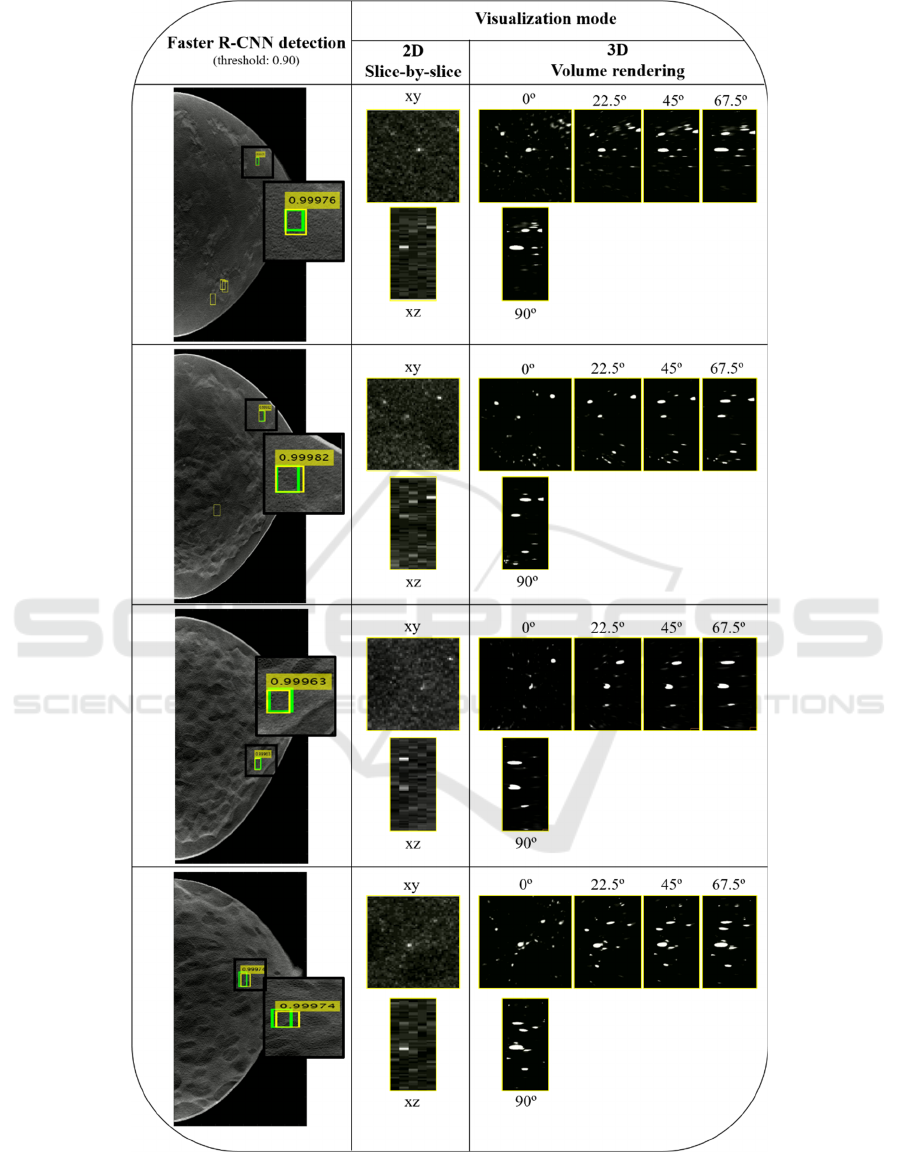
Figure 3: Example of four detection outputs obtained with a threshold of 0.9. Green: Ground truth BB; Yellow: predicted BB
(without score: FPs, with score: true positives). The predicted results are visualized with 2D slice-by-slice represented through
xy and xz planes and 3D VR with five different angles (0º, 22.5º, 45º, 67.5º and 90º).
BIOIMAGING 2022 - 9th International Conference on Bioimaging
84
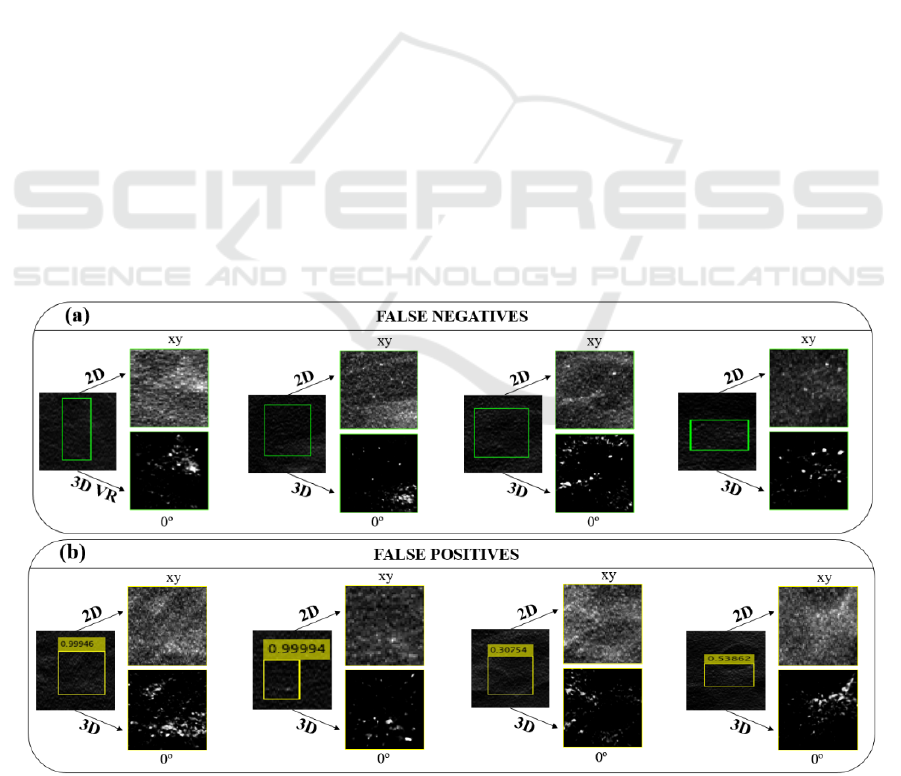
In Figure 4 (a) are presented four examples of
missed detections (false negatives) and on Figure 4
(b) four incorrect detections (FPs). The detection
results are then visualized through 2D slice-by-slice
and 3D VR at xy and 0º, respectively.
Visualization with 3D VR is very flexible and
includes parameters that can significantly change its
appearance, as is the case of transfer functions. The
Figure 5 shows the displays of four detected MC
obtained with 2D visualization and 3D VR using two
different transfer functions.
4 DISCUSSION AND
CONCLUSIONS
In this work, a Faster R-CNN detector was trained to
detect MCs in DBT data and the preliminary results
obtained were analyzed through two different forms
of visualization: standard 2D slice-by-slice and 3D
VR specifically developed for DBT. VR is presented
as a supplementary visualization of the detected MCs,
providing a more detailed and high quality
complementary information.
A DBT dataset from the publicly available
database at The Cancer Imaging Archive website
(VICTRE, 2018) was used. The train dataset
consisted in entire DBT images and also some regions
of interest containing only the MCs. These smaller
regions were included because the DBT images are
much bigger than the ground truth boxes of MCs,
reaching ratios of 30:1. As the size of the images was
not changed in order keep the necessary spatial
resolution to see the small microcalcifications, it was
important to have training inputs with an emphasis on
the object to be detected. Nevertheless, the test
dataset only contains entire images, as happens in
clinical or screening practice.
In this type of lesion detection task, the time
required for the detector to give an answer about the
input data is very important because it should be
useful in real time clinical practice. 29 seconds to
analyze a volume of DBT data (which can comprise
~130 million voxels) is reasonable but this value can
be improved using computers with greater power.
Also, this time is highly influenced by the feature
extraction network. For this reason, in this
preliminary work, we chose a network with a
reasonable balance between time and accuracy
(ResNet-18). However, other pre-trained networks
that may show better results and different detection
times should be studied.
The most used metric to analyze the performance
of this type of detector is the FROC curve. The results
obtained with this curve in Figure 2 and Table 3 reveal
that it was possible to achieve a sensitivity of around
60% with 4 FP/image. These preliminary results are
promising but need further improvement by adding
more training data, optimizing some network parame-
ters, training over a greater number of iterations and, as
already mentioned, using different pre-trained CNNs.
Figure 4: Example of four missed detections (false negatives) and four incorrect detections (FPs). The BB are visualized
thourgh 2D slice-by-slice in xy and 3D VR ar 0º.
Detection of Microcalcifications in Digital Breast Tomosynthesis using Faster R-CNN and 3D Volume Rendering
85
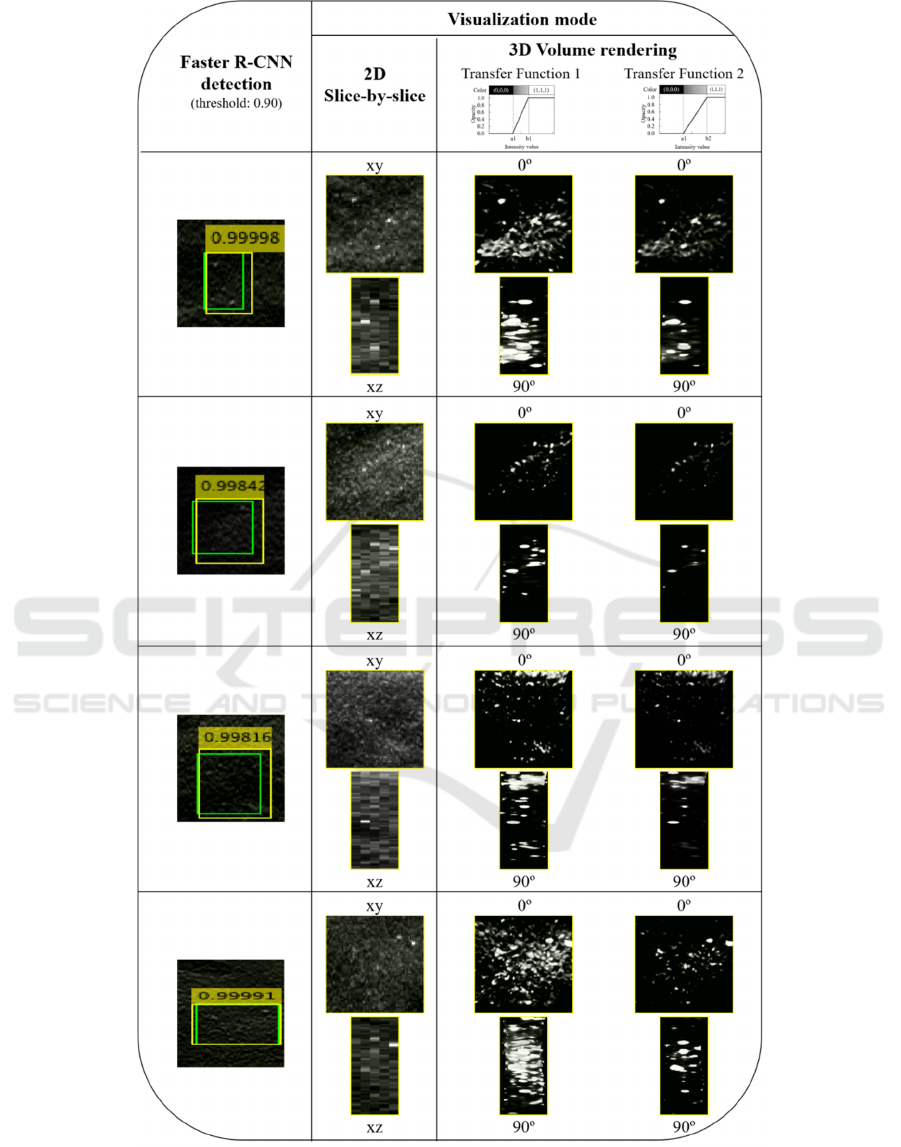
Figure 5: Example of four detection outputs. Green: Ground truth BB; yellow: predicted BB. The predicted results are
visualized with 2D MIP slice-by-slice represented through xy and xz planes and 3D VR with two different angles (0º and 90º).
Each 3D VR was obtained using two different transfer functions, allowing different levels of MC segmentations.
BIOIMAGING 2022 - 9th International Conference on Bioimaging
86

The output results of Figure 3 were obtained by
using a threshold of 0.9 (i.e., only scores above 0.9
were considered), which corresponds to a sensitivity
of about 50% for 0.8 FP/image. Four examples of
output from the Faster R-CNN were presented. The
number of FP found for this threshold (yellow BBs
without a score) varies from three (in the first case) to
zero (in the third and fourth case). The correctly
detected MCs by the yellow BBs with scores that
overlap the true BBs (green) were observed using the
two mentioned visualization methods. In general, the
MCs have a reasonable visibility in the xy plane with
the 2D MIP slice-by-slice over five adjacent slices but
are distorted in xz, losing some definition due to the
larger voxel size in z. The 3D VR at 0º and 90º can be
directly compared with the 2D visualization in the xy
and xz planes, respectively. For all cases, there is
better contrast and less noise in the VR at 0º, with
better discernment of the MCs. This superior
definition is noticeable when comparing the VR at 90º
with the xz plane of the 2D visualization. In the VR at
90º there is a clear discrimination of the MCs, and it
is possible to observe quite clearly the calcifications
individually and with some degree of reality.
It is also important to analyze some situations
where the detection was not correct (Figure 4). In the
case of false negatives, there were prominent lesions
that the algorithm did not detect (Figure 4 (a) last
column) and others where the MCs were somehow
masked, making their detection difficult (Figure 4 (a)
third column). In the case of FPs, in fact, there were
some situations where, even to the human eye, doubt
could be raised (Figure 4 (b) second and third
column). But, in the remaining situations, there is
essentially a spiculated noise that was interpreted as
MC. It is therefore important to further improve the
quality of detection.
On the other hand, the flexibility of visualization
using VR is demonstrated with the images in Figure
5. In addition to have the spatial distribution in the
three directions (x, y and z), with different transfer
functions we can filter the data to a greater or lesser
extent and, thus, segment better some lesions, such as
MCs. The transfer functions used in this work have
the opacity/color on the y-axis and the intensity
values on the x-axis. For intensities below a "A" value
the object data is transparent, while intensity values
above "B" (A<B) correspond to completely opaque
voxels. Between A and B the opacity values follow a
linear distribution. From transfer function 1 to
transfer function 2 (Figure 5) the value of B has been
increased to reduce the contribution to the
visualization of objects with lower intensities, making
those with higher intensities stand out, such as MCs.
In his way, it was possible to obtain a "cleaner"
visualization, as seen in Figure 5 in column of the
transfer function 2. This rendering parameter is a
great advantage in noisy data as can be seen in the last
case of Figure 5.
During training, no distinction was made between
the different types of breast density. However,
different densities correspond to data with slightly
different histograms. In the detection/analysis step, it
is important to understand if the detector behaves in
the same way for different densities (for example, it
is known that some lesions are more difficult to detect
in dense breasts than in fat breasts). From the
comparison made between the detection and
visualization of the four density groups, we can infer
that there were no differences between them.
As already mentioned, as far as we know, this is
the first work about MCs detection and localization in
a whole DBT image using deep learning CNNs such
as Faster R-CNN. Of the few published works found
in this area, all refer to soft tissue as masses. (Fan et
al., 2019) developed a CAD system for the
prescreening of ROIs and discrimination of true
masses and FPs in DBT using a Faster R-CNN. For
lesion-based mass detection, the sensitivity of their R-
CNN based CAD was 90% at 1.54 FP/volume. Later,
the same group, compared this work to a framework
of a 3D-Mask R-CNN for mass detection and
segmentation (Fan et al., 2020). For lesion-based
mass detection, the sensitivity of the 3D-Mask R-
CNN based CAD (segmentation) was 90% with 0.8
FPs/lesion, whereas the sensitivity of the Faster R-
CNN based CAD was 90% at 2.37 FPs/lesion. (Buda
et al., 2020) developed a single-phase deep learning
detection model for masses and architectural
distortions and achieved a sensitivity of 65% at 2
FPs/breast. (Li et al., 2021) propose a very interesting
work on Faster R-CNN that uses mammary gland
distribution as a prior information to detect
architectural distortions in DBT and achieved a
sensitivity of 80% at 1.85 FPs/volume for all
architectural distortions types.
A fair and direct comparison between our results
and these published data is not possible because they
analyze completely different lesions, those are
already optimized studies and of different
characteristics (for example, some use ROIs and not
the whole image to locate the lesions). Furthermore,
although architectural distortions are quite difficult to
locate, masses are more reasonable. Although masses
have densities similar to the rest of the breast tissue
and are often camouflaged, they are larger than
microcalcifications, facilitating training and learning.
It is possible to use images with less resolution and
Detection of Microcalcifications in Digital Breast Tomosynthesis using Faster R-CNN and 3D Volume Rendering
87

train more complex networks faster. Thus, we cannot
make a comparison between our results and those
already published, but we can conclude that, despite
our high FP values in this preliminary study, there is
potential to improve and achieve results similar to
those of the masses.
In conclusion, taking into account the preliminary
results presented, we conclude that detection and
location of MCs in DBT can be automatically
achieved using Faster R-CNN and visualization of
these results can benefit from another approach such
as 3D VR.
ACKNOWLEDGEMENTS
This work was supported by Universidade de Lisboa
(PhD grant) and Fundação para a Ciência e
Tecnologia – Portugal (Grant No.
SFRH/BD/135733/2018 and FCT-IBEB Strategic
Project UIDB/00645/2020).
REFERENCES
Badano, A., Graff, C. G., Badal, A., Sharma, D., Zeng, R.,
Samuelson, F. W., Myers, K. J. (2018). Evaluation of
Digital Breast Tomosynthesis as Replacement of Full-
Field Digital Mammography Using an In Silico
Imaging Trial. JAMA Network Open, 1(7), e185474-
e185474. doi: 10.1001/jamanetworkopen.2018.5474
Bernardi, D., Macaskill, P., Pellegrini, M., Valentini, M.,
Fantò, C., Ostillio, L., Houssami, N. (2016). Breast
cancer screening with tomosynthesis (3D
mammography) with acquired or synthetic 2D
mammography compared with 2D mammography
alone (STORM-2): a population-based prospective
study. The Lancet Oncology, 17(8), 1105-1113. doi:
https://doi.org/10.1016/S1470-2045(16)30101-2
Buda, M., Saha, A., Walsh, R., Ghate, S., Li, N., Święcicki,
A., Mazurowski, M. A. (2020). Detection of masses and
architectural distortions in digital breast tomosynthesis:
a publicly available dataset of 5,060 patients and a deep
learning model. arXiv:2011.07995. Retrieved from
https://ui.adsabs.harvard.edu/abs/2020arXiv20110799
5B
Bunch, P., Hamilton, J., Sanderson, G., & Simmons, A.
(1977). A Free Response Approach To The
Measurement And Characterization Of Radiographic
Observer Performance (Vol. 0127): SPIE.
Caumo, F., Zorzi, M., Brunelli, S., Romanucci, G., Rella,
R., Cugola, L., Houssami, N. (2018). Digital Breast
Tomosynthesis with Synthesized Two-Dimensional
Images versus Full-Field Digital Mammography for
Population Screening: Outcomes from the Verona
Screening Program. Radiology, 287(1), 37-46. doi:
10.1148/radiol.2017170745
Fan, M., Li, Y., Zheng, S., Peng, W., Tang, W., & Li, L.
(2019). Computer-aided detection of mass in digital
breast tomosynthesis using a faster region-based
convolutional neural network. Methods, 166, 103-111.
doi: https://doi.org/10.1016/j.ymeth.2019.02.010
Fan, M., Zheng, H., Zheng, S., You, C., Gu, Y., Gao, X., Li,
L. (2020). Mass Detection and Segmentation in Digital
Breast Tomosynthesis Using 3D-Mask Region-Based
Convolutional Neural Network: A Comparative
Analysis. [Original Research]. Frontiers in Molecular
Biosciences, 7(340). doi: 10.3389/fmolb.2020.599333
Fenton, J. J., Taplin, S. H., Carney, P. A., Abraham, L.,
Sickles, E. A., D'Orsi, C., Elmore, J. G. (2007).
Influence of Computer-Aided Detection on
Performance of Screening Mammography. New
England Journal of Medicine, 356(14), 1399-1409. doi:
10.1056/NEJMoa066099
Food and Drug Administration (FDA) U.S. . (2013).
Premarket Approval application supplement for the
Selenia Dimensions 3D System Retrieved May, 2021
Fotin, S., Yin, Y., Haldankar, H., Hoffmeister, J., &
Periaswamy, S. (2016). Detection of soft tissue
densities from digital breast tomosynthesis:
comparison of conventional and deep learning
approaches (Vol. 9785): SPIE.
Freer, P. E., Riegert, J., Eisenmenger, L., Ose, D., Winkler,
N., Stein, M. A., Hess, R. (2017). Clinical
implementation of synthesized mammography with
digital breast tomosynthesis in a routine clinical
practice. Breast Cancer Research and Treatment,
166(2), 501-509. doi: 10.1007/s10549-017-4431-1
Gilbert, F. J., Tucker, L., Gillan, M. G. C., Willsher, P.,
Cooke, J., Duncan, K. A., Duffy, S. W. (2015). Accuracy
of Digital Breast Tomosynthesis for Depicting Breast
Cancer Subgroups in a UK Retrospective Reading Study
(TOMMY Trial). Radiology, 277(3), 697-706. doi:
10.1148/radiol.20 15142566
Girshick, R. (2015). Fast R-CNN. Paper presented at the
Proceedings of the IEEE international conference on
computer vision.
Girshick, R., Donahue, J., Darrell, T., & Malik, J. (2014).
Rich feature hierarchies for accurate object detection
and semantic segmentation. Paper presented at the
Proceedings of the IEEE conference on computer vision
and pattern recognition.
Good, W. F., Abrams, G. S., Catullo, V. J., Chough, D. M.,
Ganott, M. A., Hakim, C. M., & Gur, D. (2008). Digital
breast tomosynthesis: a pilot observer study. AJR Am J
Roentgenol, 190(4), 865-869. doi: 10.2214/ajr.07.2841
Gur, D., Abrams, G. S., Chough, D. M., Ganott, M. A.,
Hakim, C. M., Perrin, R. L., Bandos, A. I. (2009).
Digital breast tomosynthesis: observer performance
study. AJR Am J Roentgenol, 193(2), 586-591. doi:
10.2214/ajr.08.2031
Hofvind, S., Hovda, T., Holen, Å. S., Lee, C. I., Albertsen,
J., Bjørndal, H., Skaane, P. (2018). Digital Breast
Tomosynthesis and Synthetic 2D Mammography
versus Digital Mammography: Evaluation in a
Population-based Screening Program. Radiology,
287(3), 787-794. doi: 10.1148/radiol.2018171361
BIOIMAGING 2022 - 9th International Conference on Bioimaging
88

. ImageNet. (2021) Retrieved October, 2021, from
http://www.image-net.org
Katzen, J., & Dodelzon, K. (2018). A review of computer
aided detection in mammography. Clinical Imaging, 52,
305-309. doi: https://doi.org/10.1016/j.clinimag.20
18.08.014
Lai, X., Yang, W., & Li, R. (2020). DBT Masses Automatic
Segmentation Using U-Net Neural Networks. Comput
Math Methods Med, 2020, 7156165. doi:
10.1155/2020/7156165
Lång, K., Andersson, I., Rosso, A., Tingberg, A., Timberg,
P., & Zackrisson, S. (2016). Performance of one-view
breast tomosynthesis as a stand-alone breast cancer
screening modality: results from the Malmö Breast
Tomosynthesis Screening Trial, a population-based
study. Eur Radiol, 26(1), 184-190. doi:
10.1007/s00330-015-3803-3
Lehman, C. D., Wellman, R. D., Buist, D. S. M.,
Kerlikowske, K., Tosteson, A. N. A., Miglioretti, D. L.,
& Consortium, f. t. B. C. S. (2015). Diagnostic
Accuracy of Digital Screening Mammography With
and Without Computer-Aided Detection. JAMA
Internal Medicine, 175(11), 1828-1837. doi:
10.1001/jamainternmed.2015.5231
Li, Y., He, Z., Lu, Y., Ma, X., Guo, Y., Xie, Z., Chen, H.
(2021). Deep learning of mammary gland distribution
for architectural distortion detection in digital breast
tomosynthesis. Physics in Medicine & Biology, 66(3),
035028. doi: 10.1088/1361-6560/ab98d0
MathWorks. (2021). MATLAB trainFasterRCNN
ObjectDetector Retrieved October, 2021, from
https://www.mathworks.com/help/vision/
ref/trainfasterrcnnobjectdetector.html
Mota, A. M., Clarkson, M., Orvalho, L., Almeida, P., &
Matela, N. (2020). Calculation of transfer functions for
volume rendering of breast tomosynthesis imaging.
Paper presented at the 15th International Workshop on
Breast Imaging (IWBI2020), Leuven, Belgium.
Ren, S., He, K., Girshick, R., & Sun, J. (2015). Faster R-
CNN: Towards real-time object detection with region
proposal networks. Advances in neural information
processing systems, 28, 91-99.
Samala, R. K., Chan, H.-P., Hadjiiski, L., Helvie, M. A.,
Wei, J., & Cha, K. (2016). Mass detection in digital
breast tomosynthesis: Deep convolutional neural
network with transfer learning from mammography.
Med Phys, 43(12), 6654-6654. doi: 10.1118/1.4967345
Schroeder, W., Martin, K., & Lorensen, B. (2006). The
Visualization Toolkit: An Object-oriented Approach to
3D Graphics (4rd ed.). USA: Kitware.
Sechopoulos, I., Teuwen, J., & Mann, R. (2020). Artificial
intelligence for breast cancer detection in
mammography and digital breast tomosynthesis: State
of the art. Seminars in Cancer Biology. doi:
https://doi.org/10.1016/j.semcancer.2020.06.002
Suetens, P. (2009). Medical image analysis Fundamentals
of Medical Imaging (2nd ed., pp. 159-189). New York:
Cambridge University Press.
Sung, H., Ferlay, J., Siegel, R. L., Laversanne, M.,
Soerjomataram, I., Jemal, A., & Bray, F. (2021). Global
Cancer Statistics 2020: GLOBOCAN Estimates of
Incidence and Mortality Worldwide for 36 Cancers in
185 Countries. CA Cancer J Clin, 71(3), 209-249. doi:
https://doi.org/10.3322/caac.21660
Tabár, L., Dean, P. B., Chen, T. H.-H., Yen, A. M.-F., Chen,
S. L.-S., Fann, J. C.-Y., Duffy, S. W. (2019). The
incidence of fatal breast cancer measures the increased
effectiveness of therapy in women participating in
mammography screening. Cancer, 125(4), 515-523.
doi: https://doi.org/10.1002/cncr.31840
Venson, J. E., Albiero Berni, J. C., Edmilson da Silva Maia,
C., Marques da Silva, A. M., Cordeiro d'Ornellas, M.,
& Maciel, A. (2017). A Case-Based Study with
Radiologists Performing Diagnosis Tasks in Virtual
Reality. Stud Health Technol Inform., 245, 244-248.
VICTRE. (2018). The VICTRE Trial: Open-Source, In-
Silico Clinical Trial For Evaluating Digital Breast
Tomosynthesis, 2021, from https://wiki.cancerimaging
archive.net/display/Public/The+VICTRE+Trial%3A+
Open-Source%2C+In-Silico+Clinical+Trial+For+Eval
uating+Digital+Breast+Tomosynthesis
VTK. (2020). Visualization Toolkit - VTK Retrieved
February, 2020, from http://www.vtk.org/
Zackrisson, S., Lång, K., Rosso, A., Johnson, K., Dustler,
M., Förnvik, D., Andersson, I. (2018). One-view breast
tomosynthesis versus two-view mammography in the
Malmö Breast Tomosynthesis Screening Trial
(MBTST): a prospective, population-based, diagnostic
accuracy study. The Lancet Oncology, 19(11), 1493-
1503. doi: 10.1016/s1470-2045(18)30521-7
Detection of Microcalcifications in Digital Breast Tomosynthesis using Faster R-CNN and 3D Volume Rendering
89
