
Intelligent Diagnosis of Breast Cancer with Thermograms
using Convolutional Neural Networks
Nurduman Aidossov
1a
, Aigerim Mashekova
1b
, Yong Zhao
1c
, Vasilios Zarikas
1d
,
Eddie Yin Kwee Ng
2e
and Olzhas Mukhmetov
1f
1
School of Engineering and Digital Sciences, Nazarbayev University, 53 Kabanbai batyr street, Nur-Sultan, Kazakhstan
2
School of Mechanical and Aerospace Engineering, Nanyang Technological University, 50 Nanyang Avenue,
639798, Singapore
Keywords: Breast Cancer, Thermography, Convolutional Neural Network, Intelligent Diagnosis.
Abstract: Breast cancer is a serious public health issue among women all over the world. The main methods of breast
cancer diagnosis include ultrasound, mammography and Magnetic Resonance Imaging (MRI). However, the
existing methods of diagnosis are not appropriate for regular mass screening in short intervals. On the other
hand, there is one non-invasive and low-cost method for mass and regular screening which is the so-called
thermography. Recent studies show rapid quality improvement of thermal cameras as well as distinct
development of machine learning techniques that can be combined together to enhance the technology of
breast cancer detection. Machine learning technologies can potentially be used to support the interpretation
of thermal images and help physicians to automatically determine the locations and sizes of tumors, blood
perfusion, and other patient-specific properties of breast tissues. In this study, we aim to develop CNN
techniques for intelligent precision breast tumor diagnosis. The main innovation of our work is the use of
breast thermograms from a multicenter database without preprocessing for binary classification. The results
presented in this paper highlight the usefulness and efficiency of deep learning for standardized analysis of
thermograms. It is found that the model developed can have an accuracy of 80.77%, sensitivity of 44.44 %
and the specificity of 100%.
1 INTRODUCTION
Breast cancer is one of the most serious health
problems with possible fatal consequences for
women in modern times. The risk factors and causes
could include changes in the cell genome, hormonal
dysfunction, family history, hormone therapy,
lifestyle features and undesirable life habits (Francis,
2017; Singh, 2020; NCI, 2014; WHO, 2014).
Currently the mainstream methods of breast
cancer diagnosis include ultrasound, mammography
and MRI. The mammograms also known as gold
standard method of breast cancer diagnosis.
However, it is mainly recommended for women over
a
https://orcid.org/0000-0002-9555-7818
b
https://orcid.org/0000-0001-6246-9494
c
https://orcid.org/0000-0002-9574-4787
d
https://orcid.org/0000-0002-0419-1858
e
https://orcid.org/0000-0002-5701-1080
f
https://orcid.org/0000-0001-7904-0870
40 years old as an invasive method which uses
ionizing radiation (X-rays). Ultrasound is
recommended as a first test to detect whether a lump
is a cyst filled with liquid or a solid tumor. Ultrasound
examination uses high-frequency acoustic waves. It is
useful for younger patients as their mammary glands
have denser structure. However the success of
ultrasound diagnosis critically depends on the
experience of the specialist conducting the test. MRI
is the most effective and accurate method to diagnose
breast cancer or tumor. But up to now this is the most
expensive method, which could only be found in large
and well equipped hospitals.
The existing methods of diagnosis are not
appropriate for regular mass screening in short
598
Aidossov, N., Mashekova, A., Zhao, Y., Zarikas, V., Ng, E. and Mukhmetov, O.
Intelligent Diagnosis of Breast Cancer with Thermograms using Convolutional Neural Networks.
DOI: 10.5220/0010920700003116
In Proceedings of the 14th International Conference on Agents and Artificial Intelligence (ICAART 2022) - Volume 2, pages 598-604
ISBN: 978-989-758-547-0; ISSN: 2184-433X
Copyright
c
2022 by SCITEPRESS – Science and Technology Publications, Lda. All rights reserved

intervals. In addition, they are not suited for regular
breast self-examination (BSE) as promoted by WHO
(Sung, 2021; WHO, 2019) for ultimate minimization
of breast cancer fatalities. Thus, a lot of breast cancer
cases are diagnosed in late stages, although early
diagnosis is very important for effective treatment
with good prognosis (NCI, 2014).
One of the non-invasive and low cost method for
mass and regular screening is thermography. It is well
known that body temperature is an accurate indicator
of some disorder in the human body. The body
temperature distribution depends on such factors as:
blood perfusion, metabolic rate and ambient
temperature. Any abnormality in the body such as
tumor could be detected by thermography (Melal,
2016; Kandlikar, 2017; Ito, 2019).
Recent studies (Sing, 2019; Kandlikar, 2017;
Jiang, 2010; Bezerra, 2020; Saniei, 2016;
Omranipour, 2016; Sarigoz, 2020; Zeng, 2020)
discovered fast quality improvement of thermal
cameras as well as distinct development of machine
learning techniques that can be used to enhance the
technology of breast cancer detection. Machine
learning algorithms in principle, can be used to
support the interpretation of thermal images and help
physicians to automatically make diagnosis and even
to determine the locations and sizes of tumors, blood
perfusion, and other patient-specific properties of
breast tissues (Khan, 2018).
One recently developed image recognition method
is the so called convolutional neural network (CNN),
which is a deep-learning neural network system that
processes input images by extracting specific training
weights and biases to determine meaningful
characteristics that distinguish one input image from
another (Khan, 2018). Thereby, a diagnosis tool can
be built using CNNs in order to classify “healthy” and
“with-tumor” types of thermograms without any
human experts’ intervention.
In early studies of CNN the segmentation was an
important part of image recognition. There are a lot
of studies dedicated to different methods of image
recognition among them studies (Antonini, 2015;
Dayakshini, 2015; Kermani, 2015; Mahmoudzadeh,
2015; Diaz-Cortes, 2018; Etehad, 2010; Golestani,
2014). Study by Antonini et al. estimated the ability
of thermogram diagnose multicentric or multifocal
breast carcinomas (Antonini, 2017). Study by
Dayakshini segmented thermograms by using
projection profile method and by asymmetry analysis,
comparing the left and right breasts (Dayakshini,
2015). Study by Kermani used Gaussian mixture
model segmentation method (Kermani, 2015). Study
by Mahmoudzadeh used the novel method of Hidden
Markov Model to optimize the segmentation
(Mahmoudzadeh, 2015). Study by Diaz-Cortes
considers the spatial information of the pixel
contained in the image for the segmentation (Diaz-
Cortes, 2018). Further studies (Etehad, 2010;
Golestani, 2014) used and compared k-means, fuzzy
c-means and level set segmentation method to find
out the most accurate.
The classification of the breast images were done
by using feedforward neural network and radial basis
function classification (Ng, 2007). In addition one of
the common method of classification was Support
Vector Machine (SVM), which proved its
effectiveness in different studies (Madhu, 2016;
Milosevic, 2014). Other popular methods of Neural
Network classification are k-nearest neighbors
method and fast fuzzy c-mean method, used in the
studies (Milosevic, 2014; Gaber, 2015).
Our study is one of the next step in the
development of CNN and Thermography. The study
develops an efficient CNN model which uses breast
thermograms for binary classification. The main
innovation of the current work is the use of breast
thermograms with multi-view images from a
multicenter database without preprocessing for
binary classification. The results highlight the
usefulness of deep learning for standardized analysis
of thermograms.
2 MATERIALS AND METHODS
The public Visual Lab database (Visual Lab, 2021),
which contains about 287 thermal images, was used
to extract thermal images as input for our diagnosis
tool. However, for the present study only 76 thermal
images were selected as the most appropriate. These
thermal images were accompanied with doctors’
diagnosis and also had three views: frontal, left and
right.
In addition a second database was used which
consists of thermograms of patients obtained in the
"Multifunctional Medical Center" of the Nur-Sultan
city of Kazakhstan by the authors. 38 thermal images
most suitable for this work were selected. The
database currently includes breast thermograms for
women between the ages of 18 and 80. To protect the
privacy of patients, the nomenclature of breast
thermograms has been designed so that every image
in the database is given a distinguished name.
Temperature distributions on the breast skin
surfaces were recorded by the thermal camera IRTIS-
2000 ME, which is used for medical research and the
diagnosis of a wide range of illnesses, including
Intelligent Diagnosis of Breast Cancer with Thermograms using Convolutional Neural Networks
599
oncological diseases. Its temperature resolution for
the entire field of view is 0.02 °C and its temperature
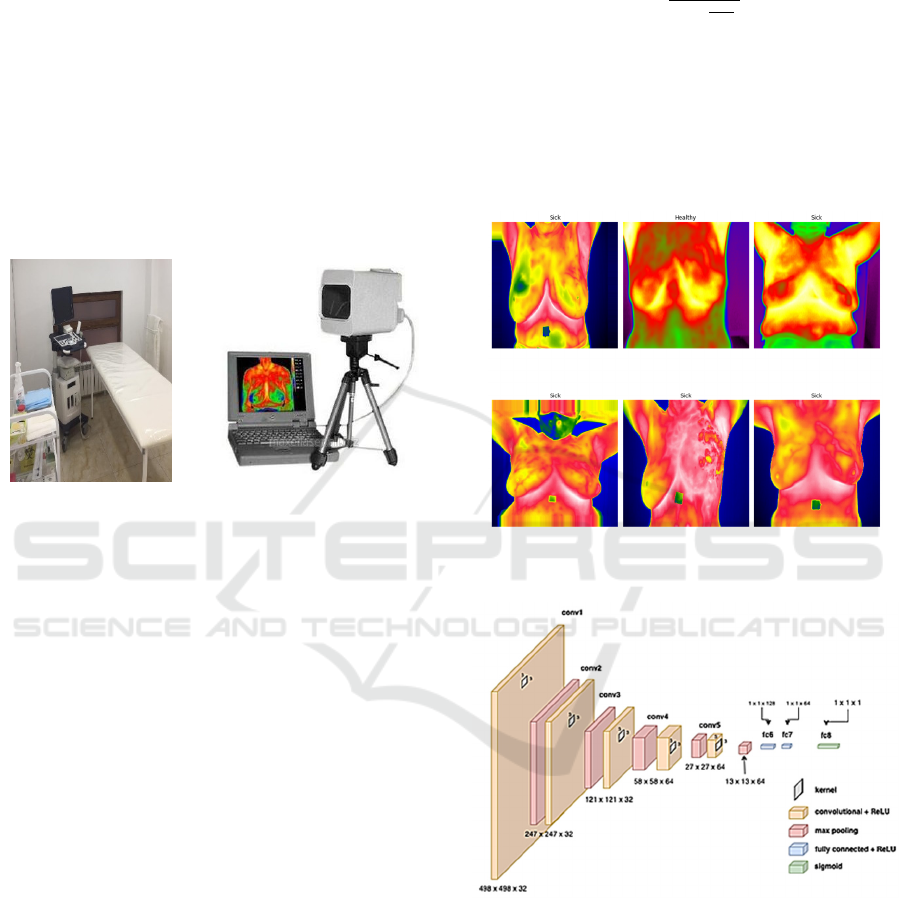
measurement accuracy is 0.1 °C (see Figure 1).
An experimental procedure was developed,
together with the instructions for conducting the
experiment with which the doctor-oncologist was
familiarized. When conducting an experiment,
patients underwent a familiarization procedure with
the research being conducted and gave their consent
to participate in the research, since participation was
voluntary. The study was approved by the
institutional ethics committee of Nazarbayev
University AEO (identification number is
294/17062020).
Figure 1: Clinical office for collecting patient data and IR
camera IRTIS-2000 ME.
A typical breast thermogram used has three RGB
channels with a square size of 224 × 224 × 3 by
numbers of pixels. A breast thermogram should
include half the armpit to analyze the entire breast
tissue and nearby ganglion groups. The area of interest
of the breast thermogram shows a significant increase
in temperature compared to the temperature in the
adjacent area for a patient with breast tumor.
Examples of thermograms used are shown in Figure 2.
Two databases were combined to increase the size
of the dataset, since the format of the thermograms
and their images were similar. After they were mixed,
the dataset was classified into two sets: Training and
Validation ones, containing 88 and 26 images,
respectively.
Image classification is the process of classifying
images according to their visual contents. The
learning process for neural network involves
recognizing breast thermograms with a
predetermined label, for example healthy and sick.
This problem is known as supervised learning
(Simeone, 2018). Thus, in the current study, the
image set was divided into “Healthy” and “Sick” (as
shown in Figure 2). The sigmoid function is a non-
linear continuous function. Classification in CNN is
based on inference, which implies that its output can
be the entire range of x to the domain [0,1] of f(x).
Mathematically, the sigmoid function is defined by
(Sanjeev, 2017):
𝑓
𝑥
(1)
The parameters α and β define the center and width of
the sigmoid function, respectively.
In the current study, the CNN architecture consists
of 5 layers of convolution and pooling. This is
followed by flattening and 2 fully connected layers
with the latter to obtain a binary output of probability
(Figure 3).
Figure 2: An example of segmentation and division of
thermal images into "Sick" and "Healthy".
Figure 3: Consolidated architecture of the CNN with the
display of parameters at each level.
CNN is a computational model that typically
consists of three types of neural layers: convolution,
pooling and fully connected ones. The convolution
and pooling layers extract features from the input
images, while the fully connected layer converts the
extracted features into final output, such as binary
classification. In the convolution layers have a small
grid filled with parameters called kernel as a feature
extractor, applied at each image position. One layer
ICAART 2022 - 14th International Conference on Agents and Artificial Intelligence
600
feeds its output into the next layer, thus extracted
features may progressively grow more complex as a
forward process. Then the parameters in kernels can
be optimized through gradient-based optimization
scheme in a backward propagation process called
training, which is performed so as to minimize the
difference between outputs and given labels.
A batch size of 16 was used as a standard number
of training examples utilized in one iteration of
forward/backward pass. Activation function
Rectified Linear Unit (ReLU) was used in the CNN
architecture in the convolution layer. The size of the
kernel is 3×3 pixels. First we began with a filter value
of 32 (32 filters) in the first 3 layers, and the following
two layers had the filter size of 64. After the
convolution, flattening the input after CNN layers is
standard procedure to go with and also adding the
ANN layer as well.
First callback list was defined as follows. For the
model to learn effectively it was necessary to define
the EarlyStopping function. It was used to halt the
epochs on metric of “loss” value and “patience”
value. This function was used to avoid overfitting. In
this CNN model, “loss” value is tracked and
“patience” of 3 epochs is defined. What it means is
that once the loss value reaches the minimum, and in
the next 3 iterations the value of loss increases, then
training will stop at that epoch. Another adherence is
reducing the learning rate. So, once the metric
stagnates, the learning rate reduces. Patience is 2 for
this callback, and if no improvement is detected, then
the learning rate reduces by a factor of 0.3, because in
that way loss value will decrease gradually and finally
arrive to the lowest value.
Another important parameter to define was class
weight. Since the dataset consisted mostly of patients
who had breast cancer, then it was necessary to assign
higher class weight to minority classes, so it could
learn in a balanced way from all classes.
CNN learning took 23 iterations to reach the
stopping point as mentioned above. Each iteration
took 10-11 seconds on a computer whose technical
specifications are as follows, in Table 1:
Table 1: CPU - Intel® Xeon® Silver 4210 Processor.
Total Cores 10
Total Threads 20
Max Turbo Frequency3 3.20 GHz
Processor Base Frequency2 2.20 GHz
Cache 13.75 MB
RAM size 64GB
Maximum Memory Speed 2400 MHz
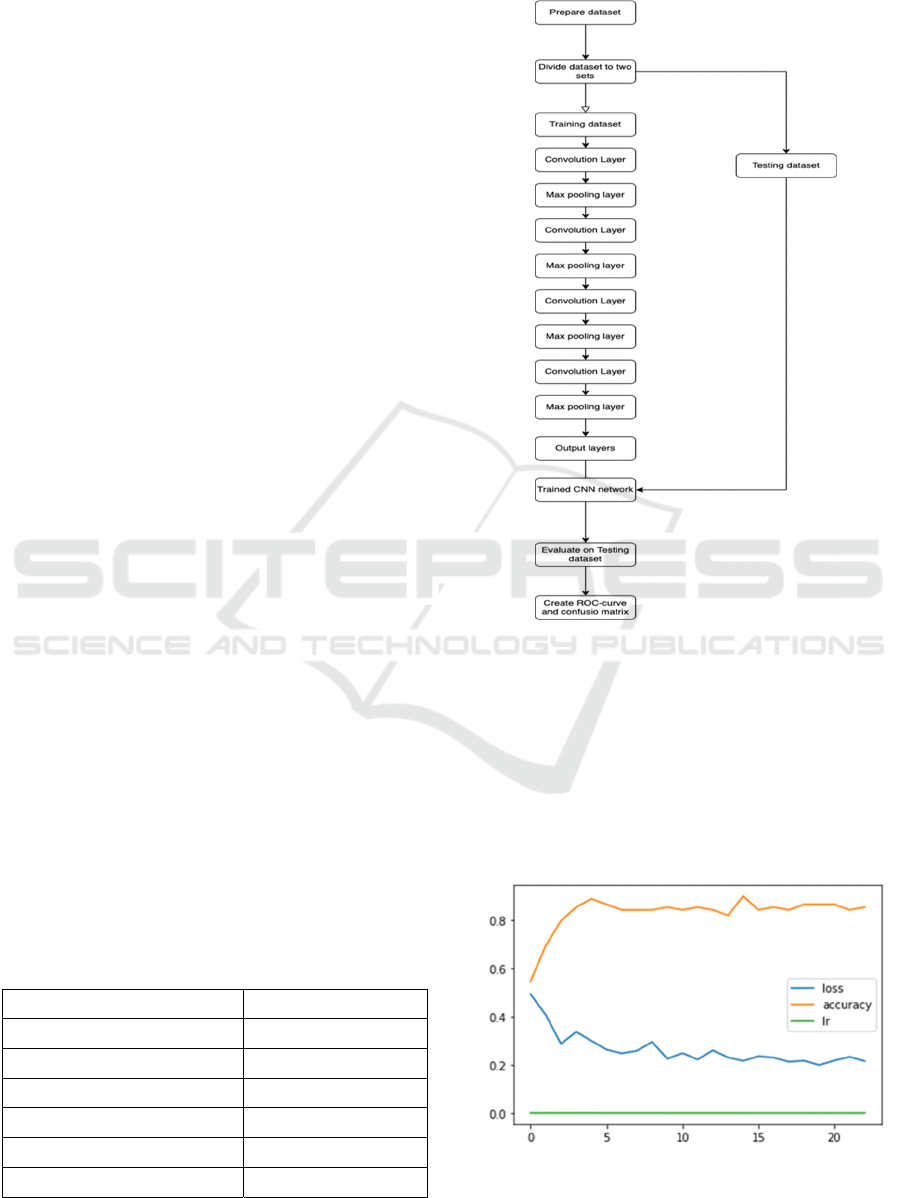
In summary, the overall flow diagram of the proposed
study is presented on Figure 4.
Figure 4: The overall flow diagram of the proposed study.
3 RESULTS AND DISCUSSION
During training with stochastic gradient descent
iterations the loss gradually decreased to 0.2151,
while the accuracy of the training data increases to
80.77%%. The learning rate remains relatively low
from 30.0e-05 to 9.0e-05 as seen in Figure 5.
Figure 5: Graph of iteration versus loss, accuracy and
learning rate values.
Intelligent Diagnosis of Breast Cancer with Thermograms using Convolutional Neural Networks
601
The accuracy of prediction of the CNN model is
80.77%, as shown in Figure 6.
2/2 [==============================] – 127
ms / step – loss: 0.3695 - accuracy: 0.8077
Figure 6: Displaying the accuracy of the CNN model.
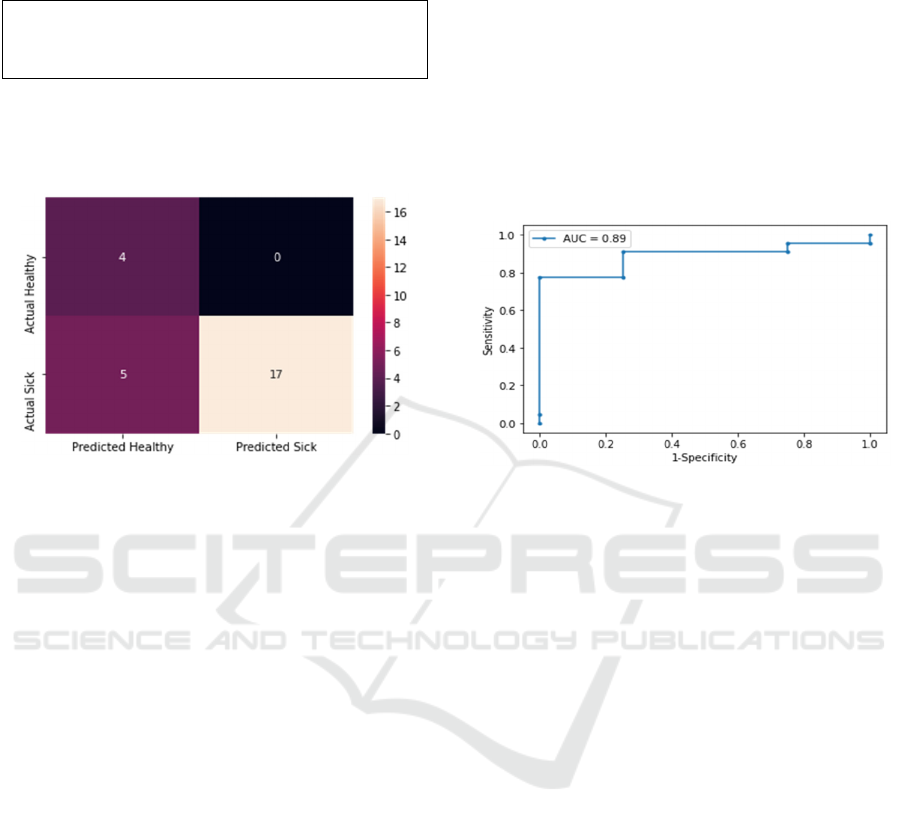
To analyze the inaccuracies, a confusion matrix was
plotted.
Figure 7: Confusion matrix showing the correctly and
incorrectly predicted test data for each class.
In the proposed CNN study, the network was
trained with thermograms with doctor’s diagnoses so
that it could later be used to give a direct diagnostic
response with a normal or abnormal decision when
fed with a thermogram without the need for manual
preprocessing and training of the features. Thus, it is
easier to analyze thermograms in a standardized way,
as opposed to studies with human judgment.
One limitation of this study is that the number of
cases for analysis is less than the amount of data
typically collected for deep learning. Although data
augmentation can partially solve this problem, this
disadvantage can be eliminated by using data
exchange structures such as those implemented in
neuroimaging (Yamashita, 2018). It can also be
solved if it is combined with physics-driven and
PINN diagnosis (Mukhmetov, 2021; Karniadakis,
2021), which we are working on.
Since thermography is intended as an adjunct to
mammography in breast cancer screening, its most
important value is sensitivity to detect the possible
presence of an abnormality (Lalkhen, 2008). The
study showed a sensitivity of 44.44 %. Along with
this, the performance of the classifier was assessed in
terms of sensitivity, specificity, and accuracy. In
general, the accuracy value was 80.77%, which can
be considered quite high, since it allows detecting
breast cancer with almost 81% confidence in
thermograms. The specificity of the classifier was
100%.
Another metric that was used is ROC (receiver
operating characteristic) curve and AUC value
(Figure 8).
A negative predicted value (NPV) indicates the
likelihood that the patient is not sick if the test is
negative. Figure 7 shows that 5 out of 26 were
incorrectly identified as healthy when in fact they are
sick. The authors acknowledge that the positive
predictive value (PPV) is low and is a metric that we
would like to improve.
Figure 8: ROC curve and AUC value.
Main innovation of our work is the use of breast
thermograms from a multicenter database without
preprocessing the images for efficient and automatic
binary classification. The results presented in this
paper highlight the usefulness of deep learning for
standardized analysis of thermograms with
efficiency. Future work will apply these algorithms in
a longitudinal study without tagged data and evaluate
their effectiveness in comparison with experts.
Furthermore, an integrated methodology that will
combine Bayesian Networks (Zarikas, 2015;
Zholdasbayeva, 2020) and CNNs will be developed
in order not only to improve the diagnosis but also to
dig out the key factors that determine a successful
diagnosis. It is important to remember that the current
deep learning methods cannot yet replace the
clinician when making a clinical diagnosis, but it can
help the clinician make more accurate diagnoses and
treatment recommendations. Furthermore, before
widespread adoption in clinical practice, deep
learning models should be tested on representative
datasets of different communities in order to solve
generalization problems for new populations.
4 CONCLUSIONS
Early detection of breast cancer remains an important
part of the fight against breast cancer. World Health
ICAART 2022 - 14th International Conference on Agents and Artificial Intelligence
602

Organization recommends regular self-examination
to detect the breast cancer at early stages. The review
of the previous studies shows that thermography is a
promising supplementary tool for breast cancer
detection at early stages. The combination of
thermography and computer technology can
considerably enhance breast cancer detection at early
stages. Modern models of neural networks have led to
an increase in the accuracy of classification of breast
cancer thermograms, especially in distinguishing
between healthy and deceased cases.
In the present study, a successful diagnosis tool is
presented using convolutional neural network (CNN)
to implement and validate the deep learning model.
This algorithm could accurately classify breast cancer
thermograms as “Healthy” and “Sick” using two
databases and utilizing multi-view images. Moreover,
our results were calculated automatically without any
image pre-processing to obtain perspective sensitivity
values, thus reducing human error and bias and
improving efficiency. Reason of that is usage of Data
Augmentation technique that is artificially enlarging
the dataset size that helps for CNN to better learn and
distinguish in binary classification. The limitation of
the present study is that the patients’ data available
for the analysis were less than the amount of data
typically collected for deep learning. In addition, the
positive predictive value (PPV) is still considered
low, which can be further improved via physics-
informed Neural Network (PINN) models in the
future which are being developed by us.
ACKNOWLEDGEMENTS
The authors are grateful to the Ministry of Education
and Science of the Republic of Kazakhstan for
financing this work through the grant for the
“Application of artificial intelligence to complement
thermography for breast cancer prediction”
(AP08857347) and Nazarbayev University for
managing the research project.
REFERENCES
Antonini S., Kolarić D., Herceg Ž., et al. “Thermographic
visualization of multicentric breast carcinoma,” in
Proceedings of the 2015, 57th International Symposium
ELMAR (ELMAR), pp. 13–16, IEEE, Zadar, Croatia,
September 2015.
Bezerra, L.A.; Ribeiro, R.R.; Lyra, P.R.M.; Lima, R.C.F.
An empirical correlation to estimate thermal properties
of the breast and of the breast nodule using
thermographic images and optimization techniques. Int.
J. Heat Mass Transf. 2020, 149, 119215.
Breast Cancer Treatment (PDQ®). NCI. 23 May 2014.
Archived from the original on 5 July 2014. Retrieved
29 June 2014. https://www.cancer.gov/types/breast/
hp/breast-treatment-pdq Accessed on May 2021
Dayakshini, K. Surekha, K. Prasad, and K. V. Rajagopal,
“Segmentation of breast thermogram images for the
detection of breast cancer: a projection profile
approach,” International Journal of Image and
Graphics, vol. 3, no. 1, pp. 47–51, 2015.
Díaz-Cortés M.-A., Ortega-Sánchez N., Hinojosa S., et al.
“A multi-level thresholding method for breast
thermograms analysis using dragonfly algorithm,”
Infrared Physics & Technology, vol. 93, pp. 346–361,
2018.
EtehadTavakol M., Sadri S., Ng E. Y. K. “Application of
K-and fuzzy c-means for color segmentation of thermal
infrared breast images,” Journal of Medical Systems,
vol. 34, no. 1, pp. 35–42, 2010.
Francis, S.V.; Sasikala, M.; Jaipurkar, S.D. Detection of
Breast Abnormality Using Rotational Thermography.
In Application of Infrared to Biomedical Sciences;
Springer: Singapore, 2017; pp. 133–158.
Francis S. V., Sasikala M., Bhavani Bharathi G., Jaipurkar
S. D. “Breast cancer detection in rotational
thermography images using texture features,” Infrared
Physics & Technology, vol. 67, pp. 490–496, 2014.
Fan, Guo-Feng & Yu, Meng & Dong, Song-Qiao & Yeh,
Yi-Hsuan & Hong, Wei-Chiang, 2021. "Forecasting
short-term electricity load using hybrid support vector
regression with grey catastrophe and random forest
modeling," Utilities Policy, Elsevier, vol. 73(C).
Golestani N., Etehad Tavakol M., Ng E. Y. K. “Level set
method for segmentation of infrared breast
thermograms,” EXCLI Journal, vol. 13, pp. 241–251,
2014.
Gaber T., Ismail G., Anter A., et al. “Thermogram breast
cancer prediction approach based on neutrosophic sets
and fuzzy c-means algorithm,” in Proceedings of the
2015 37th Annual International Conference of the IEEE
Engineering in Medicine and Biology Society (EMBC),
pp. 4254–4257, IEEE, Milan, Italy, August 2015.
Ito, K.; Asnida, A.W.; Daud, S.A.; Ng, E.Y.K. Thermal
analysis on 3D breast cancer model. In Computational
Modelling and Simulation for Biomedical
Applications; Wahab, A.S., Mohd, A.S.; Eds.; Penerbit
UTM Press: Skudai, Malaysia, 2019; pp. 165–186.
Jiang, L.; Zhan, W.; Loew, M.H. Modeling static and
dynamic thermography of the human breast under
elastic deformation. Phys. Med. Biol. 2010, 56, 187–
202, doi:10.1088/0031-9155/56/1/012.
Kandlikar, S.G.; Perez-Raya, I.; Raghupathi, P.A.;
Gonzalez-Hernandez, J.-L.; Dabydeen, D.; Medeiros,
L.; Phatak, P. Infrared imaging technology for breast
cancer detection – Current status, protocols and new
directions. Int. J. Heat Mass Transf. 2017, 108, 2303–
2320, doi:10.1016/j.ijheatmasstransfer.2017.01.086.
Khan S., Rahmani H., Shah S. A. A., Bennamoun M. A
guide to convolutional neural networks for computer
Intelligent Diagnosis of Breast Cancer with Thermograms using Convolutional Neural Networks
603

vision // Synth. Lect. Comput. Vis., 2018 – Vol. 8, No.
1 – P. 1 – 207.
Kermani S., Samadzadehaghdam N., EtehadTavakol M.
“Automatic color segmentation of breast infrared
images using a Gaussian mixture model,” Optik, vol.
126, no. 21, pp. 3288–3294, 2015.
Karniadakis, G.E., Kevrekidis, I.G., Lu, L. et al. Physics-
informed machine learning. Nat Rev Phys 3, 422–440
(2021). https://doi.org/10.1038/s42254-021-00314-5.
Lalkhen A.G., McCluskey A. Clinical tests: sensitivity and
specificity. Contin Educ Anaesth Crit Care Pain. 2008;
8: 221–223.
Melal, I.; Kengne, E.; el Guemhioui, K.; Lakhssassi, A. 3D
Modelling using the finite element method for
directional re-moval of a cancerous tumor. J. Biomed.
Sci. 2016, 5, 1–8.
Mahmoudzadeh E., Montazeri M. A., Zekri M., Sadri S.
“Extended hidden Markov model for optimized
segmentation of breast thermography images,” Infrared
Physics & Technology, vol. 72, pp. 19–28, 2015.
Madhu H., Kakileti S. T., Venkataramani K., Jabbireddy S.
“Extraction of medically interpretable features for
classification of malignancy in breast thermography,”
in Proceedings of the 2016 38th Annual International
Conference of the IEEE Engineering in Medicine and
Biology Society (EMBC), pp. 1062–1065, IEEE,
Orlando, FL, USA, August 2016.
Milosevic M., Jankovic D., Peulic A. “Thermography based
breast cancer detection using texture features and
minimum variance quantization,” EXCLI Journal, vol.
13, pp. 1204–1215, 2014.
Mukhmetov, O.; Mashekova, A.; Zhao, Y.; Midlenko, A.;
Ng, E.Y.K.; Fok, S.C. Patient/Breast-Specific
Detection of Breast Tumor Based on Patients’
Thermograms, 3D Breast Scans, and Reverse Thermal
Modelling. Appl. Sci. 2021, 11, 6565.
https://doi.org/10.3390/app11146565.
Ng E. Y. K., Acharya U. R., Keith L. G., Lockwood S.
“Detection and differentiation of breast cancer using
neural classifiers with first warning thermal sensors,”
Information Sciences, vol. 177, no. 20, pp. 4526–4538,
2007.
Omranipour, R.; Kazemian, A.; Alipour, S.; Najafi, M.;
Alidoosti, M.; Navid, M.; Alikhassi, A.; Ahmadinejad,
N.; Bagheri, K.; Izadi, S. Comparison of the Accuracy
of Thermography and Mammography in the Detection
of Breast Cancer. Breast Care 2016, 11, 260–264,
doi:10.1159/000448347.
Saniei, E.; Setayeshi, S.; Akbari, M.E.; Navid, M.
Parameter estimation of breast tumour using dynamic
neural network from thermal pattern. J. Adv. Res. 2016,
7, 1045–1055.
Sarigoz, T.; Ertan, T. Role of dynamic thermography in
diagnosis of nodal involvement in patients with breast
cancer: A pilot study. Infrared Phys. Technol. 2020,
108, 103336, doi:10.1016/j.infrared.2020.103336.
Singh, D.; Singh, A.K. Role of image thermography in early
breast cancer detection- Past, present and future.
Comput. Methods Programs Biomed. 2020, 183,
105074, doi:10.1016/j.cmpb.2019.105074.
Simeone O. A brief introduction to machine learning for
engineers // Found. Trends Signal Process., 2018 – Vol.
12, No. 3 – 4 – P. 200 – 431.
Sung, H.; Ferlay, J.; Siegel, R.L.; Laversanne, M.;
Soerjomataram, I.; Jemal, A.; Bray, F. Global cancer
statistics 2020: GLOBOCAN estimates of incidence
and mortality worldwide for 36 cancers in 185
countries. CA Cancer J. Clin. 2021, 71, 209–249,
doi:10.3322/caac.21660.
Sanjeev K., Mahesh Ch. Detection of Microcalcification
Using the Wavelet Based Adaptive Sigmoid Function
and Neural Network. Journal of Information Processing
Systems, vol. 13, no. 4, pp. 703–715, Aug. 2017.
https://doi.org/10.3745/JIPS.01.0007
Visual Lab DMR database. Available online
http://visual.ic.uff.br/dmi/
World Cancer Report 2014; World Health Organization:
Geneva, Switzerland, 2014; Chapter 5.2, ISBN 978-92-
832-0429-9.
World Health Organization. Breast Cancer: Prevention and
Control; World Health Organization, Geneva 2019.
Yamashita R., Nishio M., Do R. K. G., Togashi K.
Convolutional neural networks: An overview and
application in radiology // Insights Imag., 2018 – Vol.
9, No. 4 – P. 611 – 629.
Zeng, J.; Lin, L.; Deng, F. Infrared thermal imaging as a
nonradiation method for detecting thermal expression
characteristics in normal female breasts in China.
Infrared Phys. Technol. 2020, 104, 103125,
doi:10.1016/j.infrared.2019.103125.
Zarikas, V., Papageorgiou, E., Regner, P. Bayesian network
construction using a fuzzy rule based approach for
medical decision support (2015) Expert Systems, 32
(3), pp. 344-369.
Zholdasbayeva M., Zarikas, V., Poulopoulos, S. Bayesian
networks based policy making in the renewable energy
sector (2020) ICAART 2020 - Proceedings of the 12th
International Conference on Agents and Artificial
Intelligence, 2, pp. 453-462.
ICAART 2022 - 14th International Conference on Agents and Artificial Intelligence
604
