
Who Watches the Watchers: A Multi-Task Benchmark for Anomaly
Detection
∗
Phil Demetriou
a
, Ingolf Becker
b
and Stephen Hailes
c
University College London, Gower Street, London, U.K.
Keywords:
Anomaly Detection, Benchmark, Performance Metrics, Datasets, Reproducibility.
Abstract:
A driver in the rise of IoT systems has been the relative ease with which it is possible to create specialized-but-
adaptable deployments from cost-effective components. Such components tend to be relatively unreliable and
resource poor, but are increasingly widely connected. As a result, IoT systems are subject both to component
failures and to the attacks that are an inevitable consequence of wide-area connectivity. Anomaly detection
systems are therefore a cornerstone of effective operation; however, in the literature, there is no established
common basis for the evaluation of anomaly detection systems for these environments. No common set of
benchmarks or metrics exists and authors typically provide results for just one scenario. This is profoundly
unhelpful to designers of IoT systems, who need to make a choice about anomaly detection that takes into
account both ease of deployment and likely detection performance in their context.
To address this problem, we introduce Aftershock, a multi-task benchmark. We adapt and standardize an array
of datasets from the public literature into anomaly detection-specific benchmarks. We then proceed to apply a
diverse set of existing anomaly detection algorithms to our datasets, producing a set of performance baselines
for future comparisons. Results are reported via a dedicated online platform located at https://aftershock.
dev, allowing system designers to evaluate the general applicability and practical utility of various anomaly
detection models. This approach of public evaluation against common criteria is inspired by the immensely
useful community resources found in areas such as natural language processing, recommender systems, and
reinforcement learning.
We collect, adapt, and make available 10 anomaly detection tasks which we use to evaluate 6 state-of-the-art
solutions as well as common baselines. We offer researchers a submission system to evaluate future solutions
in a transparent manner and we are actively engaging with academic and industry partners to expand the set of
available tasks. Moreover, we are exploring options to add hardware-in-the-loop.
As a community contribution, we invite researchers to train their own models (or those reported by others) on
the public development datasets available on the online platform, submitting them for independent evaluation
and reporting results against others.
1 INTRODUCTION
Anomaly Detection, or the ability to recognize and
distinguish deviations from expected behavior in data,
is a last line of defense for the identification of intru-
sions, faults, and other undesirable events in deployed
systems. Although widely applicable, this technology
a
https://orcid.org/0000-0002-5707-468X
b
https://orcid.org/0000-0002-3963-4743
c
https://orcid.org/0000-0001-7375-3642
∗
This project was funded by the UK EPSRC grant
EP/S022503/1 that supports the Center for Doctoral Train-
ing in Cybersecurity delivered by the UCL Departments of
Computer Science, Security and Crime Science, and Sci-
ence, Technology, Engineering and Public Policy.
is especially useful in the context of systems that are
key targets but that lack comprehensive security de-
sign: for example, critical cyber-physical systems to
which internet connectivity has later been added.
Cyber-physical systems are difficult to secure but
nevertheless have strong availability requirements.
Advanced Persistent Threats (APTs) who attack and
compromise cyber-physical systems have become
more common and more sophisticated. As a result,
research in the applications of anomaly detection to
cyber-physical systems is becoming both timely and
necessary. However, anomaly detection is a chal-
lenging task in the absence of tailored information
about the data in question and the mechanisms used
Demetriou, P., Becker, I. and Hailes, S.
Who Watches the Watchers: A Multi-Task Benchmark for Anomaly Detection.
DOI: 10.5220/0010915000003120
In Proceedings of the 8th International Conference on Information Systems Security and Privacy (ICISSP 2022), pages 579-586
ISBN: 978-989-758-553-1; ISSN: 2184-4356
Copyright
c
2022 by SCITEPRESS – Science and Technology Publications, Lda. All rights reserved
579

to produce it. Partly as a result, comparisons between
anomaly detection systems across a broad range of
deployment scenarios are almost entirely missing.
Aftershock reduces the difficulty of establishing
like-for-like comparisons between methods in this
space and ensures reproducible results. Simultane-
ously, Aftershock enforces practices that avert mis-
takes and errors that could yield inaccurate perfor-
mance metrics (for example the unintended mixing of
development and test data) through a strict separation
between model authors and evaluators.
In Section 2 we discuss the task of Anomaly De-
tection, its various interpretations, and prior work in
this space. We proceed to introduce Aftershock in
Section 3, discussing its requirements, the current
tasks, baseline models, and our submission model.
We follow this with a discussion of the performance
of the baselines (Section 4), and discuss the impli-
cations, opportunities for improvements, and future
work in Section 5 prior to our concluding remarks
(Section 6).
2 BACKGROUND
Taxonomies of anomaly detection techniques typi-
cally draw a distinction between knowledge-based
and behavior-based systems. The former identify spe-
cific patterns of misbehavior while the latter identify
out-of-the-ordinary runtime features (Mitchell and
Chen, 2014).
While knowledge-based systems are common-
place in practice, such methods are tailored for spe-
cific tasks and domains. Given that one of the core
goals of this project is to encourage the develop-
ment of generalisable anomaly detection methods,
we exclusively consider behavior-based approaches.
Within this subgroup, we identify three prevalent for-
mulations of anomaly detection, in which the primary
difference is the quality and quantity of contextual in-
formation to which a model has access: unsupervised,
supervised, and semi-supervised. We further distin-
guish between temporal and non-temporal anomaly
detection. In the former, observations may be influ-
enced by preceding observations whereas, in the lat-
ter, observations are independent of each other.
Unsupervised anomaly detection involves a model
that observes a stream of data and predicts the emer-
gence of anomalies with no prior context; that is,
without any knowledge of the underlying process or
system prior to deployment. The model is expected to
learn the characteristics of the underlying process dy-
namically, with the expectation that, with the passage
of time, the model will become increasingly robust.
While this is the approached used in the only other
known anomaly detection benchmark at the time of
this writing, namely the Numenta Anomaly Bench-
mark (NAB) (Ahmad et al., 2017), the core limita-
tion of unsupervised anomaly detection lies in the po-
tential for model misprediction and corruption shortly
after deployment when anomalous events may be on-
going. If an unsupervised model is initialized under
anomalous conditions, it will interpret these condi-
tions as its baseline of normality. This mode of op-
eration may also be more limiting than necessary un-
der real-world circumstances in which normal obser-
vations are abundant. Not leveraging this data renders
the already complex training of models more difficult.
Supervised anomaly detection involves a model
that is pre-trained on labeled (anomalous/non-
anomalous) observations prior to deployment. In con-
trast to unsupervised anomaly detection, a supervised
anomaly detection model is aware of the types of
anomalies that may arise and trains a decision func-
tion to detect them. Notably, supervised anomaly
detection techniques are trained only to detect types
of anomalies observed during training and, therefore,
will struggle to detect novel events that are unlike
those captured within the provided training corpus.
Semi-supervised anomaly detection can be
thought of as a compromise between unsupervised
anomaly detection and supervised anomaly detection.
A semi-supervised model is pre-trained on observa-
tions from the underlying system or process, but these
observations need only be normal; there may be a
total absence of anomalies. Semi-supervised models
are thus expected to learn to distinguish between
normal and abnormal observations on the basis of a
notion of normality derived from the training data,
without classifying discrete types of anomalies.
Semi-supervised anomaly detection is vulnerable to
corruption of its training dataset, which is expected
to consist of only normal observations, akin to the
issue identified in unsupervised anomaly detection.
3 AFTERSHOCK: A
BENCHMARK FOR ANOMALY
DETECTION MODELS
Given that there is usually an abundance of normal
data, semi-supervised anomaly detection is a strong
contender as the most realistic candidate for practi-
cal applications. While Aftershock is primarily tai-
lored to this type of technique, it supports unsuper-
vised algorithms without limitation since such mod-
els may be converted to semi-supervised models as
ICISSP 2022 - 8th International Conference on Information Systems Security and Privacy
580
discussed later in this section. The purpose of After-
shock is to enable like-for-like comparisons between
anomaly detection techniques and, in doing so, spur
the development of new techniques that exhibit excel-
lent cross-task generality and practical utility.
While we evaluate a number of “off-the-shelf”
anomaly detection models to establish comparative
baselines, academics and industry practitioners may
themselves contribute anomaly detection models to
Aftershock for evaluation against a representative set
of challenges. To that end, we have established a pro-
cess to facilitate the submission of models based on
virtually any technology, using containerization.
Aftershock features a diverse array of datasets
specifically adapted for anomaly detection tasks.
Each dataset is divided into a publicly accessible
development dataset and a privately accessible test
dataset. By “privately accessible”, we mean that the
test dataset is only accessible to models after sub-
mission to Aftershock. To that end, model execution
occurs on dedicated air-gapped evaluation infrastruc-
ture, thereby avoiding mistakes such as the accidental
mixture of development and test data.
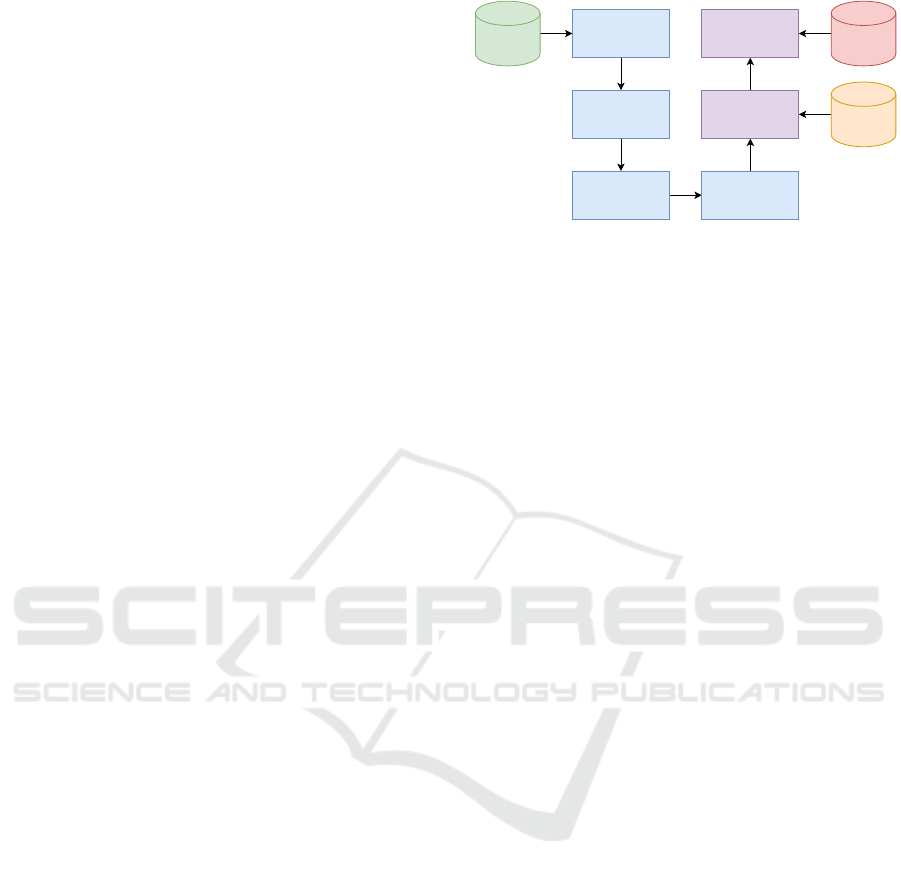
The suggested workflow, as illustrated in Figure 1,
is for contributors to use the publicly available de-
velopment dataset to fit their model on a per-task ba-
sis, extract the requisite inference routines, and pack-
age them into standardized container images. On ini-
tialization, these containers are expected to read the
test dataset from the local filesystem and produce
an anomaly prediction in [0,1] for each observation,
with 0/1 representing absolute confidence of normal-
ity/abnormality.
Once submitted, container images are transferred
to the Aftershock evaluation infrastructure and are run
until completion or exhaustion of the resources provi-
sioned. When model predictions are finally produced,
Aftershock will compare them to ground truth labels
and produce a series of performance metrics that are
published on the online platform.
Aftershock does not place any constraints on
model architecture beyond the ability to process ob-
servations via standard file-based I/O and to make
corresponding predictions as to their normality or ab-
normality. Unsupervised models can be adapted to
semi-supervised models by ingesting the provided de-
velopment datasets to inform their state prior to sub-
mission.
To ease the contribution of models encumbered by
confidentiality or intellectual property concerns, we
allow authors to keep the training mechanism of their
contribution secret and absent from submitted con-
tainer images. To the same end, we allow authors to
request the deletion of all executable components as-
Model Training
Development
Dataset
Extraction of
Inference Routines
Creation of Open
Container Image
Submission
Evaluation
Test
Dataset
Production of Metrics
Ground
Truth
Figure 1: Model contribution process diagram. Green, yel-
low, and red items represent publicly accessible, privately
accessible, and secret data respectively. Blue actions are
taken by the contributor whereas purple actions are taken
by the Aftershock maintainers.
sociated with their contribution immediately follow-
ing evaluation.
3.1 Datasets
Aftershock features ten anomaly detection tasks,
which cover a broad range of feature counts, data
quantities and difficulties, as shown in Tables 1 and
2. As Aftershock aims to reward cross-task general-
ity, we designed the benchmark such that achieving
good performance requires a model to perform well
across as many tasks as possible. We describe these
tasks below and discuss our evaluation mechanism in
Section 4.
All tasks made initially available on the platform
are derived from existing publicly accessible sources,
namely simulators or raw data, that have undergone
random but consistent geometric transformations to
inhibit the use of models trained on the publicly avail-
able sources. To prevent side-channel attacks, Af-
tershock does not expose inter-networking facilities
to the containers during evaluation. Nevertheless, as
many of the evaluation datasets are ultimately directly
derived from publicly available counterparts, there
exists some risk of inference that cannot be elimi-
nated. We hope to include additional proprietary tasks
in the future to partially address this concern.
Where development and test datasets are indi-
cated in the original source, these datasets are pre-
served. Where no such distinction is made, develop-
ment datasets are produced by extracting a uniformly
random 50% subset of normal observations without
substitution. The remaining data, both normal and ab-
normal, represents the private test data.
3.1.1 Cyber-physical Systems
We include four datasets derived from raw data
produced by cyber-physical systems or simulations.
Who Watches the Watchers: A Multi-Task Benchmark for Anomaly Detection
581

Table 1: Task feature counts and quantities of normal and
abnormal data.
Task Features Normal Abnormal
Samples Samples
Cyber-physical Systems
TE Fortran 53 406,400 572,800
TE Matlab 42 878,195 136,769
TE Rieth 23 730,000 14,600,000
SWaT 2015 52 890,298 54,621
Computer Networks
CIC-IDS-2017 78 2,273,097 557,646
KDD (HTTP) 38 309,523 313,568
KDD (SMTP) 38 47,685 48,869
Cross-domain
Shuttle 9 68,216 5,288
CoverType 10 283,301 2,747
Mammography 6 10,923 260
Table 2: Task feature counts and quantities of development
and testing data.
Task Features Dev Test
Samples Samples
Cyber-physical Systems
TE Fortran 53 201,600 777,600
TE Matlab 42 434,750 580,214
TE Rieth 23 250,000 15,080,000
SWaT 2015 52 495,000 449,919
Computer Networks
CIC-IDS-2017 78 529,918 2,300,825
KDD (HTTP) 38 309,523 313,568
KDD (SMTP) 38 47,685 48,869
Cross-domain
Shuttle 9 34,108 39,396
CoverType 10 141,650 144,398
Mammography 6 5,461 5,722
These include three datasets derived from variants
of the Tennessee-Eastman (TE) industrial process,
namely its (original) Fortran (Downs and Vogel,
1993) implementation, revised Matlab (Bathelt et al.,
2015) implementation and raw data published by Ri-
eth et al. (Rieth et al., 2017). We also include a dataset
derived from the SWaT project
1
.
Tennessee-Eastman is a realistic process simula-
tion of a chemical plant that has been widely used as a
benchmark for control and monitoring research. The
simulators found in the Tennessee-Eastman source
code distributions can produce 20 or 28 types of dif-
1
The SWaT dataset is available at https://itrust.sutd.edu.
sg/testbeds/secure-water-treatment-swat/.
ferent process faults under the Fortran and revised
Matlab implementations respectively. These faults
occur due to various disturbances; some faults almost
instantaneously place the process in a critical state
while others (notably disturbances 3, 9, and 15 in
the Fortran implementation) produce statistically in-
significant deviations (Lee et al., 2006; Detroja et al.,
2006).
SWaT is a water treatment dataset that was de-
signed to accelerate cybersecurity research in the con-
text of cyber-physical systems. The process begins
by taking in raw water, adding necessary chemicals
to it, filtering it via an Ultrafiltration (UF) system,
de-chlorinating it using UV lamps, and then feeding
it to a Reverse Osmosis (RO) system. A backwash
process cleans the membranes in UF using the water
produced by RO. The cyber portion of SWaT consists
of a layered communications network, Programmable
Logic Controllers (PLCs), Human Machine Interfaces
(HMIs), Supervisory Control and Data Acquisition
(SCADA) workstation, and a Historian. Data from
sensors is available to the SCADA system and is
recorded by the Historian for subsequent analysis.
3.1.2 Computer Networks
We include three datasets derived from network
traffic analysis in networks exhibiting anomalous
activity. Namely, we include the CIC-IDS-2017
dataset (Sharafaldin et al., 2018) and two instances
of the legacy KDD Cup 1999 dataset
2
which is pre-
served to facilitate historical comparisons.
The CIC-IDS-2017 dataset is a recent dataset de-
rived from real-world network traffic that includes
normal traffic and traffic from periods when the net-
work was under various forms of attack. Over a five-
day capture period, the network simulated had under-
gone brute force FTP, brute force SSH, denial of ser-
vice (DoS), heartbleed, web, and other attacks.
The KDD Cup 1999 dataset is a popular intrusion
detection dataset that includes traffic metrics arising
from a wide variety of intrusions simulated in a mil-
itary network environment. Two derivatives of the
KDD Cup 1999 dataset are constructed from http and
SMTP observations independently. While the origi-
nal dataset contains 41 input features, the tasks herein
group observations by layer 7 protocol and strip three
related features: “protocol type”, “service” and “flag”
to produce http and SMTP tasks with 38 features.
2
The KDD Cup 1999 dataset is available at http://kdd.
ics.uci.edu/databases/kddcup99/kddcup99.html.
ICISSP 2022 - 8th International Conference on Information Systems Security and Privacy
582

3.1.3 Cross-domain
We include three unrelated anomaly detection
datasets that were selected to provide indications of
cross-task generality.
The Mammography dataset available from
openML
3
is a medical anomaly detection dataset,
originally published by Aleksandar Lazarevic (Woods
et al., 1994), that consists of 11,183 observations
with 6 input features, including 260 anomalies
representing mammary calcifications that may be
indicators of invasive cancer. Mammography is an
example of a highly unbalanced dataset, that made it
an appropriate, but intentionally different Aftershock
task. All of the features included in the original
dataset are carried forward into Aftershock.
The Shuttle (also known as Statlog) dataset
4
from
the UCI machine learning repository (Dua and Graff,
2017) was originally intended as a multi-class clas-
sification dataset consisting of 58,000 observations
with 9 input features. Shuttle has been adapted to an
anomaly detection task for Aftershock by designating
one class as the normal class, stripping observations
from a certain other class, and treating the remaining
classes as anomalies, as described by the Outlier De-
tection Datasets project
5
.
The CoverType
6
(also known as ForestCover)
dataset from UCI machine learning repository (Dua
and Graff, 2017) was intended to be a multi-class clas-
sification dataset used for predicting forest cover type
from cartographic variables. The relevant study area
includes four wilderness areas located in the Roo-
sevelt National Forest of northern Colorado in the
United States. These areas represent forests with min-
imal human-caused disturbances, so that existing for-
est cover types are a result of ecological processes
rather than forest management practices. Cover-
Type consists of 581,012 observations with 54 input
features (10 quantitative features, 4 binary wilder-
ness area features, and 40 binary soil type features)
whereas the derivative anomaly detection task avail-
able on Aftershock only includes the 10 quantitative
features. For the purposes of anomaly detection, ob-
servations from one class represent normal data and
those from another represent anomalies; observations
not associated with the foregoing two classes are ig-
3
The Mammography dataset is available at https://
www.openml.org/d/310.
4
The Shuttle dataset is available at https://archive.ics.
uci.edu/ml/datasets/Statlog+(Shuttle).
5
The Outlier Detection Datasets are available at http:
//odds.cs.stonybrook.edu/.
6
The ForestCover dataset available is at https://archive.
ics.uci.edu/ml/datasets/covertype.
nored, as described by the Outlier Detection Datasets
project
5
.
3.2 Baseline Models
To set an initial comparative menu for this project, we
have chosen a variety of anomaly detection models
from the Scikit-learn project (Pedregosa et al., 2011)
to act as baselines in our initial experiments. These
algorithms are a representative sample of anomaly de-
tection algorithms that are currently available “off-
the-shelf”.
Due to the popularity of the Scikit-learn project,
we anticipate that these algorithms are key tools for
data science practitioners more broadly. The imple-
mentations of these algorithms together with training
and submission scripts for Aftershock can be found
on the project website and should serve as a starting
point for future submission.
Isolation Forest: (Liu et al., 2012) is an ensemble
method that performs semi-supervised anomaly de-
tection by isolating observations from each other such
that anomalies are isolated more quickly than normal
observations. Unlike previous methods, Isolation For-
est has linear training and inference complexity rel-
ative to the size of the respective datasets, and can
operate in high-dimensional settings with or without
redundant features.
One-Class Support Vector Machines: (Sch
¨
olkopf
et al., 2001) represent a class of algorithms that per-
form semi-supervised anomaly detection by mapping
training data onto a feature space by means of a ker-
nel function that maximizes the margin of the mapped
data to the origin. Anomalies can then be distin-
guished by their embedded distance from the ori-
gin. Although one-class support vector machines
have demonstrated superior performance at the time
of their discovery, their runtime complexity scales
quadratically with the size of the training data, ren-
dering them of limited practical usefulness.
Minimum Covariance Determinant: is an algo-
rithm that performs semi-supervised anomaly de-
tection by leveraging FAST-MCD (Rousseeuw and
Driessen, 1999) to identify a subset of the training
data whose covariance matrix has the lowest discrim-
inant. Once this subset has been identified, its covari-
ance matrix can be used to derive an elliptic envelope
of the region of normality and identify any outliers as
anomalies.
Local Outlier Factor: (Breunig et al., 2000) is an al-
gorithm for semi-supervised anomaly detection that
is closely related to the K-nearest neighbors algo-
rithm (Cover and Hart, 1967) and leverages the dif-
ference in density between neighboring observations
Who Watches the Watchers: A Multi-Task Benchmark for Anomaly Detection
583

as a proxy for abnormality; that is, observations with
substantially lower density than their nearest neigh-
bors are seen as anomalous.
Beyond these baselines, we include two additional
anomaly detection algorithms.
MStream: (Bhatia et al., 2021) is a recent tech-
nique that performs multivariate streaming anomaly
detection in constant time and memory by combining
locality-sensitive hashing with a Count-Min-Sketch
construction.
Bionic: (Demetriou et al., 2022) is an anomaly de-
tection method developed by the authors. Bionic is a
semi-supervised anomaly detection system that com-
bines Neural Networks with robust gradient-free op-
timization techniques to produce novel, task-specific
model architectures for anomaly detection tasks.
3.3 Submission and Model Evaluation
Aftershock allows researchers to contribute anomaly
detection models for inclusion in the project’s model
directory and task-specific and global leaderboards.
We have developed a Contributor License Agreement
that allows the contributor to retain their ownership
in the work submitted while granting Aftershock the
necessary legal rights to use that contribution to per-
form model evaluation and publish the resulting met-
rics on the foregoing leaderboards.
To facilitate the consistent and reliable evaluation
of potentially very different models operating under
potentially vastly different execution environments,
Aftershock leverages containerization to operate con-
tributed models, which must take the form of Open
Container Images
7
and include at least inference sub-
routines, compiled or otherwise.
Container images must satisfy a data interchange
contract, described on a per-task basis on the After-
shock website. For all existing tasks, this interchange
involves the reading of observations and writing of
predictions to and from CSV or HDF5 files found un-
der file-system paths known a priori, as per the speci-
fications of various tasks. Where deviations from this
pattern are necessary, these will be noted under the
specification of the relevant task. Upon completion,
several indicative performance metrics are computed
per completed task:
Area Under Curve: The area under the receiver op-
erating characteristic (ROC) curve is an indicator of
the performance of a binary classification model com-
7
The Open Container Image format was developed as
part of The Open Container Initiative: a Linux Foundation
project to design open standards for operating-system-level
virtualization.
puted via the aggregation of performance metrics un-
der various discrimination thresholds.
Inference Runtime: The amount of time required to
compute model predictions as to the normality or ab-
normality of observations in the test datasets of var-
ious tasks is an indication of the practical usefulness
of a model and of the computational considerations
involved in a hypothetical deployment. The change in
runtime with a varying number of features (i.e. across
task) yields a measure of performance scaling with
respect to task dimensionality.
Further to the per-task metrics described, the per-
model geometric mean of each of the foregoing met-
rics is computed across all attempted tasks, yielding
an approximate measure of general performance. As
contributors may choose to have their models eval-
uated in only a subset of tasks, we also note the per-
centage of tasks attempted relative to the total number
of tasks available.
To prevent service degradation arising from faults
or abuse, we apply a number of restrictions and re-
source constraints when executing submitted con-
tainer images, which contain arbitrary code. Namely,
containers are limited to 4 CPU cores and 4GB of
system memory, with some more intricate but reason-
able I/O and syscall restrictions. Containers are also
limited to a runtime of 24 aggregate core hours. In
the event that a container exceeds these limitations,
execution ceases and the submission will remain un-
ranked. We ensure consistency in these limits and the
general availability of resources by executing submis-
sions serially on dedicated infrastructure.
4 EXPERIMENTS
To better understand the challenge posed by the in-
cluded tasks, we conduct experiments with “off-the-
shelf” anomaly detection models from the Scikit-
learn project to establish global and task-specific
baselines. For the purpose of these experiments, the
relevant models are fitted using the publicly avail-
able development dataset for each task and, thereafter,
evaluated using the standard containerized mecha-
nism previously discussed. All model parameters are
fixed to their default values as of Scikit-learn version
0.23.0, which were deemed to be reasonable for gen-
eral applications.
In Table 3, we summarize the AUC scores
achieved by the tested models in every attempted
and fully completed task. The MStream algorithm
has only been evaluated on temporal tasks that can
support streaming anomaly detection; the remaining
tasks are incompatible with this algorithm. The miss-
ICISSP 2022 - 8th International Conference on Information Systems Security and Privacy
584

ing values for One-class SVM are due to runtimes ex-
ceeding 24 core hours, at which point the evaluation
process times out. In Table 4 we similarly summa-
rize the inference runtime for each model-task pair in
milliseconds per record.
Table 3: AUC Scores of Model Baselines.
Task Bionic MS IF SVM MCD LOF
Cyber-physical Systems
TE Fortran 0.759 0.520 0.637 0.615 0.752 0.664
TE Matlab 0.829 0.676 0.704 0.675 0.665 0.772
TE Rieth 0.898 0.898 0.740 0.668 0.855 0.702
SWaT 2015 0.854 0.708 0.834 0.510 0.784 0.510
Computer Networks
CIC-IDS-2017 0.802 0.291 0.717 0.702 0.595 0.797
KDD (HTTP) 0.999 – 0.939 0.752 0.950 0.940
KDD (SMTP) 1.000 – 0.999 0.780 0.949 0.963
Cross-domain
Shuttle 0.996 – 0.997 0.778 0.953 0.999
CoverType 0.994 – 0.898 0.732 0.701 0.999
Mammography 0.890 – 0.883 0.794 0.726 0.868
Geometric Mean 0.898 0.579 0.826 0.695 0.784 0.805
Attempted Tasks 100% 50% 100% 100% 100% 100%
Table 4: Inference Runtimes of Model Baselines
(ms/record).
Task Bionic MS IF SVM MCD LOF
Cyber-physical Systems
TE Fortran 0.155 0.000 0.088 5.285 0.002 0.171
TE Matlab 0.128 0.000 0.079 8.256 0.001 0.214
TE Rieth 0.133 0.000 0.086 9.083 0.002 0.263
SWaT 2015 0.140 0.000 0.085 11.014 0.002 0.020
Computer Networks
CIC-IDS-2017 0.160 0.000 0.113 33.657 0.004 0.256
KDD (HTTP) 0.094 – 0.078 6.863 0.001 0.085
KDD (SMTP) 0.092 – 0.069 0.767 0.001 0.087
Cross-domain
Shuttle 0.061 – 0.038 0.225 0.000 0.032
CoverType 0.073 – 0.047 1.011 0.000 0.012
Mammography 0.054 – 0.020 0.034 0.000 0.008
Geometric Mean 0.102 0.000 0.064 2.386 0.001 0.064
Attempted Tasks 100% 50% 100% 100% 100% 100%
5 DISCUSSION
We have chosen a set of “off-the-shelf” anomaly de-
tection models from the Scikit-learn project to estab-
lish task-specific and global baselines in a series of
experiments. The results of these experiments sug-
gest that some anomaly detection tasks are consis-
tently easier than others, regardless of the applied
model. Performance on temporal tasks is generally
lower than for non-temporal tasks, which suggests a
need for more sophisticated temporal anomaly detec-
tion techniques.
Our results suggest that inference runtimes are not
necessarily associated with better or worse perfor-
mance and, with the exception of One-class SVMs,
display low variance across tasks which is correlated
with task dimensionality. The existing implementa-
tion of One-class SVMs in Scikit-learn appears to ex-
hibit both asymptotically quadratic fitting and infer-
ence runtimes relative to the number of samples pro-
cessed.
We observe that all models demonstrate bet-
ter than random performance on all tasks, but that
MStream exhibits a higher variance in AUC score
across tasks. We note that some Tennessee-Eastman
disturbances under all variants are not accurately de-
tected by any existing algorithm. Thus, even in the
context of this benchmark, anomaly detection cannot
be said to be a sufficiently solved problem, imply-
ing a need for more powerful models. It is unclear
whether this reflects a limitation in the existing al-
gorithms’ ability to capture temporal characteristics
in general, or a result of the fact that some distur-
bances cause only subtle effects that can be masked
by noise. We anticipate that the future integration of
other large-scale temporal tasks may clarify this.
6 CONCLUSION
In conclusion, we have presented Aftershock, a chal-
lenging, diverse, and scalable platform that rewards
the accurate detection of anomalies across a set of di-
verse tasks. Our objective in creating Aftershock is to
encourage the development of new general-purpose,
practically useful anomaly detection models and to al-
low the principal comparison of their performance.
In the course of developing Aftershock, we dis-
covered the general lack of datasets and simulations
designed specifically to assess the performance and
robustness of anomaly detection algorithms. Datasets
and tasks that are specifically crafted to challenge
anomaly detection models could be the basis of more
accurate comparisons between methods.
For the datasets that we could reasonably adapt
to an anomaly detection modality, non-temporal tasks
are effectively solved by some methods whereas tem-
poral tasks remain relatively challenging. This obser-
vation calls for a stronger research focus on temporal
anomaly detection methods.
We are actively engaging with academic and in-
dustry partners to expand the available tasks and are
exploring options to add hardware-in-the-loop with
real testbeds and to support fully private datasets
where models are both trained and evaluated on Af-
tershock infrastructure. This will allow us to offer
testing on commercially sensitive datasets that may
be difficult to anonymize.
Who Watches the Watchers: A Multi-Task Benchmark for Anomaly Detection
585

REFERENCES
Ahmad, S., Lavin, A., Purdy, S., and Agha, Z. (2017). Un-
supervised real-time anomaly detection for streaming
data. Neurocomputing, 262:134–147.
Bathelt, A., Ricker, N. L., and Jelali, M. (2015). Revi-
sion of the tennessee eastman process model. IFAC-
PapersOnLine, 48(8):309–314.
Bhatia, S., Jain, A., Li, P., Kumar, R., and Hooi, B. (2021).
Fast anomaly detection in multi-aspect streams. In
The Web Conference (WWW).
Breunig, M. M., Kriegel, H.-P., Ng, R. T., and Sander, J.
(2000). Lof: identifying density-based local outliers.
In Proceedings of the 2000 ACM SIGMOD interna-
tional conference on Management of data, pages 93–
104.
Cover, T. and Hart, P. (1967). Nearest neighbor pattern clas-
sification. IEEE transactions on information theory,
13(1):21–27.
Demetriou, P., Becker, I., and Hailes, S. (2022). High-
performance accessible anomaly detection for critical
systems. under review.
Detroja, K., Gudi, R., and Patwardhan, S. (2006). A
possibilistic clustering approach to novel fault de-
tection and isolation. Journal of Process Control,
16(10):1055–1073.
Downs, J. J. and Vogel, E. F. (1993). A plant-wide indus-
trial process control problem. Computers & chemical
engineering, 17(3):245–255.
Dua, D. and Graff, C. (2017). UCI machine learning repos-
itory.
Lee, J.-M., Qin, S. J., and Lee, I.-B. (2006). Fault detection
and diagnosis based on modified independent compo-
nent analysis. AIChE journal, 52(10):3501–3514.
Liu, F. T., Ting, K. M., and Zhou, Z.-H. (2012). Isolation-
based anomaly detection. ACM Transactions on
Knowledge Discovery from Data (TKDD), 6(1):1–39.
Mitchell, R. and Chen, I.-R. (2014). A survey of intrusion
detection techniques for cyber-physical systems. ACM
Computing Surveys (CSUR), 46(4):1–29.
Pedregosa, F., Varoquaux, G., Gramfort, A., Michel, V.,
Thirion, B., Grisel, O., Blondel, M., Prettenhofer,
P., Weiss, R., Dubourg, V., Vanderplas, J., Passos,
A., Cournapeau, D., Brucher, M., Perrot, M., and
Duchesnay, E. (2011). Scikit-learn: Machine learning
in Python. Journal of Machine Learning Research,
12:2825–2830.
Rieth, C., Amsel, B., Tran, R., and Cook, M. (2017). Addi-
tional tennessee eastman process simulation data for
anomaly detection evaluation. Harvard Dataverse, 1.
Rousseeuw, P. J. and Driessen, K. V. (1999). A fast algo-
rithm for the minimum covariance determinant esti-
mator. Technometrics, 41(3):212–223.
Sch
¨
olkopf, B., Platt, J. C., Shawe-Taylor, J., Smola, A. J.,
and Williamson, R. C. (2001). Estimating the support
of a high-dimensional distribution. Neural computa-
tion, 13(7):1443–1471.
Sharafaldin, I., Lashkari, A. H., and Ghorbani, A. A.
(2018). Toward generating a new intrusion detection
dataset and intrusion traffic characterization. ICISSp,
1:108–116.
Woods, K. S., Solka, J. L., Priebe, C. E., Kegelmeyer Jr,
W. P., Doss, C. C., and Bowyer, K. W. (1994). Com-
parative evaluation of pattern recognition techniques
for detection of microcalcifications in mammography.
In State of The Art in Digital Mammographic Image
Analysis, pages 213–231. World Scientific.
ICISSP 2022 - 8th International Conference on Information Systems Security and Privacy
586
