
YOLOv3: Traffic Signs & Lights Detection and Recognition for
Autonomous Driving
Rafael Marques
1
, Tiago Ribeiro
1a
, Gil Lopes
2b
and A. Fernando Ribeiro
1c
1
Department of Industrial Electronics, ALGORITMI CENTER, University of Minho, Guimarães, Portugal
2
Department of Communication Sciences and Information Technologies, University of Maia, Maia, Portugal
Keywords: Supervised Learning, YOLOv3, Traffic Sign Detection, Autonomous Mobile Robot, Robotics, Simulated
Robot, Robocup.
Abstract: Advanced Driver Assistance Systems (ADAS) relates to various in-vehicle systems intended to improve road
traffic safety by assisting drivers with improved road awareness, inherent dangers and other drivers nearby.
Traffic sign detection and recognition is an integral part of ADAS since these provide information about
traffic rules, road conditions, route directions and assistance for safe driving. In addition, traffic sign detection
and recognition are essential research topics for safe and efficient driving when considering intelligent
transportation systems. An approach to traffic sign/light detection and recognition using YOLOv3 and
YOLOv3_tiny is presented in this paper in two different environments. The first is on a simulated and real
autonomous driving robot for RoboCup Portuguese Open Autonomous Driving Competition. The robot must
detect both traffic signs and lights in real-time and behave accordingly. The second environment is on public
roads. A computer vision system inside the car points to the road, detecting and classifying traffic signs/lights
(T S/L) in different weather and lighting conditions. YOLOv3 and YOLOv3_tiny were tested on both
environments with an extensive hyperparameters search. The final result showcases videos of the two
algorithms on the two environments.
1 INTRODUCTION
With the continuous advances in the automobile
industry, automotive vehicles are the leading
transportation method in daily life (Fu & Huang,
2010). Consequently, road traffic safety (Swathi &
Suresh, 2017) is increasingly becoming a more
significant problem around the world. Intelligent
Transportation System is an integrated system that
uses high-level technology for transportation, service
control and vehicle manufacturing. It has the potential
to spare time, money, lives, preserve the environment
and save resources. It consists of diverse subsystems
related to emerging technologies such as smart
sensors, mobile data services, geographic
information, location technology, and artificial
intelligence. Its applications are blind-spot detection,
speed limit recognition, emergency brake assistance,
traffic sign recognition and lane departure warning
a
https://orcid.org/0000-0002-5909-0827
b
https://orcid.org/0000-0002-9475-9020
c
https://orcid.org/0000-0002-6438-1223
(Yu et al., 2019) . Supervised Learning solutions to
traffic sign recognition problems are based on
datasets and a functional classification algorithm to
recognise detected traffic signs and lights and
feedback them to smart cars in real-time. One of the
solutions that yields the best results are Convolutional
Neural Networks (CNNs) (Cao et al., 2019). These
neural networks extract features directly from the
sensory input image and output the results through the
trained classifier based on image features,
demonstrating an improved graphical recognition
performance. Continuously training the network with
input images via forward learning and feedback
mechanisms gradually improves the capability to
detect and classify the previously trained traffic signs
and lights (Rawat & Wang, 2017), This project
consists of a real-time object detection algorithm,
named YOLOv3 which identifies traffic signs and
lights.
818
Marques, R., Ribeiro, T., Lopes, G. and Ribeiro, A.
YOLOv3: Traffic Signs Lights Detection and Recognition for Autonomous Driving.
DOI: 10.5220/0010914100003116
In Proceedings of the 14th International Conference on Agents and Artificial Intelligence (ICAART 2022) - Volume 3, pages 818-826
ISBN: 978-989-758-547-0; ISSN: 2184-433X
Copyright
c
2022 by SCITEPRESS – Science and Technology Publications, Lda. All rights reserved
2 RELATED WORK
A Traffic Sign Recognition software using pre-
processing traditional computer vision methods and a
simplistic neural network for an autonomous
navigation robot is presented in (Moura et al., 2014).
This project aimed to participate in the Portuguese
RoboCup Open Autonomous Driving Competition .
It relied on computer vision software with pictogram
extraction for detection and a feed-forward neural
network for traffic sign classification. In most signs,
100% precision was obtained in both algorithms. The
traffic lights had an accuracy of over 96%, whereas
the traffic signs were between 52% and 88.2%. A
different approach using end-to-end machine learning
solutions for traffic sign recognition systems is
presented in (Qian et al., 2016), where CNNs are used
without pre-processing. Instead of using a CNN as a
feature extractor and a multilayer perception (MLP)
as a classifier, max-pooling positions (MPPs) is
proposed as a practical discriminative feature to
predict category labels.
3 PROBLEM DEFINITION
The first proposed task is part of the autonomous
driving competition held at the RoboCup Portuguese
Open (Sociedade Portuguesa de Robótica, 2019).
This competition simulates some problems that arise
when working on autonomous driving in a controlled
and scaled way. It consists of a track with two lanes
and two curves set so that the cars can continuously
drive around the track. It has vertical traffic signs,
traffic lights, two different parking spaces, and traffic
cones for temporary lanes and obstacles (Figure 2).
For this work, the challenge considered is the
"Vertical traffic signs detection challenge".
Figure 2: Environment of the Autonomous Driving
Competition from the RoboCup Portuguese Open.
The second proposed task is similar to the first
one, considering traffic sign and lights detection and
recognition and only differs in the environment. It is
implemented on a real car driving on public roads.
This system must detect a broader range of traffic
signs, further away from the car with different
weather and light conditions.
4 METHODOLOGIES
To test YOLOv3 and YOLOv3_tiny in both
environments (Autonomous Driving Competition and
Public Roads) it is essential to parameterise the
detection goals. In this chapter, all the information
regarding the two environments is described.
In the RoboCup Portuguese Open autonomous
driving competition, apart from detecting which sign
was identified and its relative location to the robot,
another feature implemented is to have the car adjust
its actions and movement in real-time according to
the traffic signs and lights. The results are shown in
simulation and real-world. The autonomous driving
competition consists of correctly identifying six
traffic lights and twelve traffic signs. In addition, a set
of twelve traffic signs were selected to upgrade the
variety of signs and demonstrate YOLOv3 capability
on more extensive sets of signs. The new signs were
selected given their direct interference with the
robot's movement, whether to stop, turn in a direction
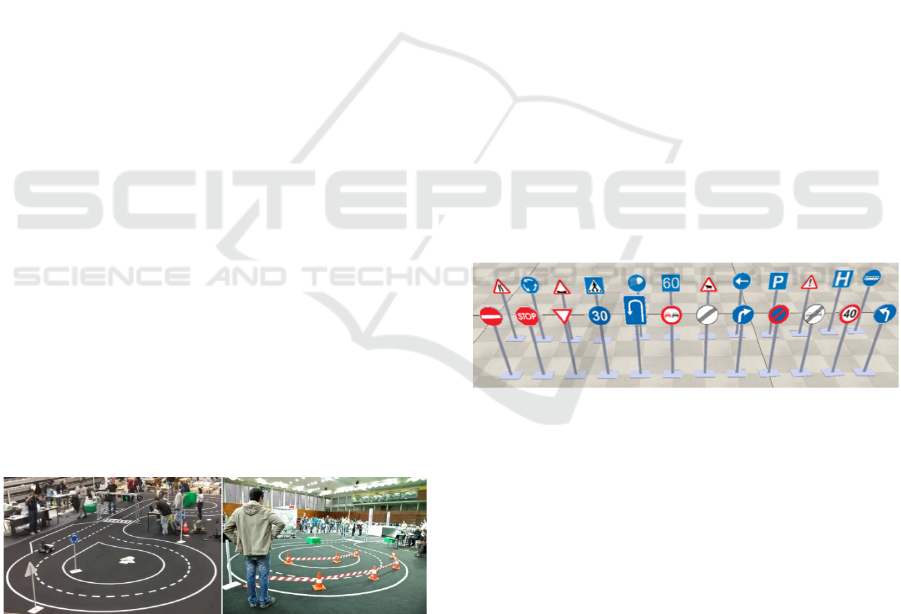
and increase or decrease speed. Figure 3 shows all the
traffic signs created where the top twelve are the ones
on the competition rulebook, and the bottom twelve
are the ones added.
Figure 3: Selected traffic signs for the RoboCup Portuguese
Open Autonomous Driving Competition environment.
The traffic lights on the competition are different
from public roads since these are not the traditional
red, yellow and green lights that inform the user to
move or not. These traffic lights provide additional
information on different actions the robot must take.
They display information forcing the robot to turn
left, right or go forward, park, stop or finish the round.
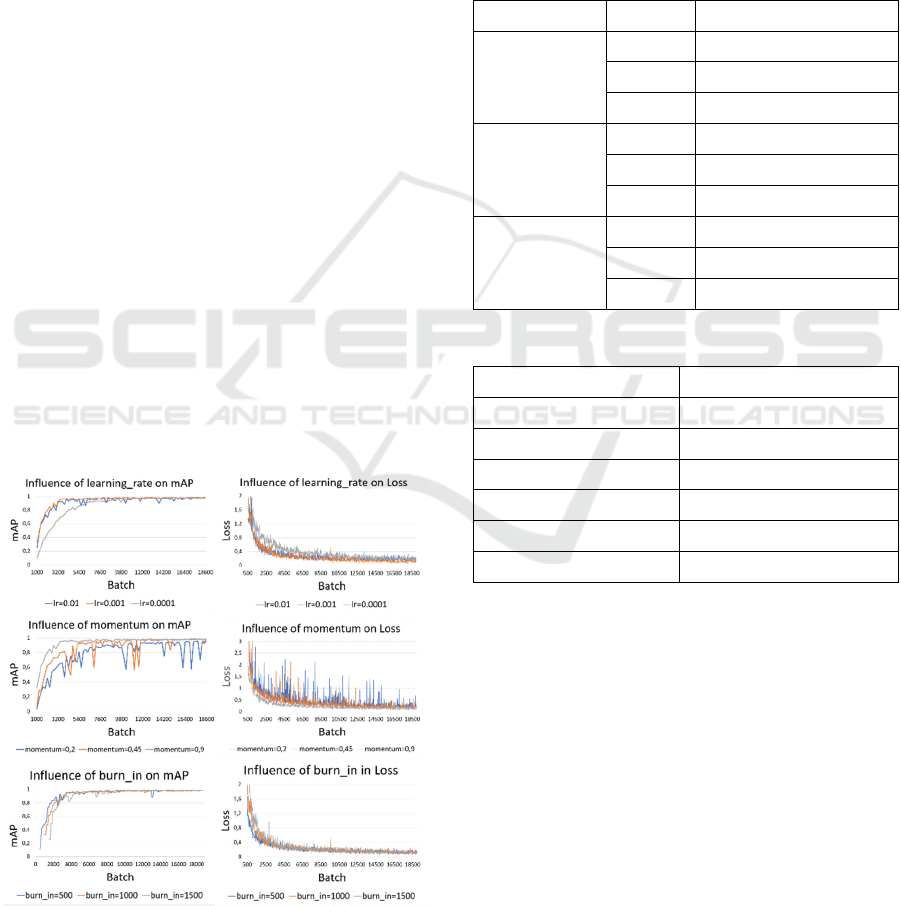
Figure 4, on the left, shows how the traffic light is
placed on the competition track, and on the right side
it shows the six different traffic lights.
To compete in the autonomous driving challenge
a robotic agent must go through the track and
overcome some challenges. The robot agent YOLOv3
was implemented in a car-like four-wheel drive robot
with an RGB camera. The input from the camera is
YOLOv3: Traffic Signs Lights Detection and Recognition for Autonomous Driving
819
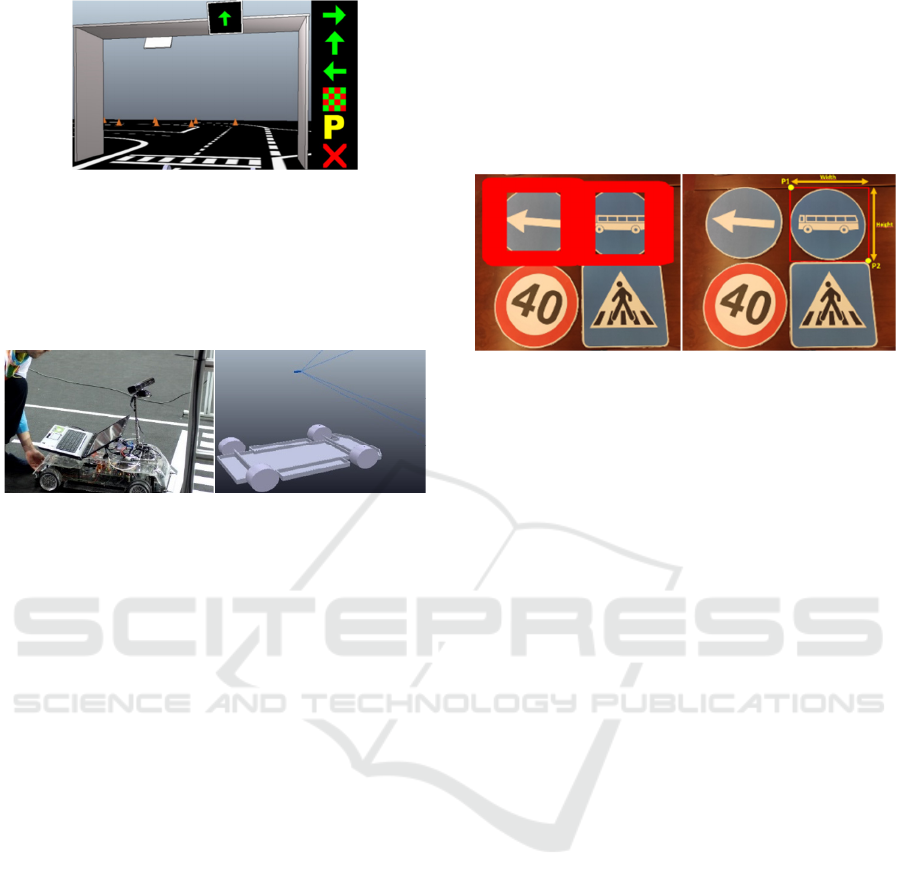
Figure 4: Traffic Lights in the RoboCup Portuguese Open
Autonomous Driving Competition Environment.
used to detect and locate every object on the track,
such as traffic signs and lights, traffic cones and
parking spots. Figure 5 shows the real and simulated
autonomous driving robot.
Figure 5: Real-world and simulation autonomous driving
robot, with its respective sensors and actuators.
The first objective is the development of a
detection and classification algorithm for the real-
world competition. To accomplish the objective,
three phases were used: Acquisition, training and
testing. The same traffic signs and lights are used. The
acquisition phase of the first objective has the goal of
creating a dataset with images from all the traffic
signs and lights in order to train the networks. A
smartphone camera was used to record the videos
with 1080 resolution and 30 fps. The smartphone was
used due to its camera stabilisation and user-friendly
interface and because it would emulate the conditions
in which the network would be tested Only one of
each six frames is selected to avoid using very similar
images. The final video has 9 minutes and 2 seconds
and using this script 5949 images were created.
Regarding the associated text file to the images,
YOLO format is used. For this, most of the labels
were deployed using image processing with a Python
script developed with the OpenCV library. To process
the image the Template Matching function was used.
For each traffic sign and light, a template was
generated. To improve detection, this template must
have a dark background. The background change was
performed using the Windows Paint 3D tool where
the sign was selected, and the remaining background
painted black. The template matching function can be
applied to the generated images and the output is an
array with the finding locations and corresponding
confidences, where only the one with the highest
confidence is considered. In Figure 6, an example is
presented in which the template used was the Public
Transport sign one. The left figure corresponds to all
the detections with confidence scores over 40%. The
image on the right is the detection with the highest
confidence score.
Figure 6: All detections with confidence scores over 40%
(Left). Detection with the highest confidence score (Right).
The figure on the right also contains two added
points used as corners for the Bounding Box with the
corresponding width and height. This data is then
used to create the corresponding file where the labels
are stored for each detection. However, this method
proved to be inefficient in cases where the signs were
distant. In this case, all traffic signs and light were
manually inserted using LabelImg.
After the acquisition phase, the data is ready to be
input to the network for training. For the training
phase, two networks were used, YOLOV3 and
YOLOV3_tiny. The networks were chosen due to
high fps and accuracy. These were deployed using the
Darknet repository, an open-source neural network
framework. Darknet provides a config file for the
hyperparameters of each YOLO. The main purpose of
this objective is to participate in the RoboCup
Portuguese Open Autonomous Driving Competition
which would be the ultimate test for the developed
networks. Unfortunately, due to the COVID-19
pandemic, the competition did not take place. So, the
performance was tested on the laboratory track.
4.1 Public Road
The second objective of this project was to develop a
detection and classification algorithm for public road
traffic sign and lights. As in previous objectives, a
dataset was created with 36 signs and lights. The main
goal of the acquisition phase was to obtain several
images from all signs and lights in different scenarios.
To make the network more robust, it was necessary to
have images from different sites, backgrounds,
angles, distances, weathers, and lighting. Videos of
various trips were recorded from the front passenger
seat in the car and on multiple days at different hours.
ICAART 2022 - 14th International Conference on Agents and Artificial Intelligence
820
The videos were also recorded during night-time to
ensure the network performs correctly all day. The
videos were merged and a final video was created, 27
minutes and 53 seconds long, and using the script
used in the previous objectives, 8372 images were
created. With the final dataset ready, the public road
training was performed for YOLOV3 and
YOLOV3_tiny.
5 TESTS
For each objective, two networks, YOLOV3 and
YOLOV3_tiny were used. The hyperparameters in
each training phase were optimised to obtain the best
performance. The YOLO architecture already
provides some values. In the following figures, the
mAp and loss that outcomes of different
hyperparameter configurations are compared and
analysed. To ease the comparison between the tested
values, a graph is generated for the mAP and another
for the loss. The prototypes were implemented on
Ubuntu 20.04 operating system on an ASUS
Vivobook Pro N580VD with an Intel Core i7 7th Gen
7700HQ CPU and an Nvidia GeForce GTX 1050.
5.1 YOLOv3
In this section, the hyperparameters values are tested
in the YOLOV3 network and the results are
presented. Only the values that provide significant
differences in the graphs are presented in Figure 7.
Figure 7: Tests to determine the most optimized values for
some hyperparameters for YOLOv3.
For some hyperparameters the time the training
lasted can influence the choice of the most optimised
parameter. In Table 1 these values are presented. The
tests were performed in Google Colab Pro using the
provided GPUs. The computational power available
can fluctuate throughout the tests and this can lead to
a slight different training time for two equal trainings.
By analysing the graphs, it can be concluded that the
most optimised hyperparameters for YOLOV3 are as
shown in Table 2.
Table 1: Time the train lasted per parameter.
Hyperparameter Value Time the training lasted
max_batches
9500 8 hours 47 minutes
1900 18 hours 6 minutes
28500 28 hours 19 minutes
burin
500 17 hours 33 minutes
1000 16 hours 9 minutes
1500 16 hours 3 minutes
Width x height
320x320 8 hours 56 minutes
416x416 18 hours 6 minutes
544x544 28 hours 13 minutes
Table 2: Optimised values for YOLOV3.
Hyperparameter Optimised value
max_batches 19000
learning_rate 0.001
momentum 0.9
burn_in 1000
decay 0.0005
width x heigh 416x416
5.2 YOLOV3_tiny
In this section, the hyperparameters values are tested
in the YOLOV3_tiny network and the results will be
presented. Only the values that provide significant
differences are presented, in Figure 8. In Table 3, the
time each train lasted per parameter is presented. The
most optimised hyperparameters for the
YOLOV3_tiny network are as shown in Table 4:
YOLOv3: Traffic Signs Lights Detection and Recognition for Autonomous Driving
821
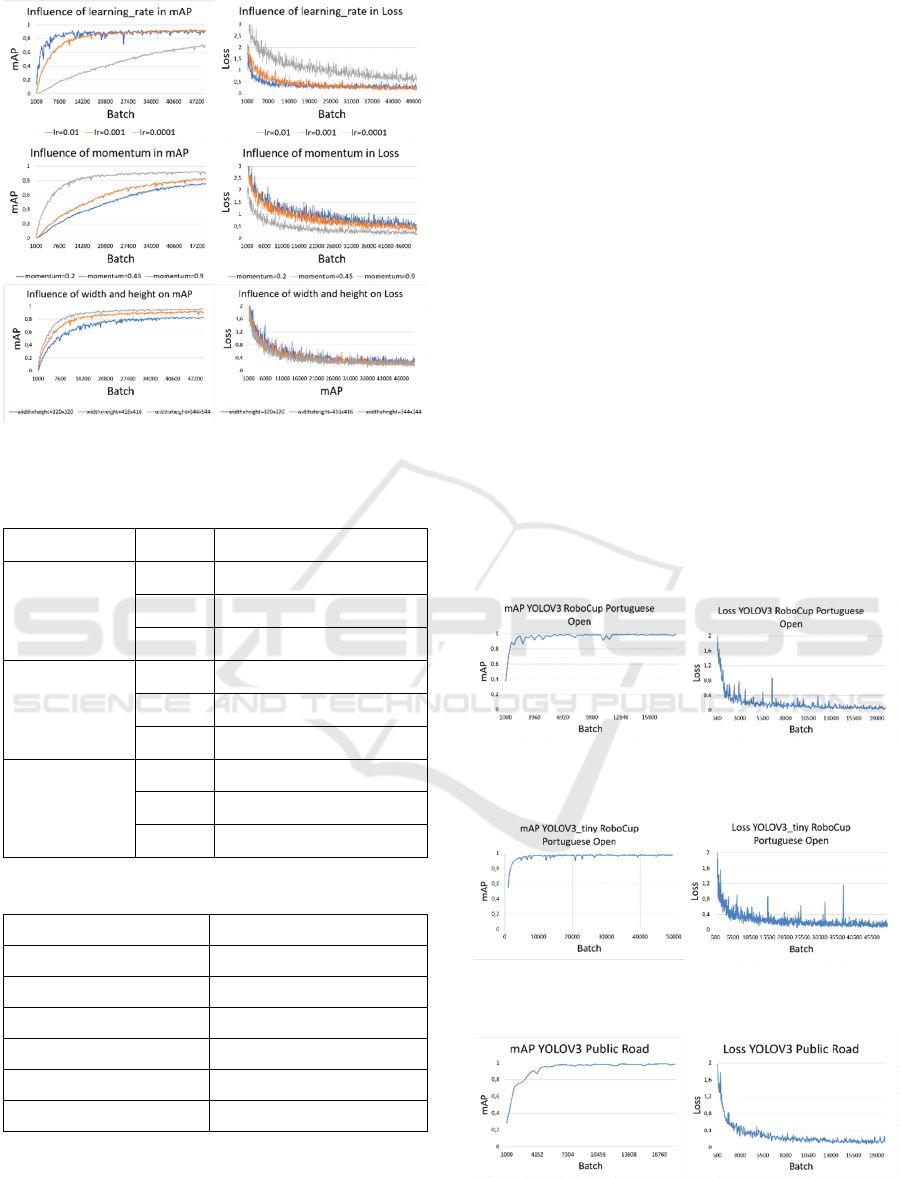
Figure 8: Tests to determine the most optimized values for
some hyperparameters for YOLOV3_tiny.
Table 3: Time the train lasted per parameter.
Hyperparameter Value Time the train lasted
max_batches
19000 4 hours 24 minutes
50000 14 hours 7 minutes
72000 17 hours 51 minutes
burn_in
500 13 hours 33 minutes
1000 12 hours 27 minutes
1500 11 hours 22 minutes
widthxheight
320x320 11 hours 42 minutes
416x416 14 hours 7 minutes
544x544 20 hours 4 minutes
Table 4: Optimised values for YOLOV3_tiny.
Hyperparameter Optimised value
max_batches 50000
learning_rate 0.001
momentum 0.9
burn_in 1000
decay 0.0005
width x height 544x544
5.3 Conclusion
By interpreting the results obtained in sections 5.1
and 5.2, the optimised values for the hyperparameters
for YOLOV3 network are the similar to the ones
provided in the paper. For YOLOV3_tiny network,
the only changed hyperparameter is the image size
(width and height). By increasing the number of
pixels per sign, it allows the network to have more
features to process, thus increasing accuracy.
6 RESULTS
After defining the most optimised hyperparameters,
the final neural networks were trained. In this section
the two networks developed for both objectives are
compared to determine the best for each scenario.
6.1 Final Networks
The networks were trained using the optimal
hyperparameters. Figure 9 shows the results of the
RoboCup Portuguese Open Autonomous Driving
Competition using the YOLOV3 network, whereas
Figure 10 shows the results for YOLOV3_tiny
network. Figure 11 shows the results of the Public
Road using the YOLOV3 network, whereas Figure 12
shows the results using the YOLOV3_tiny network.
Figure 9: RoboCup Portuguese Open Autonomous Driving
Competition (YOLOV3). Best mAP: 99.08%.
Figure 10: RoboCup Portuguese Open Autonomous
Driving Competition (YOLOV3_tiny). Best mAP: 98.47%.
Figure 11: Public Road (YOLOV3). Best mAP: 98.914%.
ICAART 2022 - 14th International Conference on Agents and Artificial Intelligence
822
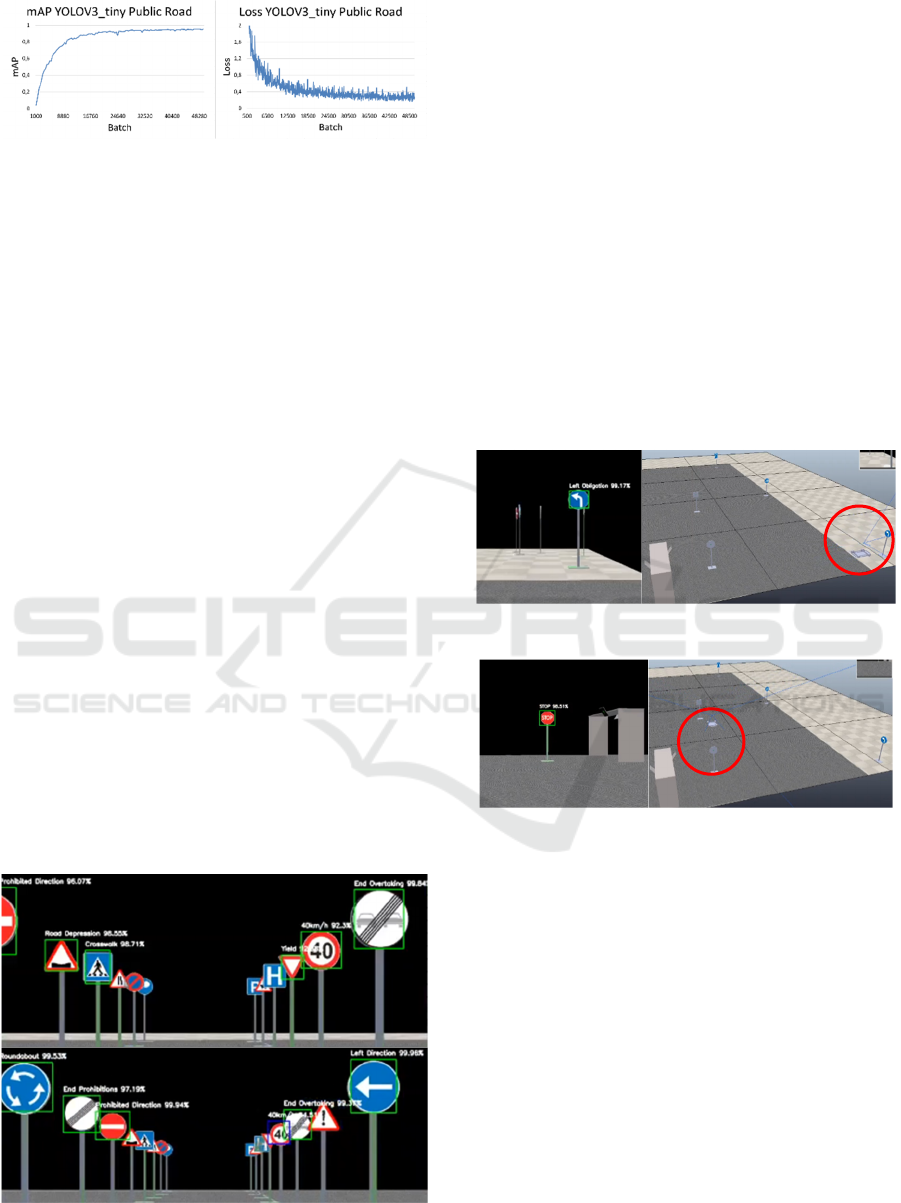
Figure 12: Public Road (YOLOV3_tiny). Best mAP:
95.584%.
6.2 Network Comparison
In this section, the outcome of the videos in the
Appendix is discussed to thoroughly understand the
differences between the networks. In the RoboCup
Portuguese Open Autonomous Driving Competition,
to test the networks for the simulation two tests are
deployed. On the first test, the signs are placed in line
to validate the correct classification and detection.
The lowest confidence for which signals were
detected was 80%. Comparing the two videos in
Appendix A) it is possible to verify that the
computational power required for the YOLOV3
network is superior to what the computer offers. This
means that only a fraction of the frames is processed.
Regarding classification, the fraction of processed
frames shows that the signs are all classified and
detected with confidence over 95%. On the left side
of Figure 13, an example of this high confidence in
detection is demonstrated. On the other hand, the
YOLOV3 tiny network manages to process the
frames in such a way that the robot is constantly
identifying and classifying the signs. Compared to the
other network YOLOV3_tiny does not have such
high detection confidence or stable Bounding Boxes
but its ability to process frames overcomes such
limitations. On the right side of Figure 13, this
detection is presented.
Figure 13: Frame with high confidence detection from
YOLOV3 (top) and YOLOV3_tiny (bottom) networks.
For the second test, the signs were placed so the
robot can detect these sequentially while performing
the respective movements. The robot reacted to the
signs when confidence was over 98%. Comparing the
two videos in Appendix A) from the second test, the
differences are like the previous test. The output for
the YOLOV3 network cannot process all the frames
so that the robot reacts to the traffic signs promptly to
perform the corresponding movements. This lack of
performance implied that the car only reacted to the
Left Obligation sign when it was already very close
to it. Regarding classification, the network can
correctly classify with confidence above 99% the
signs obtained. The moment the robot reacted to the
Turn Left Ahead sign is presented in Figure 14.
In this
test, the YOLOV3_tiny network enabled the robot to
go all the way until it stopped at the STOP sign,
displayed in Figure 15. Along the way, it was able to
correctly identify and react to all the signs.
Figure 14: The robot reacting to Turn Left sign (YOLOV3).
Figure 15: Frame where the Stop sign was detected
(YOLOV3_tiny).
To test on RoboCup Portuguese Open
Autonomous Driving Competition real-world
environment, two videos were recorded. These
demonstrate the robot driving along the track and
observing the signs/lights randomly placed. The
difference between the two is that the first video was
recorded with high stability and the second on the
robot prototype trying to complete the track as quickly
as possible. In Appendix B)
these videos are presented
for each of the networks. The signs are only detected
when confidence is over 80%. The YOLOV3 network
managed to process an average of 2 fps while the
YOLOV3_tiny 17 fps. If applied in real-time, the
YOLOV3 network would have problems reacting to
signs in a timely manner whereas the YOLOV3_tiny
would do so with a greater margin. Since YOLOV3
YOLOv3: Traffic Signs Lights Detection and Recognition for Autonomous Driving
823
could only process on a slow frame rate, so the video
showcases a post processing outcome of the
algorithm. By comparing both videos it is possible to
verify the correct functioning of both networks. The
result from both networks is very similar and for
YOLOV3 the detection percentages are slightly
higher, as can be seen in Figure 16.
Figure 16: Detection from the YOLOV3 (left) and
YOLOV3_tiny (right).
Regarding the detection distance, the results are
higher on the YOLOV3, detecting at 4 meters, half
the length of the track. Bounding Boxes have superior
accuracy and are more stable on the YOLOV3
network. The comparison between the Bounding
Boxes is shown in Figure 17.
Figure 17: Bounding Boxes from the YOLOV3 (top) and
YOLOV3_tiny (bottom).
In the videos with less stability, both networks can
detect the signs on the track, with YOLOV3 having
slight better precision and stability. The performances
are demonstrated in Figure 18.
The Public Road is the more complex objective.
The competition is more constrained and does not
have so many background variations that can lead to
difficulties in detection and classification. To test the
two networks, various videos were recorded showing
Figure 18: Detection with less stability from the YOLOV3
(top) and YOLOV3_tiny (bottom).
traffic signs and lights, and the algorithm output in
Appendix C). These videos were recorded in different
cities in northern Portugal. Different characteristics,
such as, luminosity, weather conditions, time of day
and luminosity incidence are shown in the videos. In
the videos, the signs are detected when confidence is
over 80%. In the first moments of the video, the
frames have conditions that can be considered ideal
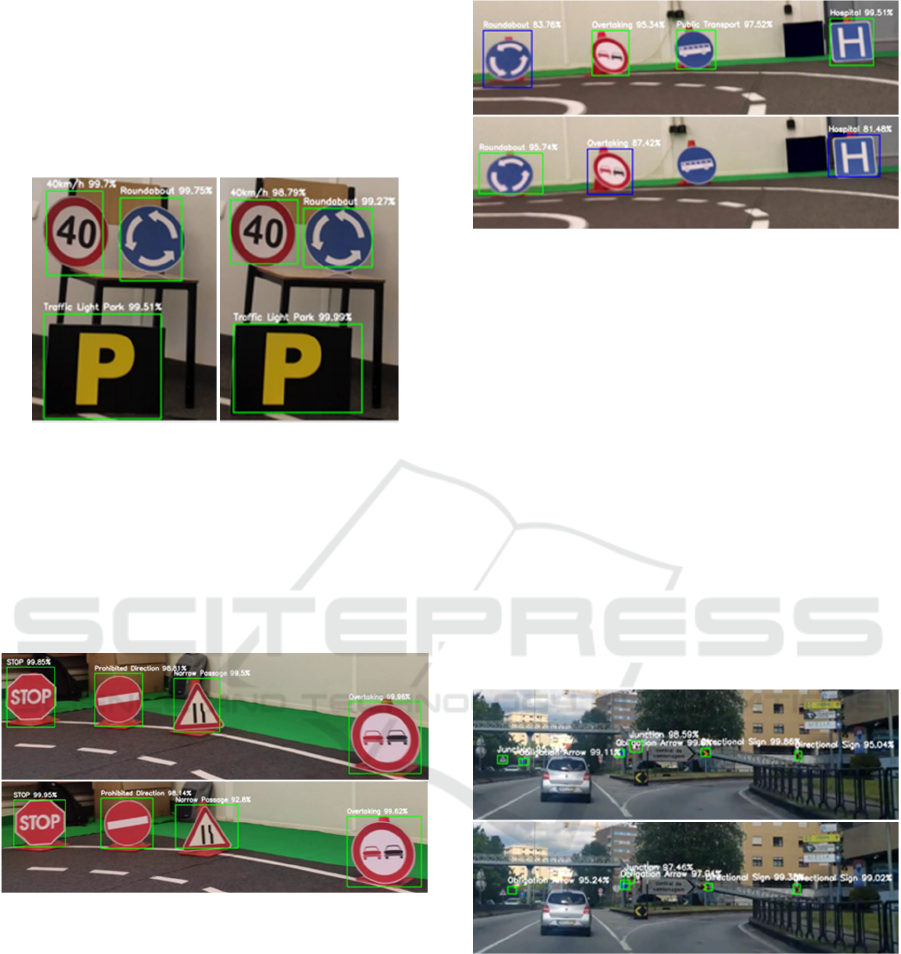
as it is sunny and the road has good lighting. In Figure
19, multiple signs appear at different distances and
the differences between the networks are quite
visible. While the YOLOV3 network can detect all
the signals presented with stable Bounding Boxes, the
YOLOV3_tiny network can only detect about half of
the signals and the Bounding Boxes fluctuate a lot in
position and some signs are cut.
Figure 19: Detection with ideal conditions from the
YOLOV3 (top) and YOLOV3_tiny (bottom).
In Figure 20 a different scenario is shown, where
it is raining, and the frame is blurrier. The YOLOV3
network can correctly classify every Traffic Sign with
confidence over 95%. The YOLOV3_tiny does not
achieve the same results. It can only detect the
Roundabout sign with 93.56%.
ICAART 2022 - 14th International Conference on Agents and Artificial Intelligence
824
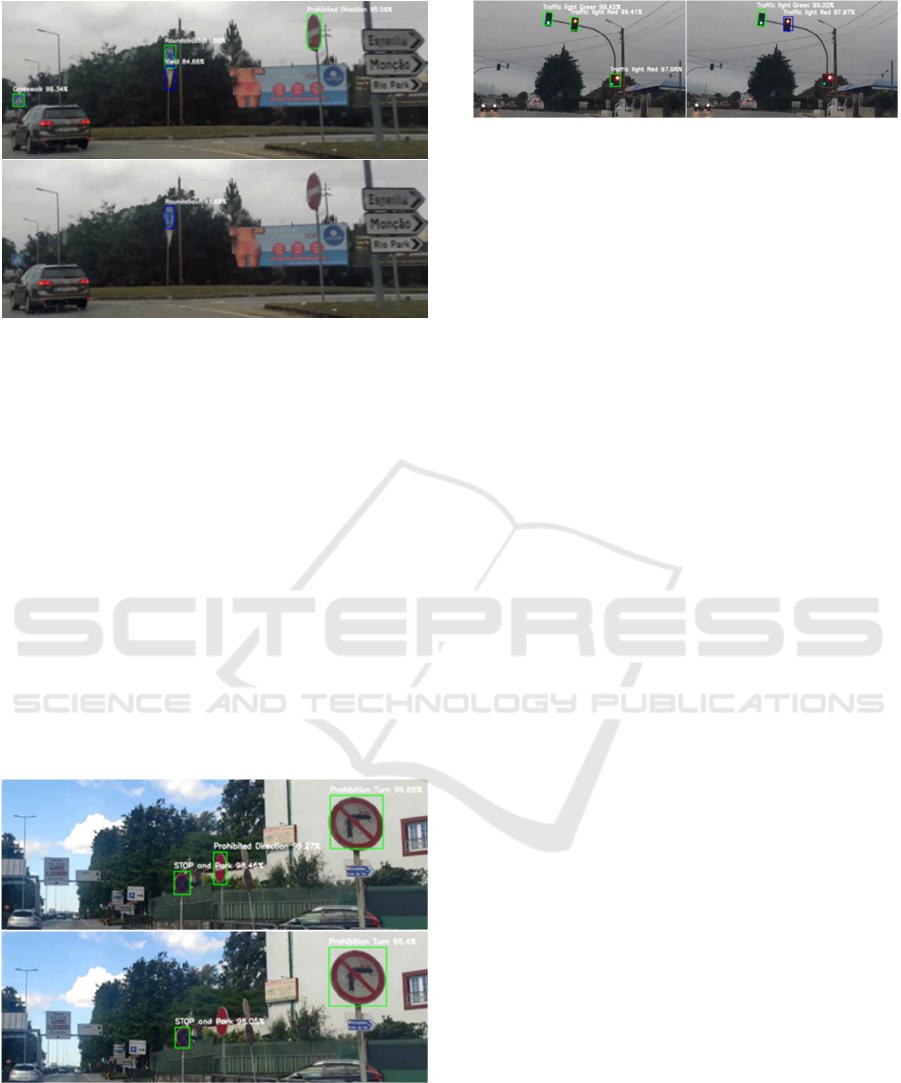
Figure 20: Detection with rain from the YOLOV3 (top) and
YOLOV3_tiny (bottom).
In ideal conditions, the frame presented in Figure
21 presents the detection of three traffic signs,
provided that the Prohibited Direction Sign is not
facing the camera. Both networks correctly classify
the two signs but the YOLOV3 one has significantly
higher confidence. The Bounding Boxes are less
precise in the tiny version. With rain, the detection of
traffic lights is tested. In Figure 22 the comparison of
the two networks is shown. The YOLOV3 correctly
identifies the traffic light and the colour from the two
top lights but incorrectly merges two lights into one
at the bottom. The tiny version only detects one traffic
sign at the top of the frame and also incorrectly
merges two lights into one at the bottom. In this
version, the colour on the top light is correctly
detected.
Figure 21: Detection of a sign not facing the camera from
the YOLOV3 (top) and YOLOV3_tiny (bottom).
Figure 22: Traffic Light detection from the YOLOV3 (left)
and YOLOV3_tiny (right).
7 CONCLUSIONS
Regarding the first objective, the most suitable
network is YOLOV3_tiny since, throughout the two
tests, it demonstrated that the traffic sign and lights
were correctly detected and classified. The processing
time of the YOLOV3 network meant that the robot
could not react on time to traffic signals, which in a
competition is a fatal error. In real-world competition,
the same problem regarding processing time was
encountered. In this competition, robots use small
devices to perform all computer processing and
therefore the most suitable network is YOLOV3_tiny
since the computational power is limited. The
accuracy of the YOLOV3 network is superior but this
does not overcome the processing time problem. For
the second objective, the high accuracy of the
YOLOV3 network proves this network as the
preferable option. Despite the problem of processing
time associated with this network, cars that contain
Traffic Sign Detection software have a higher
computational power which allows a lower
processing time and leads to a better accuracy in the
detection and classification. The tiny version does not
have an accuracy that allows the car to trust the signs
it classifies.
ACKNOWLEDGMENTS
This work has been supported by FCT—Fundação
para a Ciência e Tecnologia within the R&D Units
Project Scope: UIDB/00319/2020. In addition,
this work has also been funded through a
doctoral scholarship from the Portuguese
sFoundation for Science and Technology (Fundação
para a Ciência e a Tecnologia) [grant number
SFRH/BD/06944/2020], with funds from the
Portuguese Ministry of Science, Technology and
Higher Education and the European Social Fund
through the Programa Operacional do Capital
Humano (POCH).
YOLOv3: Traffic Signs Lights Detection and Recognition for Autonomous Driving
825

REFERENCES
Fu, M. Y., & Huang, Y. S. (2010). A survey of traffic sign
recognition. 2010 International Conference on Wavelet
Analysis and Pattern Recognition. Published.
https://doi.org/10.1109/icwapr.2010.5576425
Swathi, M., & Suresh, K. V. (2017). Automatic traffic sign
detection and recognition: A review. 2017 International
Conference on Algorithms, Methodology, Models and
Applications in Emerging Technologies
(ICAMMAET). Published. https://doi.org/10.1109/
icammaet.2017.8186650
Yu, J., Liu, H., & Zhang, H. (2019). Research on Detection
and Recognition Algorithm of Road Traffic Signs. 2019
Chinese Control And Decision Conference (CCDC).
Published. https://doi.org/10.1109/ccdc.2019.8833426
Cao, J., Song, C., Peng, S., Xiao, F., & Song, S. (2019).
Improved Traffic Sign Detection and Recognition
Algorithm for Intelligent Vehicles. Sensors, 19(18),
4021. https://doi.org/10.3390/s19184021
Rawat, W., & Wang, Z. (2017). Deep Convolutional Neural
Networks for Image Classification: A Comprehensive
Review. Neural Computation, 29(9), 2352–2449.
https://doi.org/10.1162/neco_a_00990
Moura, T., Valente, A., Sousa, A., & Filipe, V. (2014).
Traffic Sign Recognition for Autonomous Driving
Robot. 2014 IEEE International Conference on
Autonomous Robot Systems and Competitions
(ICARSC). Published. https://doi.org/10.1109/
icarsc.2014.6849803
Qian, R., Yue, Y., Coenen, F., & Zhang, B. (2016). Traffic
sign recognition with convolutional neural network
based on max pooling positions. 2016 12th
International Conference on Natural Computation,
Fuzzy Systems and Knowledge Discovery (ICNC-
FSKD). Published. https://doi.org/10.1109/
fskd.2016.7603237
Sociedade Portuguesa de Robótica, “Robótica 2019 - Rules
for Autonomous Driving.”
APPENDIX
A) RoboCup Portuguese Open Autonomous Driving
Competition in simulation: https://youtu.be/oaBd6Ub-o7E
B) RoboCup Portuguese Open Autonomous Driving
Competition real-world: https://youtu.be/T2USKNakM9w
C) Public road: https://youtu.be/zzIkw8suny4
ICAART 2022 - 14th International Conference on Agents and Artificial Intelligence
826
