
A Wireless Low-power System for Digital Identification of Examinees
(Including Covid-19 Checks)
Danilo Weber Nunes
a
and Klaus Volbert
Faculty of Computer Science and Mathematics, Ostbayerische Technische Hochschule Regensburg, Regensburg, Germany
Keywords:
Indoor Navigation, Indoor Localisation, Low-power Devices, Internet of Things, RSSI, BLE Beacons.
Abstract:
Indoor localization has been, for the past decade, a subject under intense development. There is, however,
no currently available solution that covers all possible scenarios. Received Signal Strength Indicator (RSSI)
based methods, although the most widely researched, still suffer from problems due to environment noise. In
this paper, we present a system using Bluetooth Low Energy (BLE) beacons attached to the desks to localize
students in exam rooms and, at the same time, automatically register them for the given exam. By using
Kalman Filters (KFs) and discretizing the location task, the presented solution is capable of achieving 100%
accuracy within a distance of 45cm from the center of the desk. As the pandemic gets more controlled, with
our lives slowly transitioning back to normal, there are still sanitary measures being applied. An example
being the necessity to show a certification of vaccination or previous disease. Those certifications need to be
manually checked for everyone entering the university’s building, which requires time and staff. With that in
mind, the automatic check for Covid certificates feature is also built into our system.
1 INTRODUCTION
Industry projections estimate that nearly 75 billion
Internet-of-Things (IoT) devices will be online by
2025 (Ikpehai et al., 2019). A common IoT appli-
cation is to provide location services in indoor en-
vironments. The indoor localization and navigation
involving the use of Received Signal Strength Indi-
cator (RSSI) information of radio signals is an area
in active development (Spachos et al., 2018). As
Global Navigation Satellite Systems (GNSS) systems
are not suitable for the indoor application (Laoudias
et al., 2018), most attempts used RSSI information
from WiFi or Bluetooth signals, emitted by routers
and Bluetooth Low Energy (BLE) beacons, respec-
tively (Zafari et al., 2019).
In order to perform localization, signal finger-
printing is commonly applied and performed in a two
phase process (He and Chan, 2016). First, the RSSI
fingerprint of each emitter in the room/building has to
be collected, this phase is denominated the ”offline”
one. During the ”online” phase, the collected signals
used to build a signal map of the scanned environment
enables the location by means of trilateration, when 3
beacons are detected, or by multilateration, in case
more beacons are detected (Spachos et al., 2018).
a
https://orcid.org/0000-0002-0401-0842
In 2020, the whole world was hit by surprise by
the outbreak caused by the Severe Acute Respiratory
Syndrome Coronavirus 2 (SARS-CoV-2). It forced
governments for actions inhibiting the spread of the
deadly disease. Lockdowns and curfews were im-
posed, masks were made mandatory and places where
social gatherings used to take place, like restaurants,
had to be closed and offices and universities had to
move to an online format (Ciotti et al., 2020).
At the OTH Regensburg, all lectures were con-
verted to the online format. However, the exams were
still held in presence. This required some adaptations.
The room should allow the placement of the desks up
to 2 meters apart, and all students obligatory should
wear a mask during the period of the exam. Each stu-
dent was assigned to a table, before leaving the room
he/she should inform this to the examiner.
In parallel, contact tracing measurements for pos-
itive tested persons were adopted. At first, manually
by health vigilance professionals, but, as far as the
number of infected individuals increased exponen-
tially, it quickly turned out unfeasible. Thus, govern-
mental and private companies developed mobile ap-
plications for the tracking of infected individuals and
their contacts, detecting the Bluetooth signals of the
nearby devices (Li and Guo, 2020). However, this ap-
proach had some pitfalls. As the determination of the
Nunes, D. and Volbert, K.
A Wireless Low-power System for Digital Identification of Examinees (Including Covid-19 Checks).
DOI: 10.5220/0010912800003118
In Proceedings of the 11th International Conference on Sensor Networks (SENSORNETS 2022), pages 51-59
ISBN: 978-989-758-551-7; ISSN: 2184-4380
Copyright
c
2022 by SCITEPRESS – Science and Technology Publications, Lda. All rights reserved
51

distance between 2 phones is based on the RSSI, this
information can be affected by multiple factors as the
multipath signal propagation, interference, or simply
different power levels of the Bluetooth signal of the
different smartphones, resulting in imprecise and in-
consistent measurements (Ahmed et al., 2020).
In this study, we present a different approach to in-
door location that solves the problems involving RSSI
based distance estimation for both contact tracing as
well as for indoor localization. For this, BLE beacons
were attached to each desk and used as anchors, there-
fore, with no need to rely on trilateration / multilater-
ation methods using the RSSI information from mul-
tiple beacons to locate. By filtering the environmental
noise with Kalman Filters (KFs) and discretizing the
location task, it allows to achieve better metrics, as
well as more efficient contact tracing, all comprised
in a single phase with no need for calibration, saving
a considerable amount of time.
The developed solution also allows automatic
checkup of Covid vaccination or previous infection
certificates, user identification and exam registration
with no need of the user’s interaction.
Section 2 shows the related work; Section 3
presents the motivations and the goals of this study;
Section 4 reports the description of the hardware; Sec-
tion 5 presents the architecture of the system and the
software stack. Section 6 shows the accuracy of the
system, section 7 the conclusion and further studies.
2 RELATED WORK
In recent years, wireless systems especially so-called
low-power or even ultra-low-power wireless systems
become more and more popular. In the theoretical
area (Schindelhauer et al., 2007; Lukovszki et al.,
2006; Meyer auf der Heide et al., 2004) as well as in
practice, with applications like smart metering, smart
submetering, and/or smart grid (Kenner et al., 2017).
Concerning indoor localization, recent studies
have shown that it is possible to achieve sub-meter
precision in indoor scenarios using various techniques
and technologies.
Klipp et al. reported that it is possible to achieve
sub-meter precision localization by using magnetic
signatures in combination with Inertial Measurement
Unit (IMU) data. The results, however, depend on
an unambiguous magnetic disturbance pattern and a
known initial position (Klipp et al., 2018).
Neges et al. have presented a solution combin-
ing IMU information with natural visual markers,
not requiring investments in additional infrastructure
(Neges et al., 2017). Gong et al., presented a sim-
ilar method, using Convolutional Neural Networks
(CNNs) to perform image recognition and enable lo-
calization, achieving an error rate of 2.3 meters (Gong
et al., 2021). These methods still require a calibration
phase to collect the natural markers and a high degree
of user interaction to work.
Despite early claims of the unreliability of RSSI-
based methods (Dong and Dargie, 2012), many de-
veloped solutions are based on these methods due to
its ease of use and implementation and the wide hard-
ware availability (El-Sheimy and Li, 2021).
The RSSI value, measured in dBm, is given by the
following equation (Dong and Dargie, 2012):
RSSI = −10 ·n · log
10
(d) − A (1)
In Equation 1, n is the signal propagation constant
in the environment, d is the distance between the stu-
dent’s smartphone and the BLE beacon attached to the
desk and A is a reference received signal strength in
dBm. It represents the value measured when the dis-
tance between the smartphone and the BLE beacon
is one meter. RSSI Values closer to zero indicate a
stronger signal.
RSSI-based methods are highly subjected to insta-
bilities (Xiao et al., 2013) which may alter the signal
map collected before an exam. This is due to errors
such as multipath signal propagation, Non-Line-of-
Sight (NLoS) conditions, and signal interference.
To mitigate the signal instabilities, KFs can be ap-
plied to reduce the impact of noise in the environment
(Bulten et al., 2016). Mackey et al. has shown an im-
provement in the localization accuracy of up to 78.9%
in a four beacon setup (Mackey et al., 2018).
Many works apply a fingerprinting approach to
perform indoor localization using the RSSI and chan-
nel state information (CSI) based information (Al-
homayani and Mahoor, 2020). Luo and Gao have
shown improved localization accuracy when employ-
ing Deep Belief Networks for fingerprinting on Ul-
tra Wide Band (UWB) signals (Luo and Gao, 2016)
and Ayyalasomayajula et al. introduced a two-step
process applying CNNs on WiFi CSI data (Ayyalaso-
mayajula et al., 2020). These methods, however, lack
of support in consumer devices and require a higher
energy consumption (on the client-side) when com-
pared to BLE, respectively. Another problem involv-
ing fingerprinting approaches emerges by the fact that
it is subjected to inconsistencies between the data col-
lected during the ”offline” phase and the data being
presented during the ”online” phase. Fingerprinting
in an empty room would generate a different signal
map than when done in a room full of students.
This paper describes a simple approach to indoor
localization that uses BLE beacons as anchors, there-
fore, avoiding weaknesses and extra complexity in-
SENSORNETS 2022 - 11th International Conference on Sensor Networks
52

volving signal trilateration or fingerprinting. The task
consists of finding the closest beacon instead of cal-
culating the distance itself.
3 MOTIVATION AND GOALS
While the pandemic is getting more controlled, our
lives are slowly transitioning back to normal social
activities, but there will still be a need for sanitary
vigilance in all spheres of the society, as safety dis-
tance, the wear of face masks, vaccination/previous
infection certification, and the further integration of
contact tracing apps.
Actually in Germany, for any subject to enter the
university building it is necessary to present a certifi-
cation of vaccination or previous disease, or a neg-
ative Covid test (not older than 24 hours). In sce-
narios with more intense social gathering as restau-
rants or bars, in addition to the previously mentioned
measurements, a manual registration step, which one
has to share his/her contact information through a QR
code or through the Luca App
1
, is required. All these
steps need to done repetitively by each customer.
As all certifications and registrations on the app
have to be checked by the staff before entering the
venue. Although all these checks and measurements
are necessary, they will slow down a previously fluid
process, creating unnecessary waiting queues, beside
increasing the human error.
Another problem which emerges from this pro-
cess is the necessity of the precise registration of the
check-out time, to avoid false warning of contact with
a positive infected person, due to a false timeline over-
lap of the presence. The Luca App offers an ”auto-
check out” function, however, it requires, however,
access to GPS, rising privacy concerns.
At the OTH Regensburg, all these difficulties
would be seen during the exams in presence, with ad-
ditional steps as the proof of identity and the exami-
nee’s signature of the list confirming that he/she had
taken the exam. In order to reduce the manual ac-
tions required for the registration and consequently,
the waiting time for the students enrolled in the exam,
and the work load of the examiner, normally the pro-
fessor, we developed an app integrated to the system
of the faculty, which enables the automatic registra-
tion for the exam, the check in/out time, as well as
the precise localization of each user in the room. The
system also reduced the need of repetitive checks of
Covid certificate by staff. The user needs minimal in-
teraction with the app, just being required a one time
1
See https://www.luca-app.de/system-2/
user account setup step, similar to the Luca App. The
integration of our app with the system of the faculty
facilitates the students’ identification, and automati-
cally inserts his/her presence into the faculty system.
With these problems in mind, we developed a sys-
tem that enables the automatic check in/out step and
the registration into an exam as well as the precise
location of the user in the room. It also completely
eliminates the need from repetitive Covid certificate
checks by the staff, all that, at the same time, requir-
ing no user interaction with the app. The only interac-
tion required with the App is a one time user account
setup step, similar to what is done in the Luca App,
but with integration with the faculty’s system.
This system also facilitates and improves contact
tracing. The automatic registration for check- in and
check- out also facilitates and improves the correct
contact tracing, minimizing false positives. The more
precise desk localization of each examinee based on
discrete and not on distance inferred from RSSI data,
also allows the identification of at risk neighbours
(within a distance of 4 desks) to an infected person,
limiting the necessary notification.
As we discuss in section 7, this system could be
adapted and applied to other contexts like restaurants
and other events.
4 HARDWARE
For this work, ten iBKS105 BLE beacons from the
Spanish manufacturer Accent Systems were used.
The use of ultra-low power solutions was consid-
ered, as they would require less power and, there-
fore, have easier maintenance regarding the batteries.
The use of BLE beacons was chosen, however, due
to the ease of development, compatibility with tech-
nologies currently present in smartphones, thus with
no requirement for special gateways (Kenner and Vol-
bert, 2016; Altmann et al., 2017).
The beacons have a diameter of 52.6 mm and a
thickness of 11.3 mm (closed case). Figure 1 show
a view of it inserted in its acrylonitrile butadiene
styrene (ABS) case.
Each beacon is powered by a nRF51822 Bluetooth
Low Energy System-on-a-Chip (SoC) from Nordic
Semiconductor and a CR2477 coin cell 3V battery.
It has a programmable output power from +4 dBm to
-30 dBm, 4 available Eddystone slots, with 4 possible
frames (UID, URL, TLM and EID) and 2 available
iBeacon slots.
The selection of the beacons was based on their
high quality, the ease of their configuration, and their
affordable price, with each unit costing 13e. The con-
A Wireless Low-power System for Digital Identification of Examinees (Including Covid-19 Checks)
53
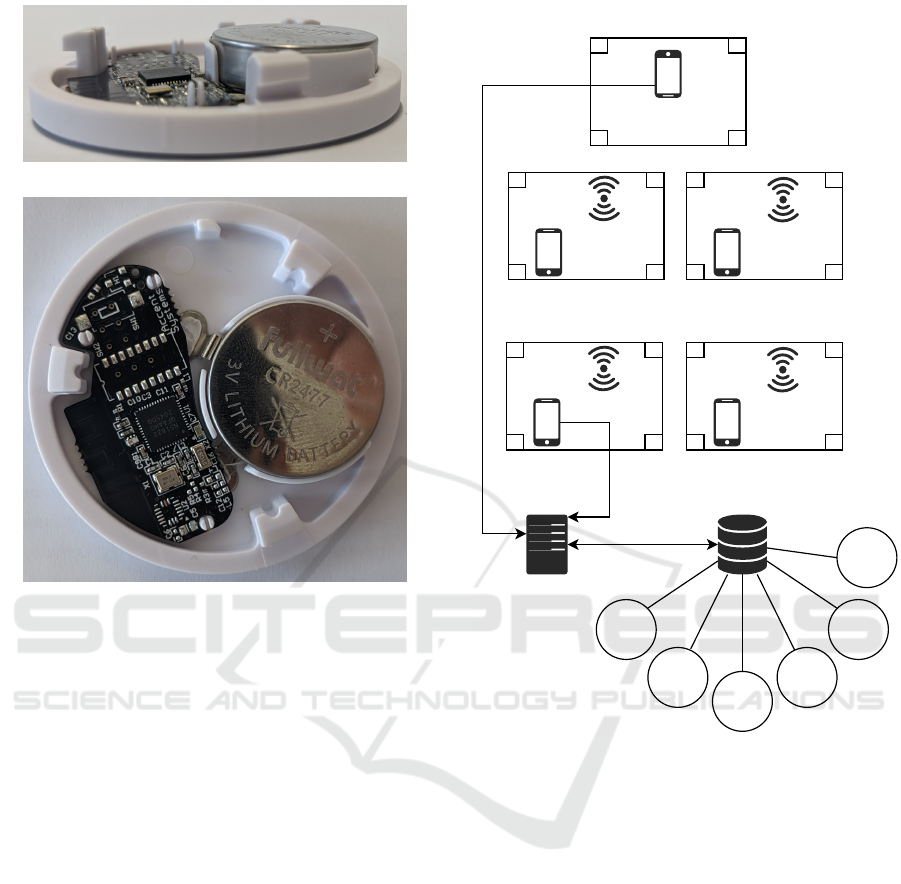
(a) View from the side.
(b) View from the top.
Figure 1: Example of beacon used. It has 52.6 mm of diam-
eter and 11.3 mm of thickness.
figuration of the beacons was performed by the app
provided by the manufacturer, iBKS Configure.
The app also allows for Over-The-Air (OTA) up-
dates, so there is also no need to develop update pro-
tocols (Schwindl et al., 2019).
The beacons were configured to transmit only one
Eddystone frame containing the beacon’s UID. This is
performed 3 times a second with a transmission power
set to -30 dBm. This low transmission power was set
to assure that nearby beacons would not interfere with
each other, as well as to extend the life of the battery,
estimating the consumption to about 97.78 µA, with
an expected battery life of 14 months. All other slots
were disabled with the same intention.
5 SOFTWARE
In the following Section we present the software used
to build the presented system. An overview of the ar-
chitecture of the system can be seen in Figure 2. The
data flow diagrams from the students’ and examiner’s
perspective is presented in figures 3 and 4, respec-
tively. The localization algorithm is shown in Figure
Web Server
Students's Phone Students's Phone
Students's PhoneStudents's Phone
Exams
BLE
Beacon
IDs
Desks
Examiner's
Phone
BLE
Beacon
BLE
Beacon
BLE
Beacon
Beacons
Room
Maps
Certificates
Database
Figure 2: System’s Architecture.
5. The communication between the mobile Apps and
the server is done through a REST API (Masse, 2011).
5.1 Mobile Apps
The mobile Apps are the central part of this system,
having one app to be used by the students, and a sec-
ond one by the examiner.
Both apps were written using the React Native
framework (Eisenman, 2015), as it enables rapid de-
velopment and testing, with support for hot-reloading.
It also eases multi-platform development, allowing
the sharing of most of the code base between both
iOS and Android apps.
The student’s app was designed to require the less
amount of user interaction as possible to work.
For the first use, the student will register with
his/her university credentials, thus, allowing access to
their examination schedules. The app will ask for the
upload of the certification of vaccination or recovery.
SENSORNETS 2022 - 11th International Conference on Sensor Networks
54
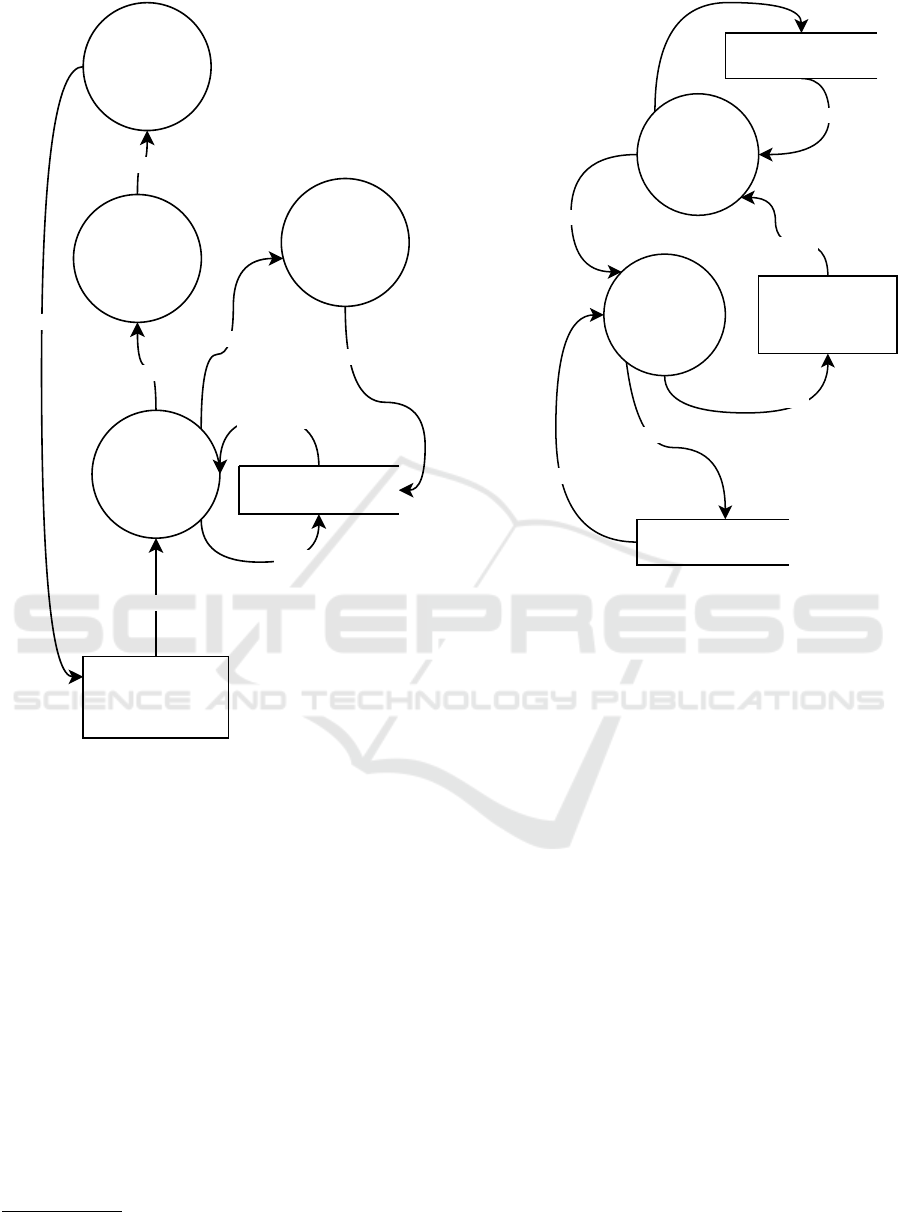
Verify
Login
Login Details
Covid Certificate
Selected Exam
Student
Send Confirmation
Add Covid
certificate
Permission to register
Register for exam
Assigned Desk
Gets a desk
Confirm Identity
User Database
Figure 3: System’s Data flow Diagram from the user’s per-
spective.
It will then scan the uploaded pdf or picture and ex-
tract the QR code that it holds. This QR code will then
be decoded, extracting the Base45 encoded CBOR
Web Token (CWT). The Base45 encoded CWT will
then be sent to a self-hosted instance of the Open
Covid Certificate Validator API
2
. The API response
will contain, between other pieces of information, a
Boolean value indicating if the uploaded certificate is
valid or not. Except for this information, no other
information is stored neither in the student’s smart-
phone nor in the servers.
The student will receive the confirmation of the
registration with an assigned desk and a map of the
room, which are then stored by the app, facilitating
the localization of his/her desk.
With his/her user setup complete, there is no more
2
https://github.com/merlinschumacher/
Open-Covid-Certificate-Validator
Verify
Assigned Examination
Login
List of Students
Login Details
Examiner
Students Registered
User Database
Confirm Identity
Examiner Database
Examination
Examination
Details
Figure 4: System’s Data flow Diagram from the examiner’s
perspective.
required interaction of the user with the app. The app
will run as a background process, shortly scanning for
nearby beacons every fifteen minutes.
When the app detects a known beacon (one that
match the set UID), it will start a foreground service
(Android) for the app to increase the rate of signals
being collected. Due to the already mentioned unsta-
ble nature of BLE signals, KFs were used to stabilise
the signals of the beacons.
KFs are recursive stochastic filters and will be
used to process and smooth the noisy RSSI infor-
mation received by the smartphone. For that, one-
dimensional KFs were used.
A KF is divided in two stages, prediction and up-
date. In the prediction stage, the current state of sys-
tem and the next state estimate uncertainty are pre-
dicted through the Equations 2 and 3, respectively.
In the update stage, a new Kalman gain is calcu-
lated using Equation 4 and the state estimate uncer-
tainty is updated following Equation 5.
The filtered signal is obtained by the following
equation:
ˆx
n,n
= ˆx
n,n−1
+ K
n
(z
n
− ˆx
n,n−1
) (2)
Where ˆx
n,n−1
is the previous system state estimate,
K
n
the Kalman gain, obtained by Equation 4, and z
n
the measured system state.
A Wireless Low-power System for Digital Identification of Examinees (Including Covid-19 Checks)
55
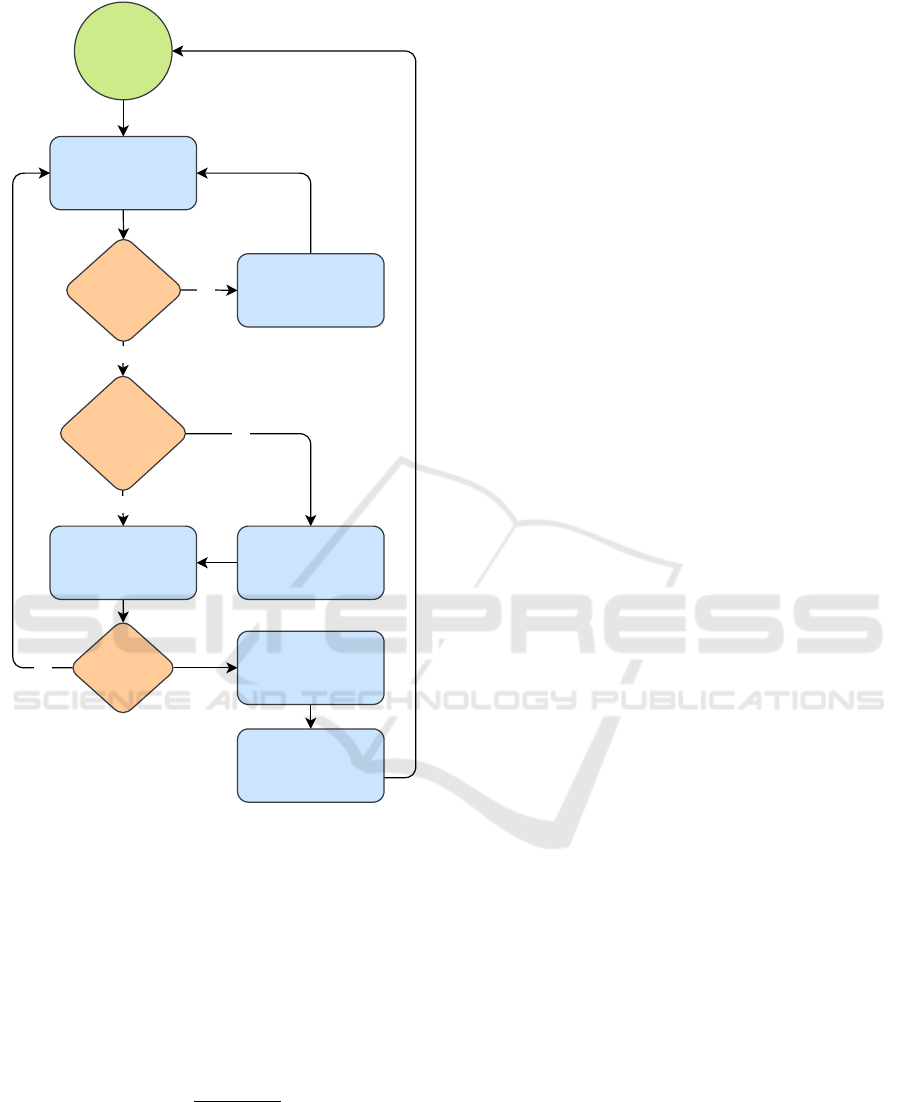
Start
Collect RSSI
information from the
environment
No
Yes
Instantiate a new KF
for that beacon
Filter Signal
No
Set the Student's
desk as the one with
strongest filtered
signal
Send current desk ID
to the Server
No
Yes
Does the UID
match?
Was the
beacon
previously
detected?
Have 2
seconds
passed?
Discard
Measurement
Figure 5: Flowchart of the localization algorithm.
The prediction of the next state estimate uncer-
tainty is performed as follows:
p
n+1,n
= p
n,n
+ q
n
(3)
Where p
n,n
is the current state estimate uncer-
tainty and q
n
the process noise variance, which is the
variance of the uncertainty of our dynamic model.
The Kalman gain is calculated by the equation:
K
n
=
p
n,n−1
p
n,n−1
+ r
n
(4)
Where r
n
is the measurement error, calculated by
Equation 5, and p
n,n−1
represents the estimate uncer-
tainty calculated during the previous filter estimation.
The Kalman gain the intensity of which the estimate
will change given a measurement.
The update of the current state estimate uncer-
tainty is done by:
p
n,n
= (1 − K
n
)p
n,n−1
(5)
The app will localize the student and the desk at
every two seconds, avoiding false positioning due to
loss of signal. An overview of the localization algo-
rithm is shown in Figure 5.
If a student is not sitting on his/her correct desk,
the app will vibrate, indicating the error. Simultane-
ously, the examiner will receive the information of the
incorrect match between the student and the desk, to
adjust the positioning promptly before the beginning
of the exam. The student being recognized on the cor-
rect desk, automatically will be registered as ”taking
the exam”, sending this information to the backend
server, making it available for the examiner’s app.
The examiner’s app is designed as a more tradi-
tional app. The examiner will login with his/her uni-
versity credentials, allowing to access the list of ex-
ams, the layout of the examination rooms, the list of
student’s who registered for the exam and the desks
they were assigned to. The examiner will receive a
map of the occupied and free desks, at the end of the
exam generating a list of the students who attended.
If necessary, the examiner can replace a student to an-
other desk on the app.
5.2 Backend Server
The backend server was implemented using the
FastAPI Python framework (Voron, 2021). It was
chosen due to its simplicity and development speed.
In the current state of the system, the backend is a
simple component. It has to perform only two tasks:
to query and store the data of both apps, and to assign
each student a desk.
A PostgreSQL database (Obe and Hsu, 2017) was
used to store the student’s and the examiner’s data.
For the students, their credentials, registered exams
and each assigned desk, and the confirmation of a
Covid certificate are stored, and for the examiners,
their credentials and assigned exams. The map of the
examination room and the localization of each beacon
are also stored in the database.
6 EVALUATION
As the localization through the beacons is the most
critical part of the system, we performed a series of
tests to analyse the reliability of the signal localization
of each beacon and the limits of the system.
SENSORNETS 2022 - 11th International Conference on Sensor Networks
56
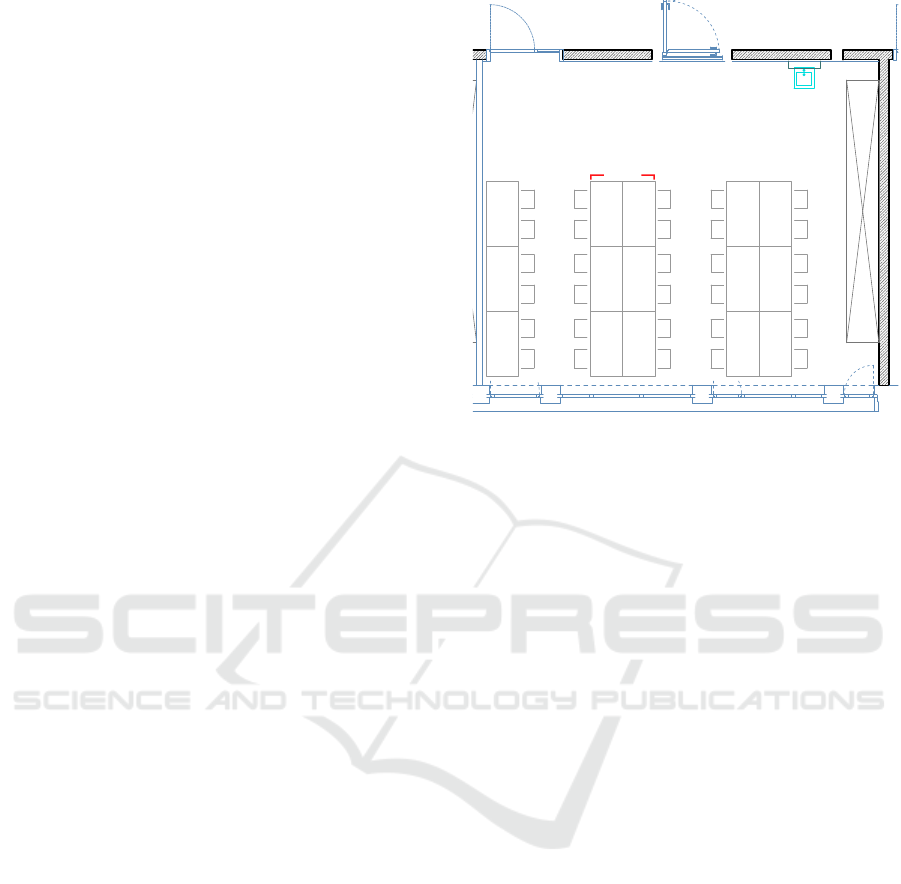
The tests were performed in the laboratory of In-
telligent and Connected Systems in the computer sci-
ence building at the OTH Regensburg. Ten beacons,
numbered from 1 to 10, were placed in the room un-
der the desks, right in the middle, within a distance of
1.5 meters apart from each other. A floor plan of the
room is exposed in Figure 6.
To perform the measurement as realistically as
possible, the phones were placed in a pocket of a
trouser, and signals were collected while sitting at the
desk for two minutes. Two examples of collected sig-
nals from two different desks are shown in Figure 7.
Figure 7a a shows the graph with the highest in-
terference scenario from a nearby beacon. Even the
signal of beacon n
8
being the strongest and the most
stable, thus detecting the correct desk, it was clearly
subjected to destructive interference from beacon n
9
.
Figure 7b shows the more common scenario, the sig-
nal of the desk being significantly stronger than the
ones coming from nearby beacons.
Considering the challenging results at desk n
8
, we
tested the accuracy of the signal, changing the stu-
dent’s position from the center of the desk. Position
was moved towards the desk n
9
in 15 cm steps, within
a range from 15 to 75 cm. The samples were collected
in these 5 different distances (15, 30, 45, 60 and 75
cm) during two minutes each. The results are exposed
in Figure 8.
As we can observe, the strength of the signal of
the beacon placed at desk n
8
is still the highest within
the range of 45 cm away from the center of the desk.
The signal strength drops significantly when increas-
ing the distance to 60 and 75 cm, with a prominent
increase of the signal of the neighbour desk n
9
, as
well as a smaller, but noticeable increase of the sig-
nal strength of desk n
10
.
7 CONCLUSIONS AND FUTURE
WORK
In this section we conclude our work and discuss
some ideas for future work.
7.1 Conclusion
In this work, the authors present a feasible solution for
the monitoring of examinee’s localization in a room,
as well as an automatic exam registration and Covid
certification check app in an university environment.
Our results reinforce the reliable use of BLE bea-
cons, exposing also the limitations of such a system.
Considering the placement of the beacons on the
desks and the fact that a person sitting at the as-
3,92
3,45
5
3,92
3,45
5
3,63
3,74
5
Dacheinlauf
Tiefpunkt Gefälledämmung
d = 16 cm
Dacheinlauf
Tiefpunkt Gefälledämmung
d = 16 cm
Dacheinlauf
Tiefpunkt Gefälledämmung
d = 16 cm
Dacheinlauf
Tiefpunkt Gefälledämmung
d = 16 cm
Gefälledämmung
d = 27 cm
Gefälledämmung
d = 30 cm
Hochpunkt Gefälledämmung
d = 30 cm
Gefälledämmung
d = 30 cm
Gefälledämmung
d = 24 cm
Gefälledämmung
d = 30 cm
Gefälledämmung
d = 30 cm
Gefälledämmung
d = 30 cm
Dacheinlauf
Tiefpunkt Gefälledämmung
d = 16 cm
Dacheinlauf
Tiefpunkt Gefälledämmung
d = 16 cm
Dacheinlauf
Tiefpunkt Gefälledämmung
d = 16 cm
Dacheinlauf
Tiefpunkt Gefälledämmung
d = 16 cm
Gefälledämmung
d = 27 cm
Gefälledämmung
d = 30 cm
Hochpunkt Gefälledämmung
d = 30 cm
Gefälledämmung
d = 30 cm
Gefälledämmung
d = 24 cm
Gefälledämmung
d = 30 cm
Gefälledämmung
d = 30 cm
Gefälledämmung
d = 30 cm
Dacheinlauf
Notentwässerung
Dacheinlauf
Notentwässerung
Dacheinlauf
Notentwässerung
Dacheinlauf
Notentwässerung
Dacheinlauf
Notentwässerung
Infokästen
Flachdach mit 2% Gefälle
durch Gefälledämmung
maximale Überstauhöhe Notentwässerung
maximale Anstauhöhe
Überstauhöhe Dachentwässerung
maximale Überstauhöhe Notentwässerung
Überstauhöhe Dachentwässerung
maximale Überstauhöhe Notentwässerung
Überstauhöhe Dachentwässerung
maximale Überstauhöhe Notentwässerung
Überstauhöhe Dachentwässerung
34,56 m
2
RS/JS
08.08.2012
GRUNDRISS 1.OG - Übersicht
128x69,8
P5_K_A_GR_01_0_O
GRUNDRISS 1.OG - Übersicht
24.08.2017
Notentwässerung angepasst; Sichtfenster entfernt
js 25.11.15 I
Notentwässerung angepasst js 15.01.16 J
Türzargen angepasst mm 01.06.16 K
Brandschutzanforderungen der Trennwände in ELT Räumen angepasst; Medienkanäle ergänzt;
Durchbrüche für Brandschutztellerventile in Kernen ergänzt; Durchbrüche ELT in GK angepasst
js 20.06.16 L
Durchbrüche HLS bei Technikräumen Kerne angepasst; Wandstärke Technikschachtabschluss
angepasst
js
04.07.16
M
Brandschutzanforderungen der Wände Raum K134 und K135 angepasst
mm N29.08.16
js
Türbezeichnungen angepasst; Türdrehung Zugang K120 geändert; Höhe Doppelboden Serverraum
korrigiert; Bodenbelag Putzmittelraum K166 angepasst
O
29.08.16
n1
n2
n3
n4
n5
n6
n7
n8
n9
n10
1.60 m
Figure 6: Experimental environment indicating the posi-
tions of the beacons from n
1
to n
10
.
signed desk would absorb most of the signal coming
from his/her desk’s beacon, we believe that our results
would even be better in a real life testing set (with
a full room) as the interference between the beacons
would be considerably reduced.
Taking into account the limitations of movement
in an examination scenario and the imposed sanitary
restrictions, in which the examinees are required to
stay apart within a distance of 1.5 m, the situation of
an examinee being 60 or 75 cm away from his/her
desk’s beacon (exposed in Figure 8) would hardly
happen in a real life scenario.
Beside the accuracy of supervising the contact of
possibly infected individuals, the system will also re-
duce the time to ingress in an examination room, fa-
cilitating the localization of the assigned desk. The
integration to the university system also helps the ex-
aminer to generate the report of the exam.
7.2 Further Work
As for future works, the reliability of the system
might be improved, avoiding misplacement of an ex-
aminee as in the edge test. In addition to the Blue-
tooth based localization strategy, information of IMU
sensor data can be combined, detecting the movement
of an examinee, thus, avoiding situation in which the
system would not be able to determine if the student
changed the place or not.
As this app would be designed for the facilitation
of registration and realization of exams, the function-
ality of the app can be enlarged, muting automatically
the student’s phones and restoring their original state
A Wireless Low-power System for Digital Identification of Examinees (Including Covid-19 Checks)
57
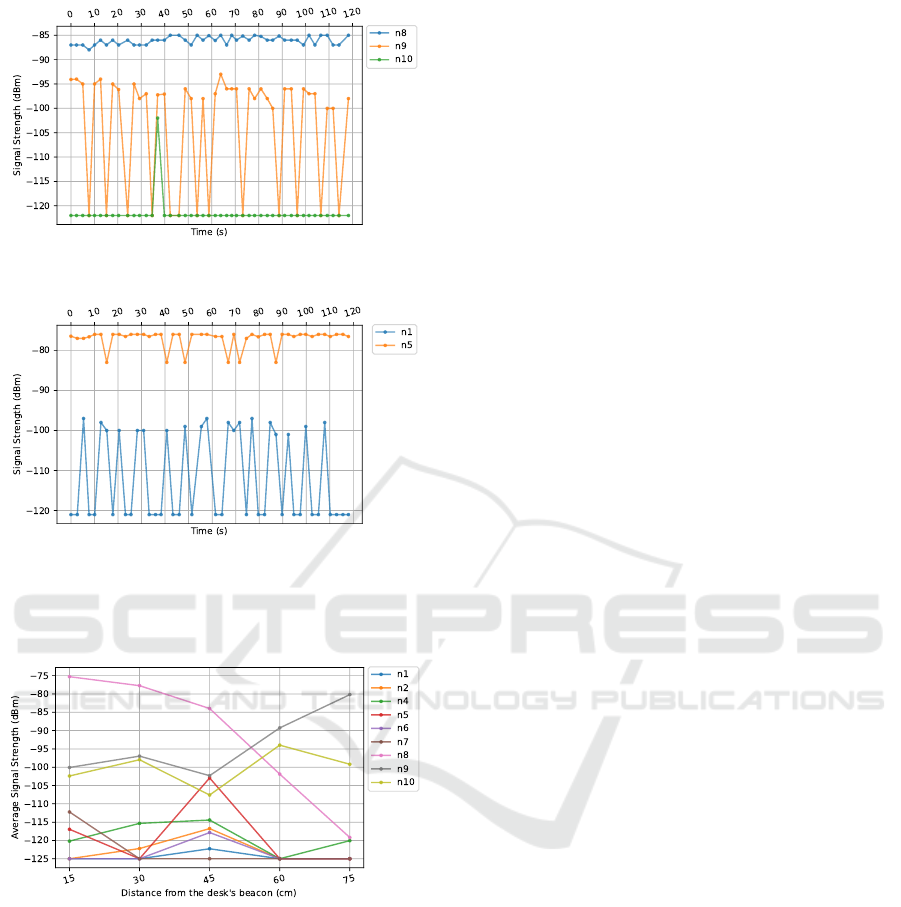
(a) Signals collected at desk n
8
. This represents the worst
scenario found in our test environment.
(b) Signals collected at desk n
5
. This represents the most
common scenario found in our test environment.
Figure 7: Graphs of signal strength from the beacons around
each desk during 120 seconds.
Figure 8: Average of the signal strengths during a 2 minute
measuring period for each detected beacon when varying
the phone’s distance from the desk’s beacon. Values equal
to -125 dBm can be considerate as the nonexistence of sig-
nal.
after finishing the exam.
Taking into consideration the good results of our
study, the benefits of this solution for an examination
scenario could also be transported to a more social
environment, like restaurants, bars, theaters, etc, with
each table/seat having a beacon. This scenario will
offer even more noticeable benefits for contact tracing
and ease of registration.
ACKNOWLEDGEMENTS
This work was supported by the Regensburg Center of
Energy and Resources (RCER) and the Technology-
and Science Network Oberpfalz (TWO). Further in-
formation under www.rcer.de.
REFERENCES
Ahmed, N., Michelin, R. A., Xue, W., Ruj, S., Malaney, R.,
Kanhere, S. S., Seneviratne, A., Hu, W., Janicke, H.,
and Jha, S. K. (2020). A Survey of COVID-19 Contact
Tracing Apps. IEEE Access, 8:134577–134601.
Alhomayani, F. and Mahoor, M. H. (2020). Deep learn-
ing methods for fingerprint-based indoor position-
ing: a review. Journal of Location Based Services,
14(3):129–200.
Altmann, M., Schlegl, P., and Volbert, K. (2017). A low-
power wireless system for energy consumption analy-
sis at mains sockets. EURASIP Journal on Embedded
Systems, 2017(1):8.
Ayyalasomayajula, R., Arun, A., Wu, C., Sharma, S., Sethi,
A. R., Vasisht, D., and Bharadia, D. (2020). Deep
learning based wireless localization for indoor naviga-
tion. In Proceedings of the 26th Annual International
Conference on Mobile Computing and Networking,
pages 1–14, New York, NY, USA. ACM.
Bulten, W., Van Rossum, A. C., and Haselager, W. F. G.
(2016). Human SLAM, Indoor Localisation of De-
vices and Users. In 2016 IEEE First International
Conference on Internet-of-Things Design and Imple-
mentation (IoTDI), pages 211–222. IEEE.
Ciotti, M., Ciccozzi, M., Terrinoni, A., Jiang, W. C., Wang,
C. B., and Bernardini, S. (2020). The COVID-19 pan-
demic. Critical Reviews in Clinical Laboratory Sci-
ences, 57(6):365–388.
Dong, Q. and Dargie, W. (2012). Evaluation of the reli-
ability of RSSI for indoor localization. 2012 Inter-
national Conference on Wireless Communications in
Underground and Confined Areas, ICWCUCA 2012,
pages 12–17.
Eisenman, B. (2015). Learning react native: Building na-
tive mobile apps with JavaScript. ” O’Reilly Media,
Inc.”.
El-Sheimy, N. and Li, Y. (2021). Indoor navigation: state of
the art and future trends. Satellite Navigation, 2(1):7.
Gong, J., Ren, J., and Zhang, Y. (2021). DeepNav: A
scalable and plug-and-play indoor navigation system
based on visual CNN. Peer-to-Peer Networking and
Applications, 14(6):3718–3736.
He, S. and Chan, S.-H. G. (2016). Wi-Fi Fingerprint-Based
Indoor Positioning: Recent Advances and Compar-
isons. IEEE Communications Surveys & Tutorials,
18(1):466–490.
Ikpehai, A., Adebisi, B., Rabie, K. M., Anoh, K., Ande,
R. E., Hammoudeh, M., Gacanin, H., and Mbanaso,
U. M. (2019). Low-Power Wide Area Network Tech-
nologies for Internet-of-Things: A Comparative Re-
SENSORNETS 2022 - 11th International Conference on Sensor Networks
58

view. IEEE Internet of Things Journal, 6(2):2225–
2240.
Kenner, S., Thaler, R., Kucera, M., Volbert, K., and Waas,
T. (2017). Comparison of smart grid architectures for
monitoring and analyzing power grid data via modbus
and rest. EURASIP Journal on Embedded Systems,
2017(1):1–13.
Kenner, S. and Volbert, K. (2016). A low-power, tricky
and very easy to use sensor network gateway archi-
tecture with application example. 10th International
Conference on Sensor Technologies and Applications
(SENSORCOMM 2016).
Klipp, K., Ros
´
e, H., Willaredt, J., Sawade, O., and Radusch,
I. (2018). Rotation-Invariant Magnetic Features for
Inertial Indoor-Localization. IPIN 2018 - 9th Interna-
tional Conference on Indoor Positioning and Indoor
Navigation, pages 1–10.
Laoudias, C., Moreira, A., Kim, S., Lee, S., Wirola, L., and
Fischione, C. (2018). A Survey of Enabling Technolo-
gies for Network Localization, Tracking, and Navi-
gation. IEEE Communications Surveys & Tutorials,
20(4):3607–3644.
Li, J. and Guo, X. (2020). COVID-19 Contact-tracing
Apps: a Survey on the Global Deployment and Chal-
lenges. pages 1–7.
Lukovszki, T., Schindelhauer, C., and Volbert, K. (2006).
Resource efficient maintenance of wireless network
topologies. J. Univers. Comput. Sci., 12(9):1292–
1311.
Luo, J. and Gao, H. (2016). Deep Belief Networks for Fin-
gerprinting Indoor Localization Using Ultrawideband
Technology. International Journal of Distributed Sen-
sor Networks, 12(1):5840916.
Mackey, A., Spachos, P., and Plataniotis, K. N. (2018). En-
hanced indoor navigation system with beacons and
kalman filters. 2018 IEEE Global Conference on Sig-
nal and Information Processing, GlobalSIP 2018 -
Proceedings, pages 947–950.
Masse, M. (2011). REST API Design Rulebook: Design-
ing Consistent RESTful Web Service Interfaces. ”
O’Reilly Media, Inc.”.
Meyer auf der Heide, F., Schindelhauer, C., Volbert, K., and
Gr
¨
unewald, M. (2004). Congestion, dilation, and en-
ergy in radio networks. Theory of Computing Systems,
37(3):343.
Neges, M., Koch, C., K
¨
onig, M., and Abramovici, M.
(2017). Combining visual natural markers and IMU
for improved AR based indoor navigation. Advanced
Engineering Informatics, 31:18–31.
Obe, R. O. and Hsu, L. S. (2017). PostgreSQL: Up and
Running: a Practical Guide to the Advanced Open
Source Database. ” O’Reilly Media, Inc.”.
Schindelhauer, C., Volbert, K., and Ziegler, M. (2007). Ge-
ometric spanners with applications in wireless net-
works. Computational Geometry, 36(3):197–214.
Schwindl, T., Volbert, K., and Schwab, M. (2019). On Up-
date Protocols in Wireless Sensor Networks. In Com-
munications in Computer and Information Science,
volume 1074, pages 74–97.
Spachos, P., Papapanagiotou, I., and Plataniotis, K. N.
(2018). Microlocation for Smart Buildings in the Era
of the Internet of Things: A Survey of Technologies,
Techniques, and Approaches. IEEE Signal Processing
Magazine, 35(5):140–152.
Voron, F. (2021). Building Data Science Applications with
FastAPI: Develop, manage, and deploy efficient ma-
chine learning applications with Python. ”Packt Pub-
lishing ”.
Xiao, J., Wu, K., Yi, Y., Wang, L., and Ni, L. M. (2013).
Pilot: Passive Device-Free Indoor Localization Using
Channel State Information. In 2013 IEEE 33rd Inter-
national Conference on Distributed Computing Sys-
tems, pages 236–245. IEEE.
Zafari, F., Gkelias, A., and Leung, K. K. (2019). A Sur-
vey of Indoor Localization Systems and Technolo-
gies. IEEE Communications Surveys & Tutorials,
21(3):2568–2599.
A Wireless Low-power System for Digital Identification of Examinees (Including Covid-19 Checks)
59
