
Generalized Poincaré Plots Analysis of Cardiac Interbeat Intervals in
Heart Failure
Mirjana M. Platiša
1a
, Nikola N. Radovanović
2b
, Aleksandar Kalauzi
3c
and Siniša Pavlović
2d
1
University of Belgrade, Faculty of Medicine, Institute of Biophysics, 11129 Belgrade, Serbia
2
University of Belgrade, University Clinical Center of Serbia, Pacemaker Center, 11000 Belgrade, Serbia
3
University of Belgrade, Institute for Multidisciplinary Research, Department for Life Sciences, 11000 Belgrade, Serbia
Keywords: Generalized Poincaré Plots Analysis, Lagged Poincaré Plots Analysis, Heart Rate Variability, Heart Failure.
Abstract: In this work we applied generalized Poincaré plots (gPp) analysis of interbeat intervals in patients with heart
failure. More, we compared gPp with its nearest analogy methods based on existing extended Poincaré plots
techniques. Obtained results showed advantages of gPp method over usually used distanced (lagged) Poincaré
plots analysis. Only gPp has the potential of three-dimensional visualization of results with quantification of
new multiscaling parameters. It is comparable with other methods only in two-dimensional planes where all
methods showed a strong negative correlation between patterns of Pearson correlation coefficients and
patterns of the SD1/SD2 ratio over the whole range of Pp orders (lags). These results could be used as the
basis for further research in new standardization of multiscaling methods in heart rhythm analysis where it is
important to follow the pattern of regulatory mechanisms dynamics which is related to the duration of RR
intervals.
1 INTRODUCTION
Analysis of heart rate variability (HRV) is used to
extract important information about the interaction
between the cardiovascular system and the nervous
system. Usually, linear and nonlinear methods of
HRV analysis which revealed the structure and
properties of interbeat interval series are applied with
several main issues. In medicine, dominantly, through
the application as diagnosis of autonomic dysfunction
in various disease and prognostic information
contained in HRV as a reflection of the activity of the
autonomic nervous system and mechanical heart
function. Additionally, other multidisciplinary goals
were to develop new methods which may better
describe dynamics of the cardiovascular system and
help to reveal and understand some important
information about regulatory mechanisms and their
changes in different functions of the autonomic
nervous.
a
https://orcid.org/0000-0002-0915-2823
b
https://orcid.org/0000-0002-6545-2230
c
https://orcid.org/0000-0003-4833-0757
d
https://orcid.org/0000-0002-1395-4407
The standardized Poincaré plot (Pp) is a
representation of a time series into a phase space with
delay or lag of one point i.e. in the case of HRV
analysis each RR interval is plotted as a function of
the previous RR interval. First of all, it presents useful
visual information and it is a part of standardized
methods of HRV analysis. There is also a quantitative
analysis of the Poincaré scattergram by SD1 –
variance of RR intervals in a short scale, SD2 –
variance in a long term scale and their ratio SD1/SD2.
Moreover, the full potential of this approach is
searched through the extension of Pp analysis by
autocovariance concept at higher lags (Lerma et al,
2003, Thakre and Smith, 2006). Standardized
Poincaré plot analysis is one method of HRV analysis
derived from nonlinear dynamics analysis. However,
some indices derived from this approach are strong
correlates to the linear HRV measures derived from
spectral analysis (Contreras et al, 2007).
Recently we proposed a new, generalized Pp
analysis method and applied it to ECG recordings of
Platiša, M., Radovanovi
´
c, N., Kalauzi, A. and Pavlovi
´
c, S.
Generalized Poincaré Plots Analysis of Cardiac Interbeat Intervals in Heart Failure.
DOI: 10.5220/0010912400003123
In Proceedings of the 15th International Joint Conference on Biomedical Engineering Systems and Technologies (BIOSTEC 2022) - Volume 4: BIOSIGNALS, pages 251-256
ISBN: 978-989-758-552-4; ISSN: 2184-4305
Copyright
c
2022 by SCITEPRESS – Science and Technology Publications, Lda. All rights reserved
251
patients with permanent atrial fibrillation (Platiša et
al, 2016), and to ECG recordings of three different
physiological conditions in young healthy trained and
untrained subjects (Platiša et al, 2019b). Contrary to
other lagged (distanced) Poincare plots methods, this
unique method instead RR interval used R peak in
ECG recordings as a referent point for further
analysis. This approach allows us to follow RR
intervals and their duration on both sides of chosen R
peak and calculate correlations between symmetrical
distanced duration of RR intervals and moreover
asymmetrically distanced durations of RR intervals.
There were a lot of results obtained with this gPp
analysis and only part of them indicate possible
interpretation which could be associated with well
known physiological mechanisms, primarily directly
related to the parasympathetic cardiac control.
The aim of this study is twofold. The first one was
to apply gPp method to ECG recordings of heart
failure patients and the second one to compare this
method with the most approximate variants of
extended Poincare plots analyses.
2 METHOD
2.1 Subjects
We included 63 patients with symptomatic heart
failure (HF) and reduced left ventricular ejection
fraction (LVEF < 35%) who had an indication for an
implantable cardioverter-defibrillator or cardiac
resynchronization therapy device implantation.
Patients were divided into two groups depending on
whether they were in sinus rhythm (HFSin) or with
permanent atrial fibrillation (HFAF). In the HFSin
group, we analyzed 30 heart failure patients (5
women) aged 57.9 ± 7.5 years; while in the (HFAF)
33 heart failure patients (3 women) aged 68.0 ± 7.6
years. The control group consists of 30 healthy
middle-aged subjects (15 women) aged 46.3 ± 8.2
years, all were nonsmokers without any history of
disease. All participants were instructed to avoid
physical activity starting the day prior to
measurement and to not eat or drink on the day of the
examination.
2.2 Experimental Data
Measurements were done in the Pacemaker Centre of
the University Clinical Centre Serbia and in the
Laboratory for Biosignals, Institute of Biophysics,
Faculty of Medicine. Ethics Committee of the Faculty
of Medicine, University of Belgrade approved this
study. All subjects gave written informed consent in
accordance with the Declaration of Helsinki.
Experiments were done in the morning between 8:00
and 11:00 a.m.
ECG recordings were obtained from subjects in
the supine position and with spontaneous breathing,
20 minutes in duration (without moving and verbal
communication). The ECG was acquired with
sampling frequency of 1 kHz by Biopac MP100
system with AcqKnowledge 3.9.1. software
(BIOPAC System, Inc., Santa Barbara, CA, USA).
We analysed RR intervals extracted from 20
minutes of supine relaxing ECG recordings.
Sequences of approximately 1200 RR intervals
extracted from ECG data were obtained using
OriginPro 8.6 (OriginLab Corporation, USA).
2.3 Standardized Poincaré Plot
A typical HRV Poincaré plot represents scatter graph
as the function (RR)
i+1
= f((RR)
i
). The two standard
parameters SD1 and SD2, called the Poincaré plot
descriptors, describe the distribution of points around
two diagonals. It is accepted that SD1 describes
instant heartbeat intervals variability and quantifies
short-term HRV, while SD2 quantifies long-term
HRV (Platiša et al, 2019a).
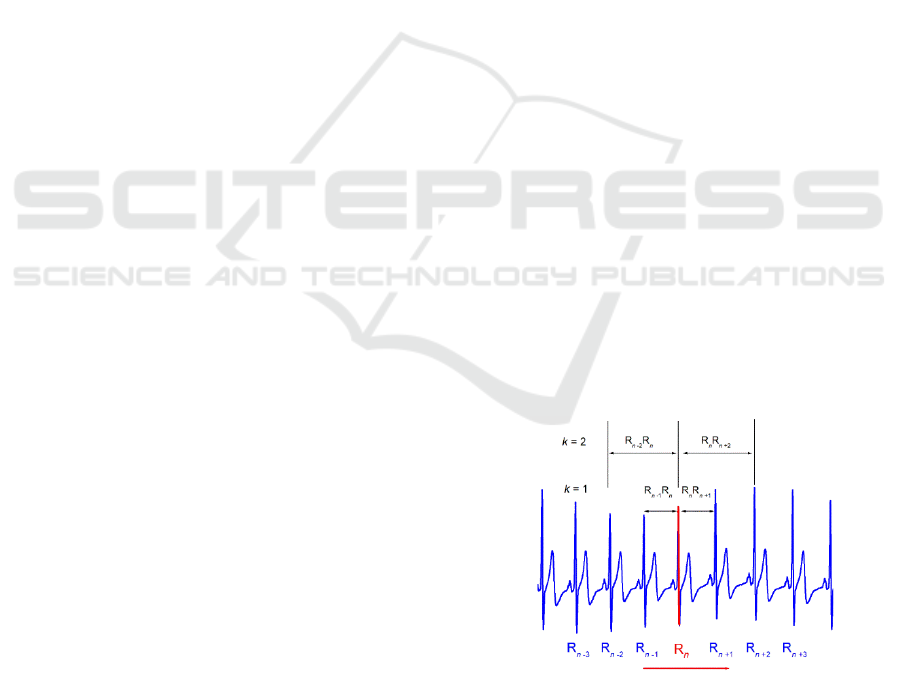
2.4 Generalized Poincaré Plot Analysis
Our recently proposed method is generalized form of
Poincaré plot analysis where we track dependence
and correlation between the duration of j preceding
and k next RR intervals by varying j and k around
chosen R peak in ECG (Platiša et al, 2016, Platiša et
al, 2019b).
Figure 1: Simplified example of chosen sliding R peak in
ECG recording and the duration of k preceding and k next
RR interval.
Both quantities were calculated by simply adding the
durations of the corresponding intervals around a
BIOSIGNALS 2022 - 15th International Conference on Bio-inspired Systems and Signal Processing
252

chosen R wave which was moving along the ECG
signal (Figure 1).
For an ECG signal with a total
number of N RR intervals, only N – j – k points could
be drawn. For results obtained with specific values of
j and k, i.e. for a pair of number of intervals, (j,k), we
propose the term "order of the gPp". In cases when
symmetric (j = k) gPp were calculated, for previous k
and following k intervals in duration, integral
dynamics of interbeat intervals appeared as specific
trajectories in relaxed healthy subjects (Platiša et al.,
2016, Platiša et al., 2019b).
Moreover, in cases when asymmetric (j ≠ k) gPp
were calculated the relationship between previous j
and following k summed intervals give as additional
information about dynamics of cardiac control
mechanisms. In this work we quantified relationship
between summed durations of j previous and k
following consecutive RR intervals by Pearson
correlation coefficients of matrices for j, k = 1, …, 50
intervals, which we briefly denoted as r(j, k). In order
to quantify asymmetry of matrices, we introduce a
normalized asymmetry index (NAI), which for a m×n
type matrix is defined as
m
j
n
jk
kjrjkr
r
nm
NAI
11
),(),(
11
(1)
where r(j,k) represents matrix element, while
m
j
n
k
kjr
nm
r
11
),(
1
(2)
Another interesting property of these Pearson's
matrices was the appearance and positions of local
maxima, since each local maximum of correlation
could potentially signify a temporal range in which a
neurocardiac regulatory mechanism is operating.
All analyses were performed using our original
programs developed within MATLAB (MathWorks
Inc., Natick, MA01760-2098, United States).
2.5 Distanced Generalized Poincaré
Plots Analysis
In order to compare our gPp method with the
published methods of extended Poincaré plot analysis
we used two approaches. The first one is the nearest
analogy to gPp which we called distanced generalized
Poincaré plots (dgPp) method. In this method we
examined relations between individual RR intervals,
the k preceding and the k following RR interval
around chosen R peak in ECG. During calculation we
noticed one important limitation of this approach.
When we increase distance (Pp order) by one, RR
intervals are distanced away for two intervals. Hence,
only even RR intervals are analysed, and odd RR
intervals are omitted.
2.6 Distanced Poincaré Plots Analysis
This approach actually represents lagged (extended)
standardized Poinacre plot analysis which can be
found in published literature. Instead of arbitrary
chosen R peak in ECG signal, in this approach we
started calculation with fixed, the first RR interval in
time series of RR intervals. For k = 1, we track two
neighbor RR intervals in the whole series, for k = 2
we track RR intervals distanced by one RR interval,
etc.
2.7 Statistics
Mann-Whitney U test was used to compare indexes
of asymmetry between the group of healthy subjects
and two groups of HF patients.
The data of NAI are
given as mean values ± standard errors. Statistical
analyses were performed using the software package
SPSS Statistics (version 17.0, SPSS Inc, USA). A
value of p < 0.05 was considered significant.
3 RESULTS
3.1 Generalized Poincaré Plots
Analysis in Heart Failure
In order to present the major difference between
standardized Pp and generalized Pps analysis we
show in Figure 2 examples of standardized Poincaré
plot and generalized Poincaré plots of k order in one
healthy control subject and two heart failure patients
Figure 2: Examples of standardized Pp (top) and gPp for k
= 50 (bottom) of RR intervals for one control subject (blue)
and two subjects with heart failure (with sinus rhythm in red
and with atrial fibrillation in grey).
Generalized Poincaré Plots Analysis of Cardiac Interbeat Intervals in Heart Failure
253
(one with sinus rhythm and one with atrial
fibrillation). In the gPp analysis we denote by k the
order of gPp which means successive sums of RR
intervals, in this paper up to 50.
The presence of hanks in gPp method is one of the
first advantages of this approach. Considering these
with our previous findings, we can conclude that
hanks indicate complex dynamical processes in
autonomic cardiac control dominantly related to
transition pathways of parasympathetic cardiac
control. It is interesting that hanks are also present in
heart failure patient with sinus rhythm although
variability of this time series is reduced compared
with Pp (variability of time series) in healthy control
subject (Figure 2). This finding and finding in heart
failure subject with atrial fibrillation patient where
autonomic cardiac control via sinus node ceased to
exist suggested that non-existence of hanks indicated
absence of parasympathetic cardiac control and that
their existence was not related to heart rate variability.
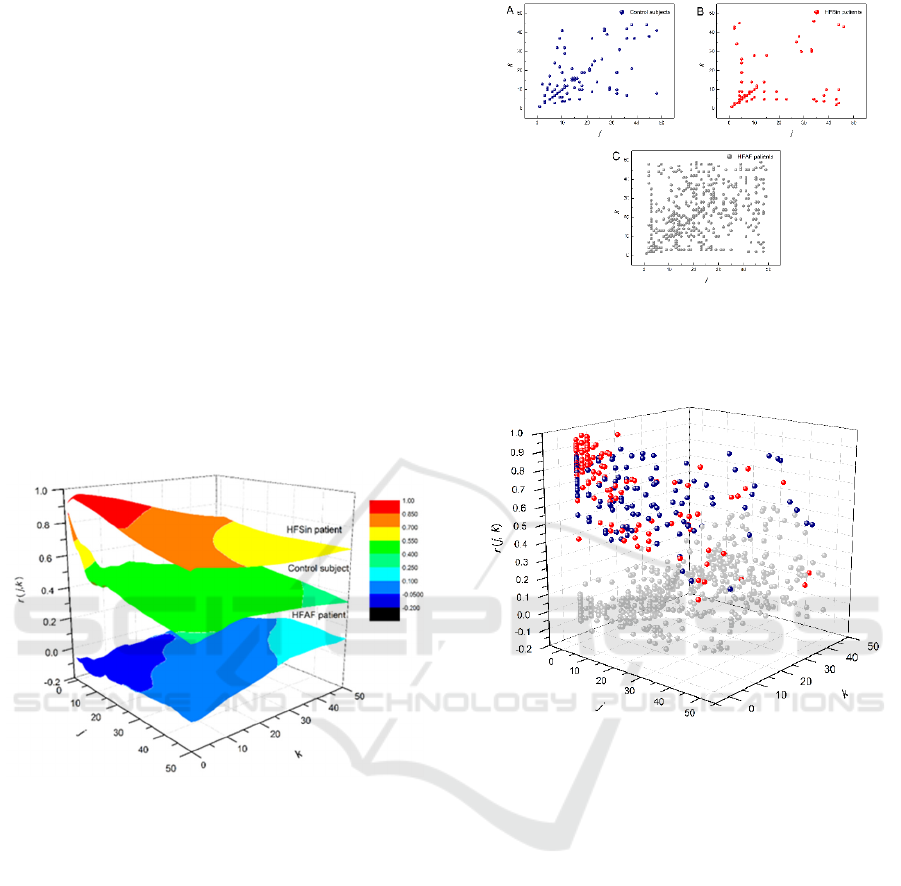
Figure 3: Examples of matrices of Pearson correlation
coefficients for (j, k ≤ 50) in a one control subject and two
heart failure patients.
Further, we calculated matrix of Pearson
correlation coefficients for (j, k = 50) and present
representative examples in Figure 3. The area of
correlation coefficients between summed RR
intervals for heart failure patient with sinus rhythm
was positioned on the top, above the area of
correlation coefficients for healthy subject and the
area of correlation coefficients which belongs to heart
failure patient with atrial fibrillation.
This position which had mild decrease with the
highest order of Pp indicated strongly correlated
summed RR intervals up to the 50
th
order of Pp. On
the other hand, in control subject summed RR
intervals were strongly correlated only in the small
range of few first orders of Pp, while in HFAF patient
Pearson correlation coefficients were reduced over
Figure 4: Pooled local maxima of Pearson’s correlation
coefficients matrices projected on the (j, k) plane in the
group of control subjects (A), in the group of HFSin patients
(B) and in the group of HFAF patients (C).
Figure 5: Distribution of pooled maxima of Pearson’s
correlation coefficients matrices in the group of healthy
subjects (blue), in the group of HFSin patients (red) and in
the group of HFAF patients (grey) plotted in 3D.
the all area. Pooled local maxima of Pearson
correlation matrix in each group were determined and
they are presented in Figure 4 and Figure 5. More, we
determined normalized index of asymmetry (NAI)
and compared their mean values between the groups.
There were statistically significant difference only
between the group of control and the HFSin group
(Figure 6).
BIOSIGNALS 2022 - 15th International Conference on Bio-inspired Systems and Signal Processing
254
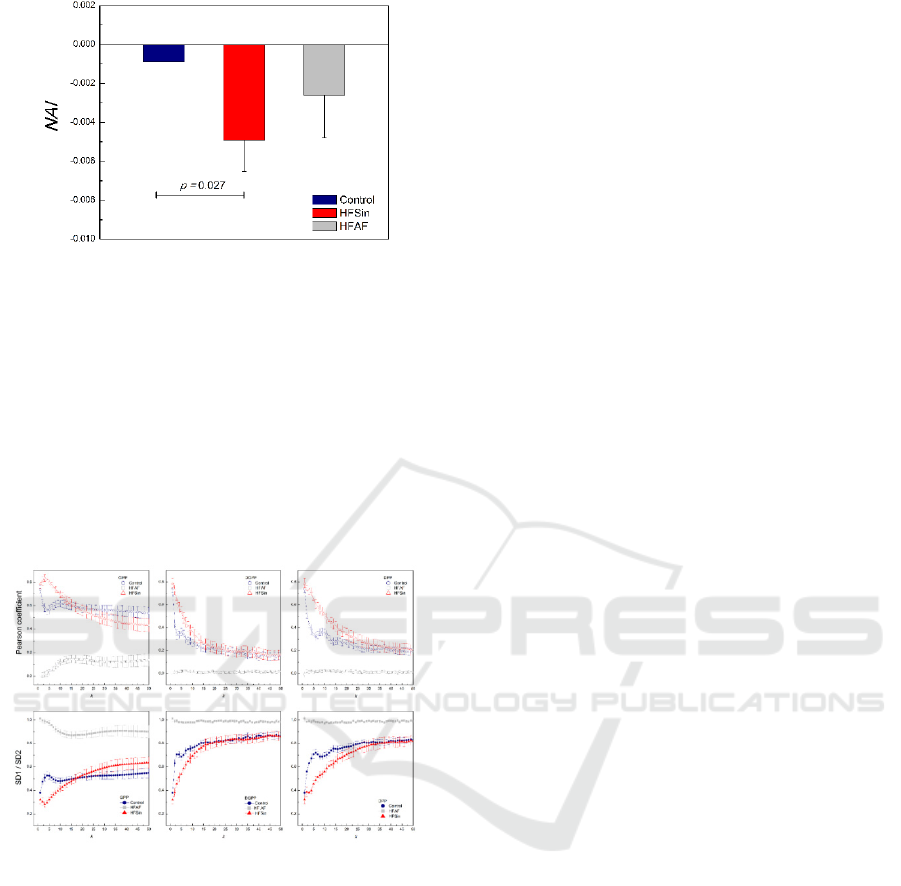
Figure 6: Normalized asymmetry index (NAI). Data are
presented as mean with standard errors.
3.2 Comparisons of gPp with Other
Methods
Unfortunately, nature of the other approaches in Pp
analysis is limited and results were not comparable in
three-dimensional space. Hence, we continued
further analysis in 2D plots only for symmetric (j = k)
diagonals elements of Pearson correlation
coefficients matrices and the SD1/SD2 ratio for all
gPp orders (k = 1 ,…, 50).
Figure 7: Figure shows dependencies of averaged Pearson
correlation coefficient and averaged the ratio SD1/SD2
parameters for all three approaches in the group of control
healthy subjects and the HFSin and the HFAF group.
In results obatined from all methods we found
strong negative correlation between patterns of the
ratio SD1/SD2 and patterns of the Pearson correlation
coefficients over the whole range of Pp orders (Figure
7).
4 DISCUSSION
In this paper, we describe results of applied recently
proposed gPp analysis of RR intervals in heart failure
patients and control subjects. Consistent with
findings in our previous studies, we showed that gPp
analysis can also differentiate heart failure patients
with sinus rhythm and with atrial fibrillation. It is well
known that reduced heart rate variability is one of the
major properties of sinus rhythm in heart failure
patients. Besides this property, approved with
standardized Poincare plot, we showed that the
existence of hanks was not influenced by reduced
HRV in the group of HFSin patients. In our previous
papers we found that activities of parasympathetic
cardiovascular control were described by hanks
(Platiša et al, 2016, Platiša et al, 2019b).
Further, we obtained, from gPp Pearson
coefficient matrix, strong correlations between
summed RR intervals in HFSin patients over all
orders (k = j = 50), while in healthy subjects strong
correlations are present only for few first orders of
summed RR intervals. Beside estimated strength of
correlations i.e. Pearson correlation coefficients we
determined local maxima of Pearson correlation
coefficients and calculated normalized index of
asymmetry (NAI). Positions of local maxima in the
HFSin patients group were more distanced from the
central diagonal while in healthy subjects they are
close to this diagonal and there is much more number
of maxima on the diagonal. In the group of HFAF
patients, we had almost random distribution of local
maxima with very low values of Pearson correlation
coefficients. Similar result we obtained in our
previously published paper (Platiša et al, 2016) where
we analyzed data from patients with permanent atrial
fibrillation but without heart failure. It is obviously
that impact of heart failure in cases with atrial
fibrillation on the gPp analysis results is very low or
almost neglectable.
At this moment, we didn’t recognize any
particular physiological mechanisms related to the
maxima on areas of Pearson correlation coefficients.
They may be related to time scales over which
physiological mechanisms operate via the duration of
summed RR intervals. As additional information, we
captured the integral information from positions of
pooled maxima in each group of subjects and
quantified it by NAI. In both groups of heart failure
patients NAI is more negative than in the control
group but there is a statistically significant difference
only between the HFSin group and the control group.
Furthermore, we show that independently of
Poincaré plot analysis approach, over all orders of Pp
(or of lags), a strong relationship between the pattern
of Pearson coefficients and the pattern of the
SD1/SD2 ratio exited (like an inverted picture in the
mirror).
Generalized Poincaré Plots Analysis of Cardiac Interbeat Intervals in Heart Failure
255

Averaged Pearson correlation coefficients
calculated by gPp just for diametrical, symmetric
cases (j = k), changed with gPp orders and they were
lowest for the HFAF group. It is very interesting that
changes of Pearson correlation coefficients with k
were noticeable up to the 13
th
order of gPp analysis in
all analyzed groups. Similarly, inverted changes can
be seen in dependence of the SD1/SD2 ratio on the
gPp order k. In the control group there is the maxima
for k = 1 and minimal correlations approximately
around 3th or 4th order, while in HFSin group
maxima is at k = 3, and the value of coefficients
between the group are different up to 10
th
gPp order.
These maxima and minima positions probably
revealed times at which operated dominant regulatory
cardiac control mechanisms.
In dgPp analysis, a real analogy technique to the
gPp, we obtained different dependencies of Pearson
coefficients on the k in analyzed groups. As expected,
Pearson coefficients in the HFAF group were close to
zero and the SD1/SD2 ratio around 1. In the HFSin
group, Pearson coefficients monotonically decreased
with k, while in control subjects there were two
maxima in dependence of Pearson coefficients of k (at
k =1 and at k ≈ 5). In simple lagged Pp analysis, which
we called dPp, we obtained similar dependencies of
Pearson coefficients and the SD1/SD2 on lag k as in
dgPp, but they were stretched because in calculation
entered all RR intervals.
5 CONCLUSIONS
In summary, we showed advantages of generalized
Pp analysis which takes referent R peak in ECG
recording instead of referent RR interval in analysis
of heart rhythm. This approach for symmetrical cases
(j = k) revealed interesting patterns of integrated
cardiac control which were not related to the absolute
value of heart rate variability, well-known measure of
autonomic cardiac control. In the extended part of
gPp analysis, when asymmetrically cases (j ≠ k) were
involved, areas of Pearson correlation coefficients
matrices were obtained whose physiological
background needs to be discovered in further work.
REFERENCES
Lerma, C., Infante, O., Pérez-Grovas, H., & José, M. V.
(2003). Poincaré plot indexes of heart rate variability
capture dynamic adaptations after haemodialysis in
chronic renal failure patients. Clinical physiology and
functional imaging, 23(2), 72–80.
Thakre, T. P., & Smith, M. L. (2006). Loss of lag-response
curvilinearity of indices of heart rate variability in
congestive heart failure. BMC cardiovascular
disorders, 6, 27. https://doi.org/10.1186/1471-2261-6-
27.
Contreras, P., Canetti, R., & Migliaro, E. R. (2007).
Correlations between frequency-domain HRV indices
and lagged Poincaré plot width in healthy and diabetic
subjects. Physiological measurement, 28(1), 85–94.
Platiša, M. M., Bojić, T., Pavlović, S. U., Radovanović, N.
N., & Kalauzi, A. (2016). Generalized Poincaré Plots-
A New Method for Evaluation of Regimes in Cardiac
Neural Control in Atrial Fibrillation and Healthy
Subjects. Frontiers in neuroscience, 10, 38.
Platiša, M. M., Radovanović, N. N., Kalauzi, A.,
Milašinović, G., & Pavlović, S. U. (2019a).
Differentiation of Heart Failure Patients by the Ratio of
the Scaling Exponents of Cardiac Interbeat Intervals.
Frontiers in physiology, 10, 570.
Platiša, M. M., Bojić, T., Mazić, S., & Kalauzi, A. (2019b).
Generalized Poincaré plots analysis of heart period
dynamics in different physiological conditions: Trained
vs. untrained men. PloS One, 14(7), e0219281.
Goshvarpour, A., & Goshvarpour, A. (2020). Asymmetry
of lagged Poincare plot in heart rate signals during
meditation. Journal of traditional and complementary
medicine, 11(1), 16–21.
BIOSIGNALS 2022 - 15th International Conference on Bio-inspired Systems and Signal Processing
256
