
Management of Groups of Passengers on Buses Considering the
Restrictions of COVID-19
Francesca Guerriero
a
, Martina Luzzi
b
and Giusy Macrina
c
Department of Mechanical, Energy and Management Engineering, University of Calabria, Italy
Keywords:
COVID-19, Social Distancing, Passenger Transportation, Group Seat Assignment Problem.
Abstract:
During the epidemiological emergency, the measures adopted by the governments to contain the spread of the
virus have caused heavy changes in the passenger transportation sector. In this work, we address the problem
of managing groups of passengers on buses considering COVID-19-related restrictions. We propose a linear
integer programming model to represent mathematically the bus group assignment problem, whose main aim
is to make the best seat-passenger assignment, in such a way that the social distancing constraints, imposed
for containing the spread of COVID-19, are satisfied. The developed formulation, accordingly to the current
Italian rules, considers not only the physical distancing among passengers, but also the possibility to allocate
household groups close to one another. The proposed model is tested empirically considering a real case
study of a bus company operating in Italy. The computational results reveal that our model could help the
transportation company to effectively manage the capacity, improve customer service, and maintain the social
distancing in order to prevent the risk of contagion, by maximizing the revenue.
1 INTRODUCTION
The ongoing global spread of COVID-19, started at
the beginning of 2020, dramatically affects global-
ized societies and economies. All the governments
prompted forceful measures for transmission contain-
ment, causing widespread social and economic dis-
ruptions. In this paper, we focus on the passengers
transportation service, more specifically on buses sec-
tor, considering the pandemic restrictions related to
the physical distancing. The report “Observatory on
mobility trends during the COVID-19 health emer-
gency”, drawn up by the Mission Technical Struc-
ture for the strategic direction, infrastructure devel-
opment and High Surveillance of the Italian Ministry
of Infrastructure and Transport (MIT), shows that, in
Italy, the journeys made through collective transporta-
tion services have undergone a more marked reduc-
tion compared to private/individual road transporta-
tion, reaching reductions even higher than 90% in
the period March-April 2020 compared to the pre-
COVID-19 period.
The second wave of spread of the virus and the
a
https://orcid.org/0000-0002-3887-1317
b
https://orcid.org/0000-0001-9193-4332
c
https://orcid.org/0000-0001-6762-3622
consequent restrictive mobility policies have pro-
duced less marked effects on collective transporta-
tion than those observed during the first lockdown,
with maximum reductions of 60%. In particular,
high-speed rail journeys underwent a reduction of
up to almost 100% in the period March-April 2020.
This drastic peak was also recorded, in addition to
the restrictive measures adopted, in the face of a re-
duction in the offered services by more than 95%.
Movements on maritime services, instead, suffered a
slightly different reduction in passenger demand com-
pared to that observed for land services, with losses
that amounted to around 90-100% in the period April-
May 2020, and then began to grow, while still show-
ing a significant reduction (about 20%) in passenger
demand in July 2020. Finally, travel on air services
has undergone a 99% reduction in both demand and
supply, which has started in March 2020 and reached
a minimum in the period April-May 2020, and then
slightly has begun to grow. On March 20, 2020, the
Italian shared regulatory protocol was adopted for the
containment of the spread of COVID-19 in the trans-
portation and logistics sector.
In the protocol, distance, protections and sanita-
tion become imperative indications for the safe use of
mobility services. The rules of distancing that regu-
late the “how to sit” on the various transportation vec-
Guerriero, F., Luzzi, M. and Macrina, G.
Management of Groups of Passengers on Buses Considering the Restrictions of COVID-19.
DOI: 10.5220/0010911300003117
In Proceedings of the 11th International Conference on Operations Research and Enterprise Systems (ICORES 2022), pages 67-76
ISBN: 978-989-758-548-7; ISSN: 2184-4372
Copyright
c
2022 by SCITEPRESS – Science and Technology Publications, Lda. All rights reserved
67

tors are rigid, just because they could represent a vehi-
cle of contagion. Making collective passengers trans-
portation safe and acceptable is the main goal of all
the governments as well as of the transportation com-
panies. Proposing flexible but effective solution for
managing the available seats on a vehicle, consider-
ing physical distancing, guaranteeing the safety of the
travellers and the containment of virus spread is cru-
cial. However, an inadequate allocation of passengers
may lead to an additional loss of revenues. Our main
goal is to propose an effective strategy that, on the one
hand, guarantees travellers safety, on the other one,
maximizes the revenues as much as possible. In par-
ticular, we propose a linear integer programming for-
mulation to represent the bus group assignment prob-
lem (BGAP, for short). The main aim is to manage the
bus capacity (i.e., available seats), by maximizing the
revenue and considering COVID-19 social distance
restrictions. The rest of the paper is structured as fol-
lows: Section 2 describes the state-of-art on passenger
transportation in the pandemic era and focuses on the
limitations and rules imposed in Italy on the collective
transportation. Section 3 presents a linear integer pro-
gramming formulation for the BGAP under COVID-
19 social distance in the case of bus passengers trans-
portation service. Computational experiments are dis-
cussed in Section 4, while Section 5 summarizes the
conclusions.
2 PASSENGER
TRANSPORTATION IN THE
PANDEMIC ERA
In this section, we firstly discuss briefly about pas-
senger transportation, highlighting the importance of
this sector. Secondly, we focus on the impacts of
the Covid-19 pandemic on the collective passenger
transportation, by analyzing several scientific contri-
butions.
2.1 Passenger Transportation
Collective transportation provides everyone with per-
sonal mobility, giving each person the possibility to
perform his/her daily activities, such as accessing to
employment, schools, medical care, and community
resources, as well as his/her occasional ones, such
as reaching vacation spots. Collective transportation,
public or private, may include buses, trains, under-
ground rail systems, airplanes and also cars in the
context of sharing services (Ferrero et al., 2018).
Each type of transportation vector has its specific fea-
tures, for example, an airplane is faster than a bus,
however it is also more expensive. In general, among
the key factors that influence customers choice be-
tween alternative transportation modes, there are the
travel time, the cost and the convenience (Hancocka
et al., 2021). Another important aspect that influ-
ences customers choice is the environmental sustain-
ability. Recent surveys, as the one carried by the
booking platform Omio (www.Omio.it), show that
potential customers prefer to select transportation so-
lutions, characterized by low emissions and small car-
bon footprint.
Collective mobility is central to the whole society,
hence, offering efficient and effective services to cus-
tomers is a critical aspect for all companies operating
in this sector. To pursue this goal, it is important man-
aging the available and limited resources avoiding any
type of waste. Thus, finding methods that allow to op-
timize the capacity of the transportation vectors, try-
ing to maximize the revenue from the sold tickets, is a
very discussed topic. In fact, numerous authors have
already addressed it in the past, see, e.g., (Lin et al.,
2020; Wang et al., 2018; Ongprasert, 2006); however,
it still represents a challenge for researchers, scholars
and companies.
2.2 Consequences of the Pandemic on
Transportation
In the last two years, the pandemic has contributed
to increase the difficulties of managing capacity of
transportation vectors. The new regulations, imposed
to contain and stop the spread of infections on trans-
portation vectors, are configured as additional con-
straints that must be taken into account when manag-
ing the capacity. Indeed, the rules of social distancing
lead to a reduction of the bookable seats and, conse-
quently, to a lower possibility of obtaining revenues
deriving from the sales of tickets. Figure 1 shows the
configuration that must be adopted by bus following
the social distancing rules. The capacity limitation
imposes that the seats adjacent to the one occupied
by a passenger are forbidden, and therefore cannot be
used to allocate other travelers.
For this reason, developing models that optimally
manage the allocation of passengers on transporta-
tion vectors, maximizing sales and consequently the
revenues, and respecting the distancing constraints is
a current challenge for both the scientific research
and the service providers operating in the passenger
transportation sector. Although the reference context
is new and constantly evolving, several authors have
already addressed this topic under different perspec-
tives and application fields. (Fischetti et al., 2021)
ICORES 2022 - 11th International Conference on Operations Research and Enterprise Systems
68
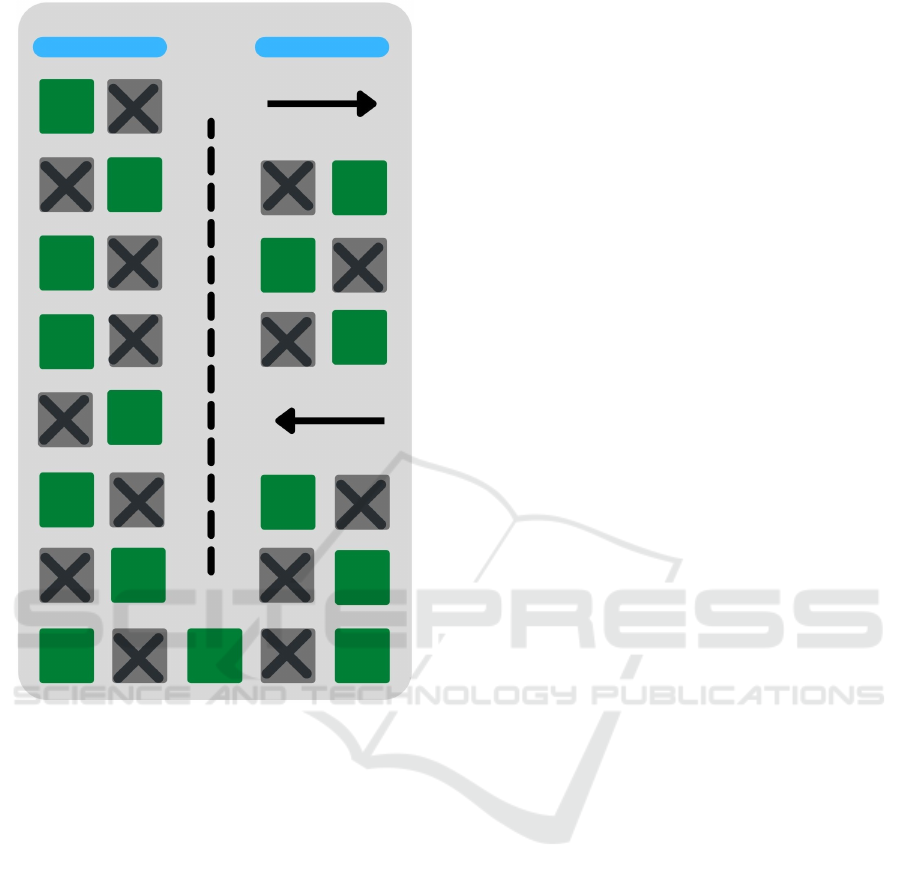
Figure 1: Layout and limitations of capacity on buses. The
green squares represent the bookable seats; while crossed
gray squares the forbidden seats, hence the not bookable
ones.
study the problem of locating facilities in a given
area, subject to social distancing constraints. The goal
is to maximize the area utilization, as well as min-
imize the overall virus spread among facilities, fol-
lowing the social distancing rules. They analyze the
similarities between this problem and that of locat-
ing wind turbines in an offshore area. In fact, sim-
ilarly to people who can infect each other, also tur-
bines located close to one another may to “infect”
each other by casting wind shadows (the so-called
“wake effect”), that cause production losses. The dis-
covery of this parallelism allows the authors to ap-
ply mathematical optimization algorithms originally
designed for wind farms, to produce optimized facil-
ity layouts, that minimize the overall risk of infec-
tion among customers. The results of the research
show that in the structure of the safest layouts, the
facilities are not equally distanced (as it is typically
believed), but a policy, that significantly reduces the
overall risk of contagion, tends to concentrate the fa-
cilities on the border of the available area. (Barry
et al., 2021) consider a space allocation problem, that
incorporates social distancing constraints, while opti-
mising the number of available safe work-spaces, in
an on-site working scenario. The solution approach
is based on a bipartite graph of disconnected compo-
nents over a graph of constraints. The obtained results
are compared to a constrained random walk heuristic
and a linear programming approach. A few contri-
butions focused on the field of collective passengers
transportation. (Salari R. et al., 2020) address the air-
plane passengers seat assignment problem, while en-
suring social distancing among passengers. The au-
thors propose a mixed integer integer programming
model to assign passengers to seats on an airplane,
such that two types of social distancing constraints
are satisfied. The first type refers to passengers being
seated far enough away from each other. The metric
for this type of social distancing is how many passen-
gers are seated so close to each other as to increase the
risk of infection. The second one refers to the initial
model to determine seat assignments, that maximize
distance between seat assignments and the aisle. This
distance influences the health risk involved in pas-
sengers and crew members walking down the aisle.
Corresponding metrics for both passengers and crew
members health risks are included in the objective
function. The authors also provide an additional ver-
sion of the initial model, in order to determine the seat
assignments, that maximize the number of passengers
boarding an airplane while practicing social distanc-
ing among passengers. The study of (Gkiotsalitis and
De Weert, 2021) introduces a mixed-integer quadratic
program that sets the optimal frequencies of public
transportation lines and sub-lines, in order to conform
with the pandemic-imposed capacity restrictions. The
so called frequency setting model is tested on a net-
work containing high-demand bus lines and it demon-
strates that the revenue losses due to social distancing
can be reduced when implementing short-turning ser-
vice patterns. (Gongyu et al., 2021) redesign routes
and bus schedules for University of Michigan’s cam-
pus bus system, during the COVID-19 pandemic, with
the aim to balance individuals safety and operational
efficiency. In particular, they propose a hub-and-
spoke design and utilize real data of student activ-
ities to identify hub locations and bus stops to be
used in the new routes. (Moore et al., 2021) study
the seat assignments with physical distancing in pub-
lic transit considering a mixed-integer programming
model defined to assign passengers to seats based on
the specific configuration of the vehicle and desired
physical distancing requirement. They also develop a
Management of Groups of Passengers on Buses Considering the Restrictions of COVID-19
69

”household grouping heuristic” that allows household
members to seats near to each other without respect-
ing social distancing, and show that the proposed ap-
proach increases the capacity of the transit vehicles
(e.g., airplanes, school buses, and trains) without in-
creasing the risk of infection. The ongoing pandemic
of COVID-19 and the constant change of rules to ar-
rest the spread of the virus have been a high impact
on transportation sector. Providing flexible models
to manage the capacity during these sudden events is
crucial for avoiding the service disruption. The ma-
jority of the reviewed works, focused on social dis-
tancing, hence on the reduction of the capacity of the
vehicles. However, only one work, i.e., (Moore et al.,
2021), considers the possibility to allocate household
groups on adjacent seats. In our work we focus on
this particular strategy, currently adopted in bus pas-
senger transportation. For this type of transport, in
fact, the current Italian rule establishes that the use of
adjacent seats is limited exclusively to cohabiting pas-
sengers in the same housing unit, as well as between
relatives and people who have stable interpersonal re-
lationships. It is clear that this possibility could lead
to a potential increase in the capacity of the vehicle
(i.e., number of allocable seats), and consequently an
increase in the number of sold tickets, hence to obtain
additional revenues. Our work present some similar-
ities with (Moore et al., 2021), in fact, they consider
the allocation of groups of people on a bus. How-
ever, the main difference is that (Moore et al., 2021)
consider a single-destination transportation service,
in our work, instead, we consider more lines and a
multi origin-destination scenario. In addition, (Moore
et al., 2021) propose a heuristic approach to allocate
the groups, while in our work we propose a mathe-
matical model to handle the problem.
3 A LINEAR PROGRAMMING
MODEL FOR GROUPS
ASSIGNMENT PROBLEM
UNDER COVID-19
RESTRICTIONS
We propose a mathematical model for managing dif-
ferent sized kin groups of passengers on the buses, re-
specting the social distancing limitations imposed by
the Italian government rule reported in the previous
section. The proposed model is an extension of the
BSAP (Bus Seat Assignment Problem) formulation
defined by (Guerriero et al., 2020). As in (Guerriero
et al., 2020), we consider a passenger transportation
company that offers a transportation service from a
given set of origins to a given set of destinations. The
company sells a set of products to several groups of
customers on a given time horizon. Each product is
an origin-destination (OD) transportation service per-
formed by a bus. At each time of the planning hori-
zon, the company has to decide how to manage the
overall capacity in the most profitable way.
Let E = {e
1
, . . . , e
n
} denote the set of n origins
and F = { f
1
, . . . , f
q
} the set of q destinations. A
generic product is denoted as the pair {(e, f ) : f >
e, e ∈ E, f ∈ F} and represents the OD transportation
service from the bus station e to the bus station f .
All the products are sorted in increasing order of the
origin bus station and stored in the set (EF), that is
(EF) = (e
1
, f
1
), . . . , (e
1
, f
q
), (e
2
, f
1
), . . . , (e
n
, f
q
). The
products offered by the company can be indexed as
p = (1, . . . , |(EF)|). We assume that the company per-
forms the transportation service using a set of buses,
each of them characterized by a given number of rows
i = 1, . . . m, each row is composed by a certain num-
ber of seats denoted by l. In addition, we also assume
that every bus has the same number of seats on each
row. The number of seats per each row multiplied by
the number of rows of the bus represents the seating
capacity of the bus. The buses have t lines, t = 1, . . . T
and C
t
is the capacity of line t that is the seating ca-
pacity of the bus, which runs on the line t. Each line t
consists of a given number of stops denoted as S
t
+ 1
including the starting and the terminal bus stations
and S
t
legs between each two bus stations. All the
products (i.e., OD transportation service) produced by
each line t, t = 1, . . . , T are stored in a sequence ac-
cording to the incremental order of f and e, that is
(EF)
t
= (1, 2)
t
, . . . , (1, S
t
+ 1)
t
, (2, 3), . . . , (S
t
, S
t
+ 1).
After numbering all the products in (EF)
t
from left to
right, we can get the product sequence indexed by the
serial number p
t
= (1, . . . , |(EF)
t
|). Let H
t
= h
t
sp
t
, s =
1, . . . , S
t
, p
t
= 1 . . . , |(EF)
t
| denote a binary matrix,
each element being equal to 1 if product p
t
generated
by the line t uses leg s and zero otherwise. Each col-
umn of matrix H
t
contains all the information related
to the legs involved in the OD transportation services
provided by the line t. An example of matrix H
t
for a
line with S
t
= 5 stops and 10 products is reported in
Figure 2.
Product
Leg (1,2) (1,3) (1,4) (1,5) (2,3) (2,4) (2,5) (3,4) (3,5) (4,5)
(1, 2) 1 1 1 1 0 0 0 0 0 0
(2, 3) 0 1 1 1 1 1 1 0 0 0
(3, 4) 0 0 1 1 0 1 1 1 1 0
(4, 5) 0 0 0 1 0 0 1 0 1 1
Figure 2: Representation of of the matrix B, for a line with
5 stops and 10 products.
We assume that different lines can deliver the
same OD transportation service from e to f , that is
ICORES 2022 - 11th International Conference on Operations Research and Enterprise Systems
70
alternative products are available. Thus, in order to
handle this specific situation, a binary parameter γ
t
p
is
introduced to denote the relationship between product
p and line t. In particular, γ
t
p
= 1, if the transporta-
tion service p can be delivered by the line t, that is
(e, f ) ∈ (EF)
t
, and zero otherwise. Time is discrete,
and at each time period of the booking horizon, the
company has to decide on accepting/denying the re-
quest of a group of customers asking for a product p,
that is an OD transportation service. The capacity of
the system depends not only on the number of avail-
able seats for each row of a given line t = 1, . . . , T
but also by the size of the passenger group k with
k = 1, . . . , K, that is assigned to the considered row.
In fact, considering the restrictions in terms of social
distancing between people that are not kin, we can
allocate different types of groups on each row, with
various configurations. Let’s suppose that each row
of the bus contains 4 individual seats. In this case,
the possible assignment configurations for each row,
depending of the group size, are the following:
• a kin group of 4 people,
• a kin group of 3 people,
• 2 groups of 2 people,
• 2 groups of 1 person,
• 1 kin group of 2 people and 1 single passenger.
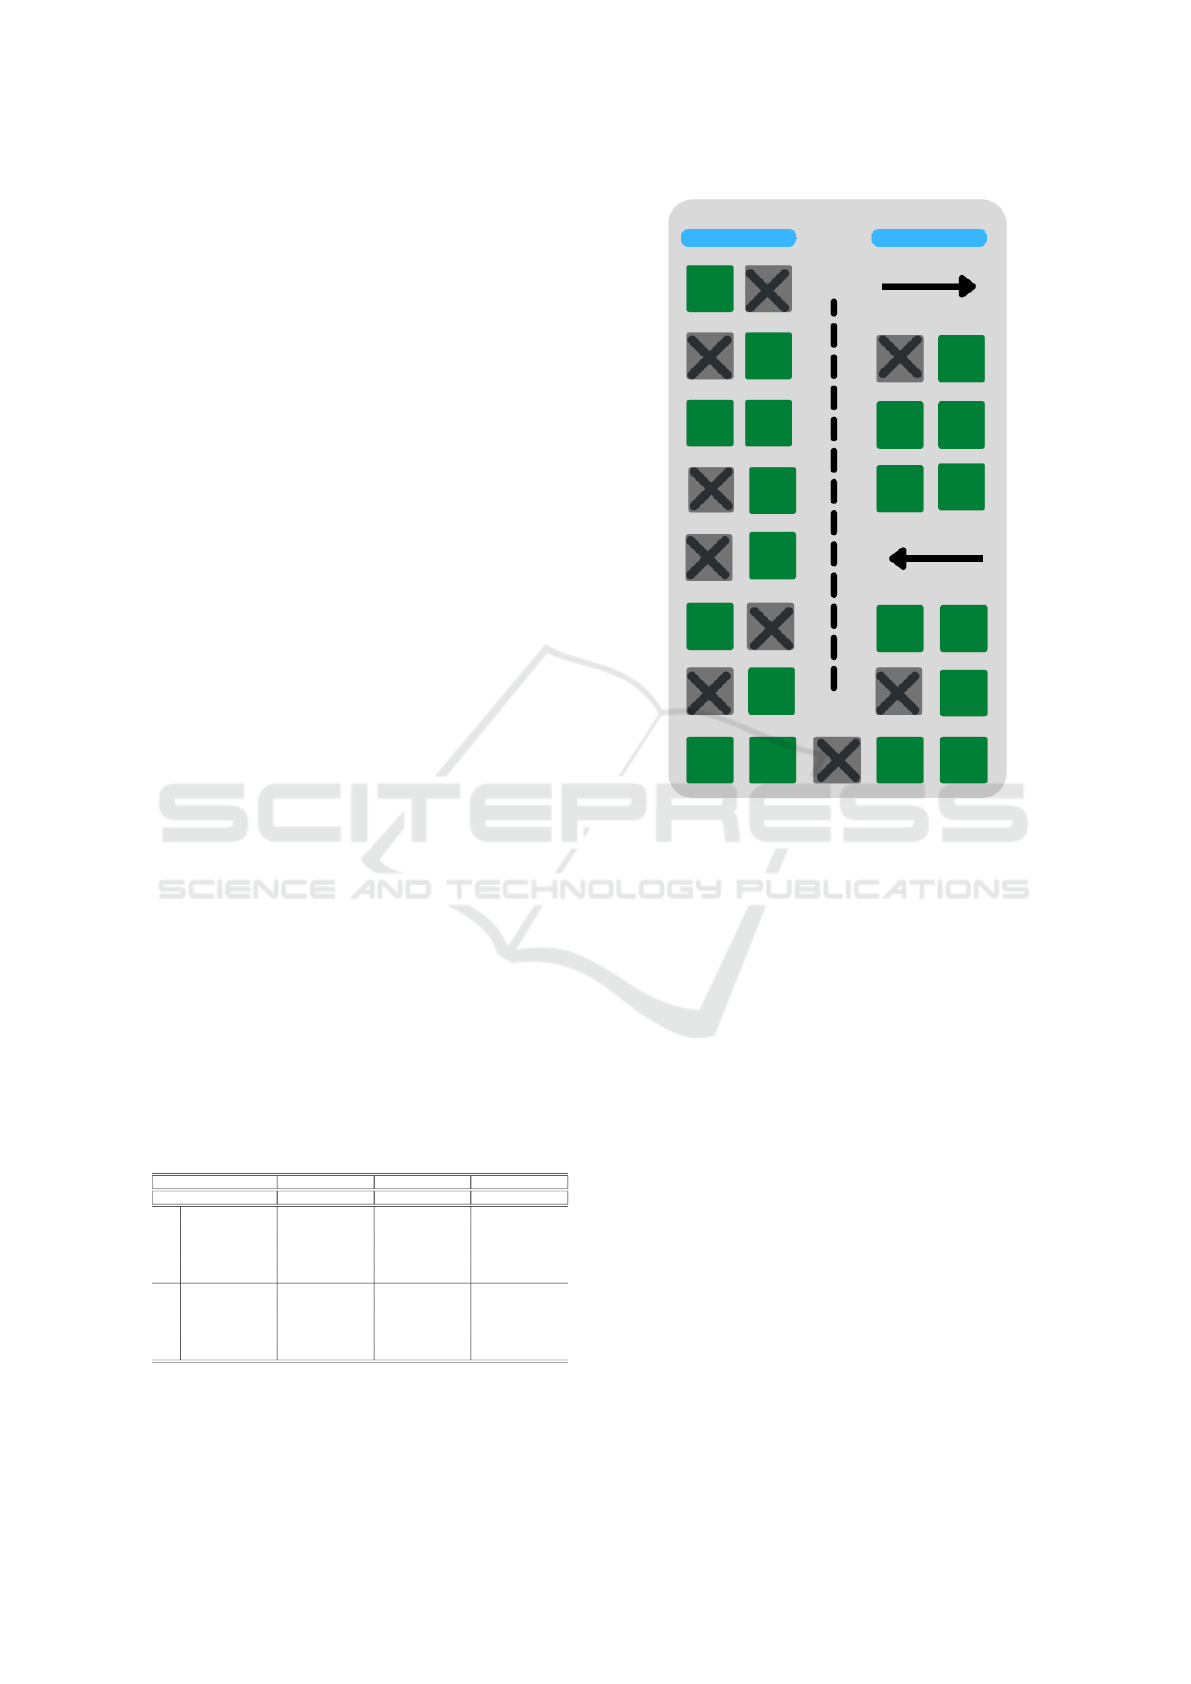
Figure 3 represents an example of a layout configu-
ration considering the limitation of capacity and the
allocation of the groups. To model all the possi-
ble configurations, we introduce the matrix B, whose
single element, denoted by b
t
i j
, represents the num-
ber of seats, including those required to ensure the
satisfaction of social distancing rule, used to allo-
cate on the row i of the line t a group of k people,
j = (k − 1)m + 1, . . . , km. A representation of the ma-
trix B, for the considered scenario, is given in Table 1,
in which the matrix B is built by considering 2 lines
t = 1, 2 and four group sizes k = 1, 2, 3, 4.
Table 1: Example of matrix B.
k=1 k=2 k=3 k=4
m m m m
2 0 0 ... 0 2 0 0 ... 0 4 0 0 ... 0 4 0 0 ... 0
t=1 0 2 0 ... 0 0 2 0 ... 0 0 4 0 ... 0 0 4 0 ... 0
0 0 2 ... 0 0 0 2 ... 0 0 0 4 ... 0 0 0 4 ... 0
m . . . .
. . . .
0 0 0 ... 2 0 0 0 ... 2 0 0 0 ... 4 0 0 0 ... 4
2 0 0 ... 0 2 0 0 ... 0 4 0 0 ... 0 4 0 0 ... 0
t=2 0 2 0 ... 0 0 2 0 ... 0 0 4 0 ... 0 0 4 0 ... 0
0 0 2 ... 0 0 0 2 ... 0 0 0 4 ... 0 0 0 4 ... 0
m . . . .
. . . .
0 0 0 ... 2 0 0 0 ... 2 0 0 0 ... 4 0 0 0 ... 4
The main goal is to maximize the total revenue
obtained from the accepted requests of a group of size
k for the product p on the booking horizon. Moreover,
Figure 3: Example of a bus layout configuration consider-
ing the limitations of capacity and the allocation of kin’s
groups. The green squares represent the occupied seats;
while crossed gray squares the forbidden seats. In partic-
ular, from the top (first line) to the bottom (octave line): a
group of one person, two groups of one person, a group of
four people, a group of three people, a group of one per-
son, a group of one person and a group of two people, two
groups of one person, two groups of two people.
it is assumed that booking requests made for groups
with k greater than one cannot be partially accepted.
A summary of the parameters and the variables of
the model is presented in what follows:
• R
k
p
the revenue associated to the product p for a
group of size k;
• d
k
p
the number of request for a product p made by
a group of size k;
• q the number of seats available on each row of the
buses;
• γ
t
p
, p = 1, . . . , |(EF)|, equal to 1 if the product p
can be delivered by using the line t and zero oth-
erwise;
• h
t
sp
t
, s = 1, . . . , S
t
, p
t
= 1 . . . , |(EF)
t
| equal to 1 if
the leg s is used in the product p
t
and zero oth-
erwise. h
t
sp
t
is an element of the matrix H intro-
duced above;
Management of Groups of Passengers on Buses Considering the Restrictions of COVID-19
71

• b
t
i j
represents the number of seats used to allocate,
on the row i of the line t, a group of k people,
j = (k − 1)m + 1, . . . , km. b
t
i j
is an element of the
matrix B introduced above;
• x
pt
j
integer variables representing the number of
satisfied requests for the product p by the line t.
The BGAP under COVID-19 social distancing
rules is formulated as follows.
Max
|(EF)|
∑
p=1
∑
t∈T
∑
j=(k−1)m+1,...,k m
γ
t
p
x
pt
j
∑
k∈K
R
k
p
(1)
T
∑
t=1
∑
j=(k−1)m+1,...,k m
γ
t
p
x
pt
j
≤ d
k
p
p = 1, . . . , |(IJ)| , k = 1, ..., K (2)
|(EF)
t
|
∑
p
t
=1
∑
j=1,...,km
|(EF)|
∑
p=1
h
t
sp
t
γ
t
p
b
t
i j
x
pt
j
≤ q t = 1, . . . , T, s = 1, . . . , S
t
(3)
i = 1, ..., m
x
pt
j
≥ 0, integer p = 1, . . . , |(IJ)|, t = 1, . . . , T, j = 1, ..., km (4)
The objective function 1 represents the total rev-
enue obtainable. Equations 2 represent the demand
constraints and state that the demand for a product
p (transportation service) for a group of size k can
be satisfied with all the products generated by all
the lines t,t = 1, ..., T , that can deliver the consid-
ered transportation service. Equations 3 represent the
capacity constraints and they assure both the respect
of the social distance between different sized groups
and the right allocation of capacity on the rows of the
lines. Finally, constraints 4 define the variables do-
main.
Clearly, this model could be easily extended to any
type of transportation vector, by opportunely chang-
ing the capacity constraints considering the specific
features of the vector.
4 COMPUTATIONAL
EXPERIMENTS
In this section, we describe the computational results
collected to validate the proposed model. We used the
software AIMMS 4.75.3.6 and the commercial solver
Cplex 10.1, on an Intel Core i7-8565U CPU, 1.8 GHz,
8 GB of RAM.
The experimentation is divided into two main
parts: the first one is aimed to assess the behaviour of
the proposed model in terms of solution quality; the
second one is devoted to investigate the performance
of the model in terms of scalability. The instances
used in the first part of the computational study are
based on real data derived from www.simetbus.it: the
web site of a bus company operating in the south of
Italy, that is the Simet S.p.A.. Each instance is char-
acterized by a certain number of inter-regional lines,
with a capacity of 52 seats. In particular, the lay-
out of the bus operating a certain line is composed
of 13 rows, each of which is made by 4 seats. In addi-
tion, every line is composed of a given set of origin-
destination products. A different fare is associated to
each OD product for a group of size k. We consider
4 possible types of groups. In particular, a group can
be composed from a minimum of one person (a single
passenger) to a maximum of 4 people. In Table 2 we
reported the three lines considered for our tests, taken
from the Simet S.p.A. website.
Table 2: Characteristics of Instances: Lines and OD prod-
ucts.
Line1 Line2 Line3
origin destination origin destination origin destination
1 6 1 5 1 6
2 6 2 5 2 6
3 6 3 5 3 6
4 6 4 5 4 6
1 6 1 7
2 6 2 7
3 6 3 7
4 6 4 7
5 6 6 7
Looking at Table 2, the three lines and 7 cities
(origin or destination) numbered in ascending order
are reported on the columns. Each line is character-
ized by a set of OD products, depicted on each row of
each line. In particular, the Line1 has 4 OD products
with different origins but the same destination (i.e.,
6). Line 2 and Line 3 are composed of 9 OD prod-
ucts. In addition, we may notice that the lines have
in common some rides. For example, the product 1-6
is present in all the lines; hence, departing from the
origin 1, it is possible to reach the destination 6 by
using all the three lines. Regarding the legs, we may
say that the Line 1 has 4 legs, Line 2 is composed
of 5 legs, while Line 3 of 5 legs. The demand value
for each ride is randomly estimated. In the computa-
tional study we compare the results obtained by allo-
cating the customers using the proposed BGAP, with
two other seat allocation policies. In particular, in
the first policy we consider a FIFO strategy in which
the demand of groups is allocated following the ar-
rival order, respecting social distance but without any
type of optimization. The second policy, named ”NO
GROUP”, consists in a strategy that does not consider
the possibility to allocate two or more relatives close
to one another. Table 3 summarizes the results. In
particular, the second, third and fourth columns report
the three strategies used to allocate passengers (i.e.,
solving the BGAP model, the FIFO strategy and the
NO GROUP strategy, respectively). On the rows, for
ICORES 2022 - 11th International Conference on Operations Research and Enterprise Systems
72
each strategy, we report the total revenues, expressed
in euro, the available seats, the occupied seats, the in-
terdicted seats (i.e., the number of seats that cannot be
occupied for maintaining the social distancing), and
the unoccupied seats (i.e., seats that remain empty be-
cause they can not satisfy the demand that arrives for
certain OD products).
Table 3: Computational results: BGAP vs FIFO vs NO
GROUP.
BGAP FIFO NO GROUP
Total Revenue 2.036,00 1.707,00 1.115,00
Available seats 156 156 156
Occupied seats 139 117 78
Interdicted seats 35 21 78
Unoccupied seats 0 18 0
The values, reported in Table 3, clearly show that
the highest value of revenue is obtained by applying
the BGAP model. Thus, the BGAP strategy is the
most effective compared with the FIFO and the NO
GROUP approaches. In particular, the BGAP model
leads to an increase in the revenue, over the other
two strategies, of about the 19.3% and 82.6%, respec-
tively. In addition, we can notice that BGAP ensures
the highest number of occupied seats and the lowest
number of interdicted seats compared with FIFO and
NO GROUP. Using the BGAP model to allocate the
passengers, the value of the occupied seats is 18.8%
and 78.2% higher than the FIFO and NO GROUP
approach, respectively. Thus the BGAP model al-
lows an effective management of the capacity. It it
worth noting that the sum of the values associated
with “Occupied seats”, “Interdicted seats” and “Un-
occupied seats” do not always correspond to the value
of “Available seats”.
This can be easily explained by taking into ac-
count that we have considered lines, characterized by
several stops, in correspondence of which passengers
can get on and off the vehicle. This means that some
seats could be interdicted and/or occupied more than
one time and, hence, counted more than once as occu-
pied or interdicted seats. To better clarify this issue,
let’s consider the stop 5 of the line 2 defined in the
Table 2. At this stop all passengers whose destina-
tion is 5 get off, while those who must go from 5 to 6
get on. Consequently, the seats occupied by the pas-
sengers who get off at stop 5 become available and
thus they can be occupied again by passengers who
get on the bus at stop 5 to reach destination 6. Thus,
the same seat could be occupied by a passenger over
a leg and interdicted over another leg according to the
size of groups allocated on the row in which the seat
is located. In fact, as we can see in the second col-
umn of the Table 3, the sum of “Occupied seats” and
“Interdicted seats” is higher than the value associated
to the “Available seats”. Moreover, solving the model
does not require high computational time, about 0.02
second on average, hence it is also efficient.
In the second part of the computational study,
aimed at evaluating the scalability of the proposed
model, we consider a set of randomly generated in-
stances of increasing size.
Table 4 provides, for each test problem, the number of
lines, the number of legs and the number of products.
For example, instance T 10 1 refers to a bus network
characterized by 10 lines, each line has 5 legs, and
5 available OD products. For each instance, demand
and revenue values are randomly generated in the in-
terval [0;10] and [5;300], respectively.
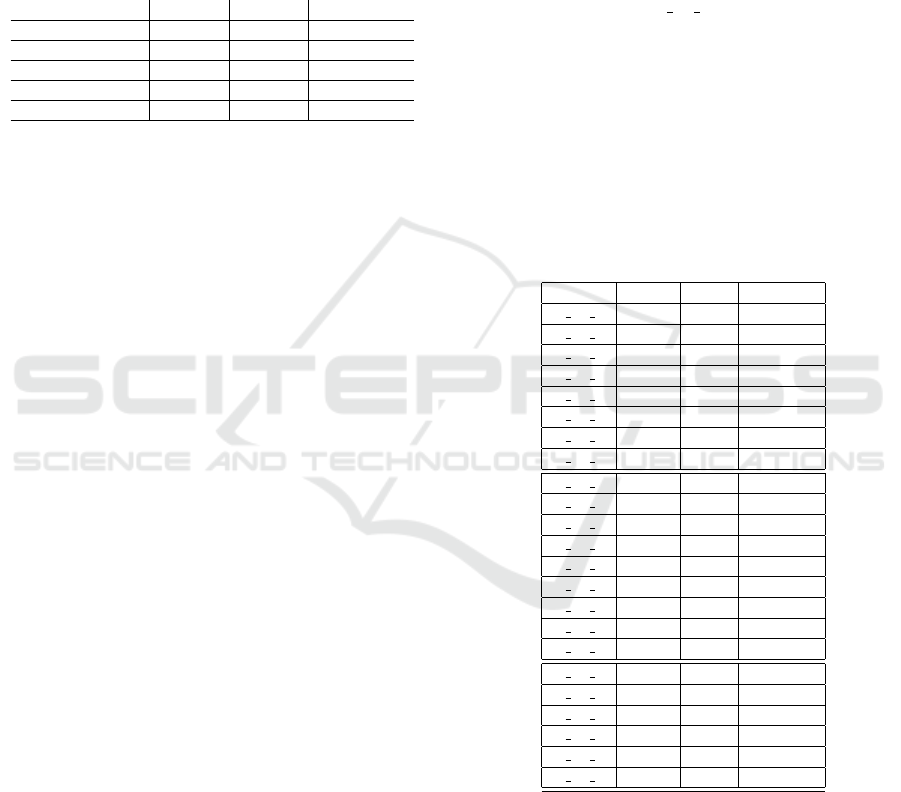
Table 5 summarizes the computational results ob-
tained by solving the BGAP model. In particular, for
each instance, it provides the objective function value
(column ”Revenue”) and the execution time (column
”Time”) in seconds.
Table 4: Test Problems.
Test Lines Legs Products
T 10 1 10 5 5
T 10 2 10 5 10
T 10 3 10 10 10
T 10 4 10 20 20
T 10 5 10 50 50
T 10 6 10 50 100
T 10 7 10 300 300
T 10 8 10 300 600
T 20 1 20 10 10
T 20 2 20 10 20
T 20 3 20 10 40
T 20 4 20 50 50
T 20 5 20 50 100
T 20 6 20 50 200
T 20 7 20 300 300
T 20 8 20 300 600
T 20 9 20 300 1200
T 50 1 50 50 50
T 50 2 50 50 100
T 50 3 50 300 300
T 50 4 50 300 600
T 50 5 50 500 500
T 50 6 50 500 1000
Looking at Table 5, it is easy to notice that the rev-
enues increase with the increasing of instances size.
This is an expected behaviour, since the higher the
demand and the capacity, the higher the revenue.
In order to analyze the dependency between the com-
putational overhead, required to solve the BGAP
model and the instances size, in Figures 4 – 8 we de-
pict the execution time as a function of instances char-
acteristics (i.e., number of lines, legs and products).
Management of Groups of Passengers on Buses Considering the Restrictions of COVID-19
73
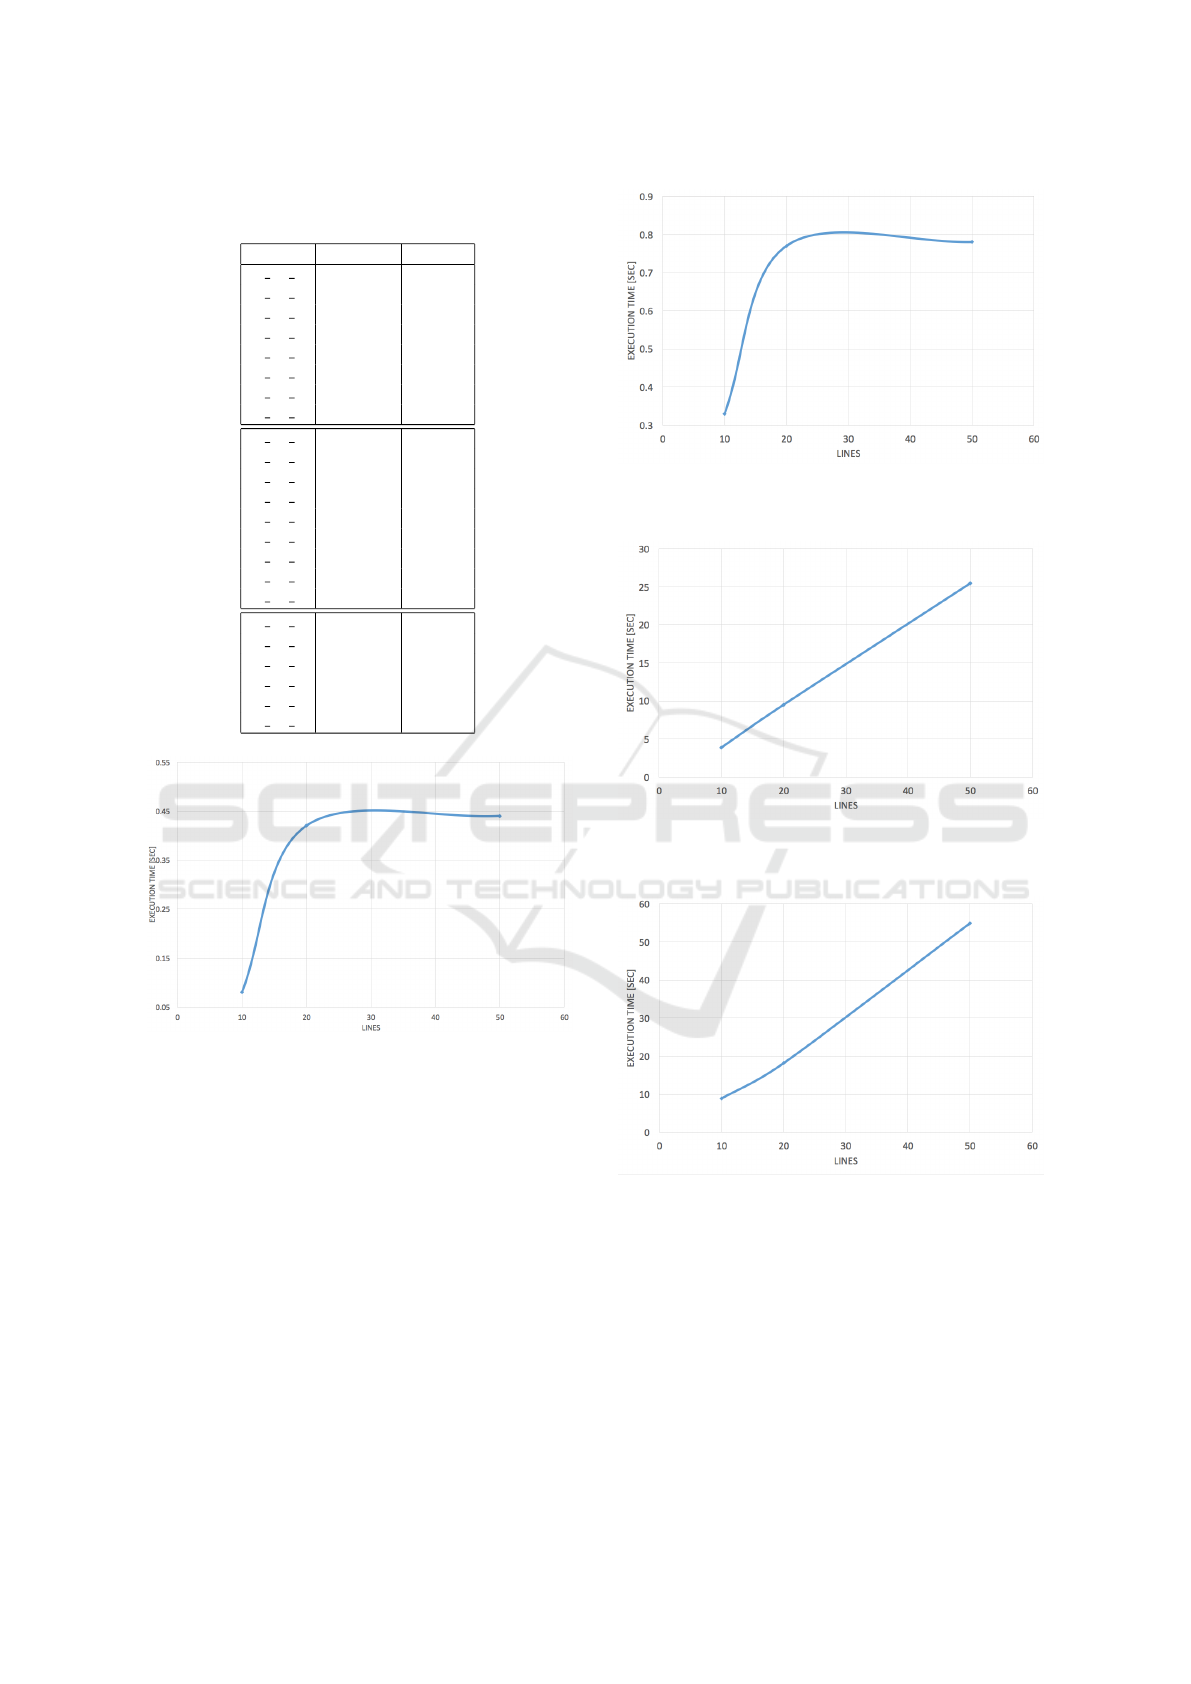
Table 5: Computational Results on randomly generated in-
stances.
Test Revenue Time
T 10 1 13022 0.02
T 10 2 33433 0.02
T 10 3 31190 0.03
T 10 4 44375 0.03
T 10 5 57632 0.08
T 10 6 61593 0.33
T 10 7 63941 3.86
T 10 8 65324 8.91
T 20 1 33806 0.03
T 20 2 59243 0.08
T 20 3 93001 0.08
T 20 4 101655 0.42
T 20 5 111050 0.77
T 20 6 124264 0.77
T 20 7 126783 9.48
T 20 8 128991 18.2
T 20 9 130580 36.08
T 50 1 146102 0.44
T 50 2 236471 0.78
T 50 3 413181 25.45
T 50 4 664210 54.91
T 50 5 586031 96.19
T 50 6 965359 202.63
Figure 4: Execution time as a function of the number of
lines, with fixed number of products and legs (50 legs, 50
products).
Focusing on the results depicted in Figures 4 - 7
we can notice that the higher the number of lines,
the higher the execution time. In particular, consid-
ering Figures 4 and 5, which refer to the results for
instances with 50 legs and 50 products, and 50 legs
and 100 products, respectively, it is evident that the
execution time sharply raises when the number of
lines increases from 10 to 20, then, after 20 lines, it
continues to slightly raise with respect to the number
of lines. Looking at Figures 6 and 7, which depict
the results obtained for instances with 300 legs and
300 products, and with 300 legs and 600 products,
respectively, it is easy to observe that the execution
time sharply increases with the increasing number of
Figure 5: Execution time as a function of the number of
lines, with fixed number of products and legs (50 legs, 100
products).
Figure 6: Execution time as a function of the number of
lines, with fixed number of products and legs (300 legs, 300
products).
Figure 7: Execution time as a function of the number of
lines, with fixed number of products and legs (300 legs, 600
products).
lines. Thus, looking at Figure 8, which summarizes
the overall results obtained on all the classes of in-
stances, we can state that the feature, which influence
the most the computational overhead is the number of
legs, and consequently the number of products, while
the number of lines has not a relevant impact on the
execution time. The plots reported in the Figure 9,
which depict the execution time as a function of the
ICORES 2022 - 11th International Conference on Operations Research and Enterprise Systems
74
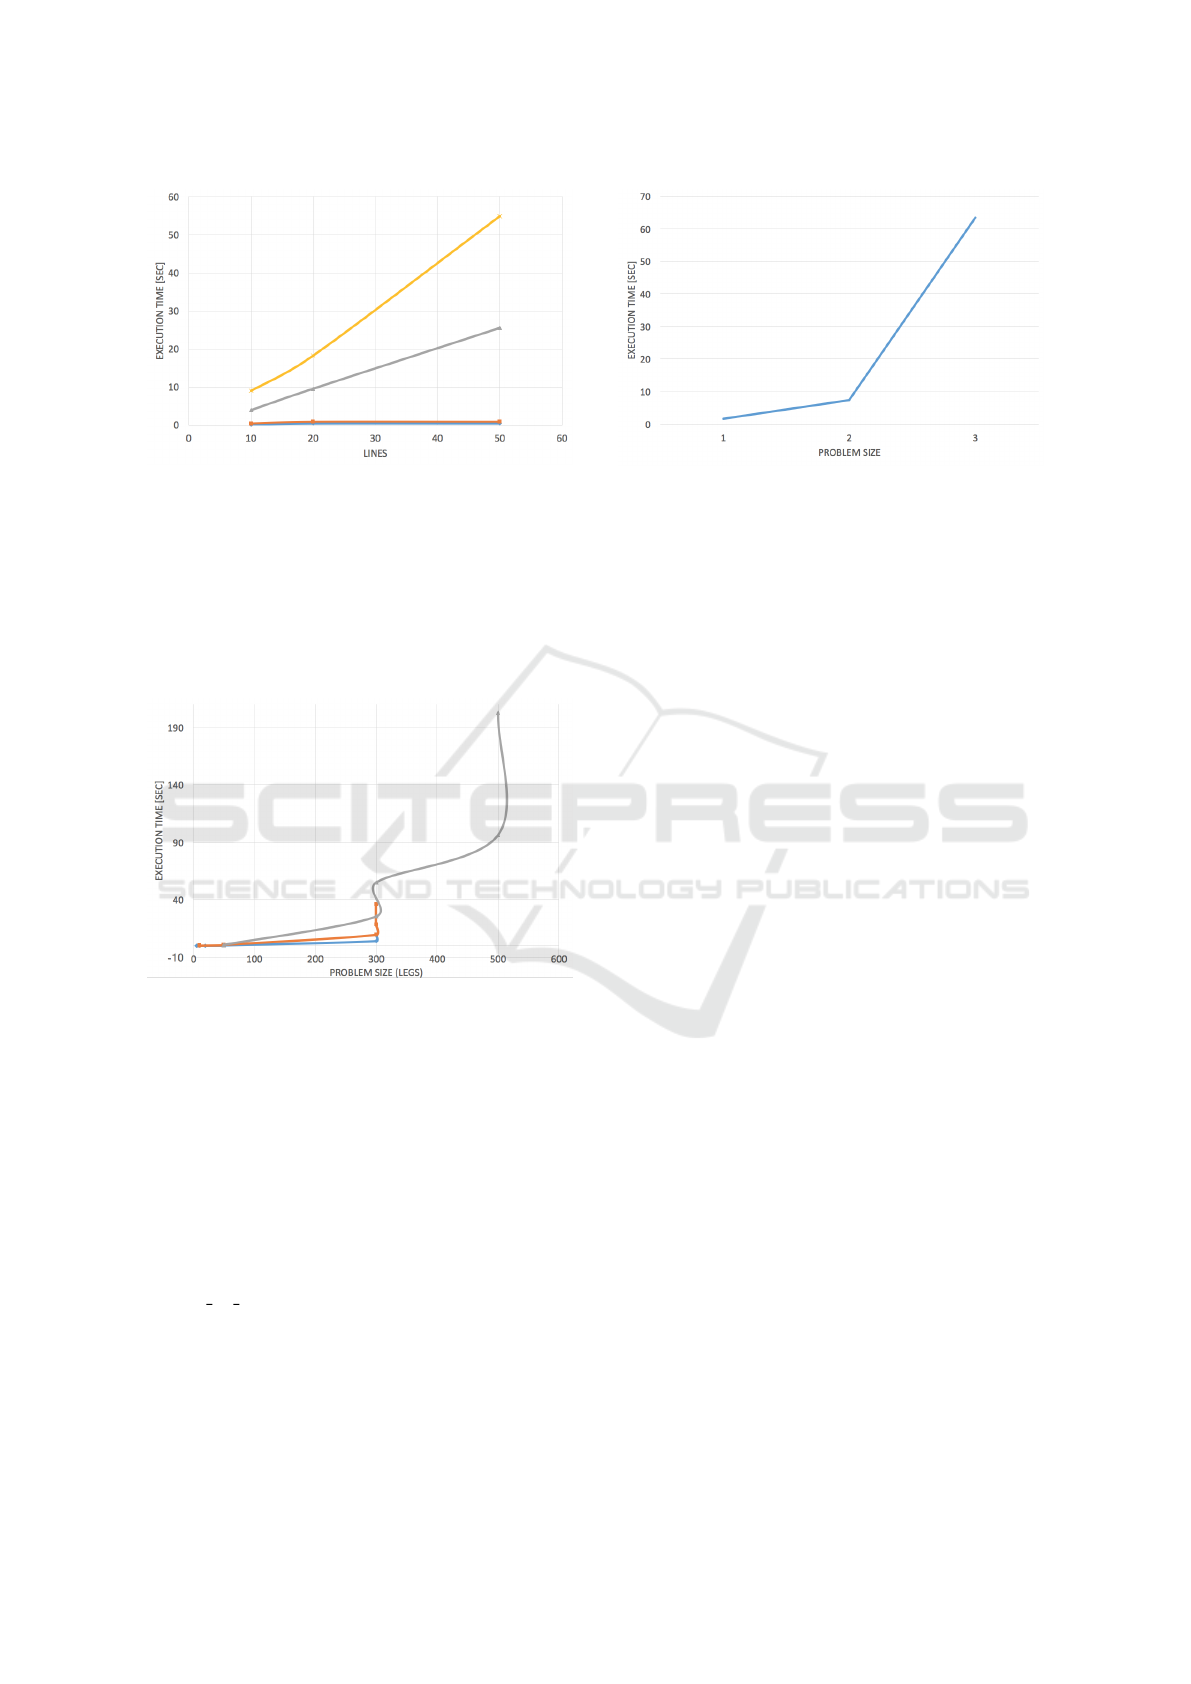
Figure 8: Execution time as a function of the number of
lines, with fixed number of products and legs: Orange line:
instances with 50 legs, and 50 products; Blue line: instances
with 50 legs, and 100 products; Grey line: instances with
300 legs, and 300 products; Yellow line: instances with 300
legs, and 600 products.
number of legs, fixing the number of lines, confirm
the strictly dependence of the execution time on the
numbers of legs and products.
Figure 9: Execution time as a function of the number of
legs, with fixed number of lines. Grey line: instances with
50 lines, Orange line: instances with 20 lines, Blue line:
instances with 50 lines.
Finally, looking at Figure 10 that represents the
trend of the average execution time with respect to
the increase of the problem size, we can notice that,
the computational time increases with the increasing
problem size, in terms of number of lines, number of
legs, and number of products considered, on average.
It is important to highlight that overall the reso-
lution of the BGAP model has short execution times,
i.e., in the order of minutes, even for large instances
(e.g., T 50 6). Thus, the BGAP model is efficient for
finding optimal solutions also considering more real-
istic sized instances. We may conclude that the use of
the BGAP model allows to efficiently and effectively
manage the seats assignment and groups of passen-
gers, by optimizing the seats allocation, respecting the
rules of social distancing imposed to reduce the diffu-
Figure 10: Trend of the average execution time with respect
to the increasing problem size.
sion of the COVID-19 virus.
5 CONCLUSIONS
In this paper we have considered the problem of allo-
cating groups of passengers on the buses during the
pandemic time. The main goals are: creating safe
configurations by respecting social distancing, opti-
mally exploiting the capacity of vehicles and maxi-
mizing the revenue deriving by the sale of travel tick-
ets. In particular, we considered the possibility to al-
locate groups of relatives close to one other, follow-
ing the Italian rules currently adopted on the buses.
However, it is worth noting that this model could be
easily extended to any transportation vector type, by
modifying the capacity constraints, considering the
specific features of the transportation vector. In the
computational experiments, we made a comparison
between the results obtained with and without the ap-
plication of the proposed model. The results high-
lighted that our model provides more effective solu-
tions than the common FIFO or NO GROUP strate-
gies. In addition, we investigate the scalability of the
model, by considering a set of randomly generated in-
stances of increasing size. The results highlighted that
the computational times increase with the increasing
number of lines. However, solving the model requires
a reasonable amount of time. Thus, we may conclude
that our model could efficiently help the bus trans-
port company to optimize the managing of resource-
constrained buses and, at the same time, maximizing
the revenue, considering the rules of social distanc-
ing. Hence, our model represents a valid support tool
for managing the passengers seats allocation by min-
imizing the risk of contagion.
Management of Groups of Passengers on Buses Considering the Restrictions of COVID-19
75

REFERENCES
Barry, M., Gambella, C., Lorenzi, F., Sheehan, J., and
Ploennigs, J. (2021). Optimal seat allocation under
social distancing constraints. IBM Research Europe.
Ferrero, F., Perboli, G., Rosano, M., and Vesco, A. (2018).
Car-sharing services: An annotated review. In Sus-
tainable Cities and Society. Elsiever.
Fischetti, M., Fischetti, M., and Stoustrup, J. (2021). Safe
distancing in the time of covid-19. In European Jour-
nal of Operational Research. Elsevier.
Gkiotsalitis, K. and De Weert, Y. (2021). A covid-19 public
transport frequency setting model that includes short-
turning options. In Future Transportation 2021, 1,
3–20. https://doi.org/10.3390/ futuretransp1010002.
MDPI.
Gongyu, C., Xinyu, F., Huiwen, J., Xian, Y., and Siqian, S.
(2021). An optimization-and-simulation framework
for redesigning university campus bus system with so-
cial distancing. arXiv:2010.10630v3.
Guerriero, F., Luzzi, M., and Macrina, G. (2020). Revenue
management approach for passengertransport service:
an italian case study. In Optimization and Decision
Science 2020. Springer.
Hancocka, T. O., Hessa, S., Marley, A., and Choudhurya,
C. F. (2021). An accumulation of preference: Two al-
ternative dynamic models for understanding transport
choices. In Transportation Research Part B: Method-
ological Volume 149, Pages 250-282. Elsiever.
Lin, B., Xu, J., Chen, S., Feng, Y., and Li, Michael, Z.
(2020). A hybrid model for airline seat inventory con-
trol of the multi-leg problems. In Operations Research
Letters 48 291–296. Elsevier.
Moore, J. F., Carvalho, A., Davis, ABULHASSAN, Y., and
Megahed, F. M. (2021). Seat assignments with phys-
ical distancing in single-destination public transit set-
tings. In IEEE Access, vol. 9, pp. 42985-42993, 2021,
doi: 10.1109/ACCESS.2021.3065298. IEEE.
Ongprasert, S. (2006). Passenger behavior on revenue man-
agement systems of inter-city transportation. In Tech-
nical report, Graduate School of Engineering. Kochi
University of Technology, Japan.
Salari R., M., Milne, J., Delcea, C., Kattan, L., and Cotfas,
L.-A. (2020). Social distancing in airplane seat as-
signments. In Journal of Air Transport Management.
Elsevier.
Wang, W., Tang, O., and Huo, J. (2018). Dynamic capacity
allocation for airlines with multi-channel distribution.
In Journal of Air Transport Management 69 173–181.
Elsevier.
ICORES 2022 - 11th International Conference on Operations Research and Enterprise Systems
76
