
Graph Convolutional Networks for Turn-Based Strategy Games
Wanxiang Li, Houkuan He, Chu-Hsuan Hsueh and Kokolo Ikeda
School of Information Science, Japan Advanced Institute of Science and Technology, Nomi, Ishikawa, Japan
Keywords:
Turn-Based Strategy (TBS) Game, Graph Convolutional Neural Networks, Minimax Tree Search.
Abstract:
In this paper, we research Turn-Based Strategy (TBS) games that allow players to move multiple pieces in
one turn and have multiple initial states. Compared to a game like Chess, which allows only one piece to
move per turn and has a single initial state, it is difficult to create a strong computer player for such a group
of TBS games. Deep learning methods such as AlphaZero and DQN are often used to create strong computer
players. Convolutional neural networks (CNNs) are used to output policies and/or values, and input states
are represented as “image”-like data. For TBS games, we consider that the relationships among units are
more important than their absolute positions, and we attempt to represent the input states as “graphs”. In
addition, we adopt graph convolutional neural networks (GCNs) as the suitable networks when inputs are
graphs. In this research, we use a TBS game platform TUBSTAP as our test game and propose to (1) represent
TUBSTAP game states as graphs, (2) employ GCNs as value network to predict the game result (win/loss/tie)
by supervised learning, (3) compare the prediction accuracy of GCNs and CNNs, and (4) compare the playing
strength of GCNs and CNNs when the learned value network is incorporated into a tree search. Experimental
results show that the combination of graph input and GCN improves the accuracy of predicting game results
and the strength of playing TUBSTAP.
1 INTRODUCTION
Turn-Based Strategy (TBS) games are a popular game
genre where players take turns to perform actions.
Classical board games such as Chess and Go are a
special case of TBS games that players usually oper-
ate one unit in each turn (for example, moving a piece
in Chess or putting a stone in Go). Under a broader
definition, many TBS games allow players to oper-
ate multiple units in each turn (i.e., whether and how
to move each unit). Many TBS games allow play-
ers to play multiple units in one turn. In addition,
many TBS games offer various initial states, for ex-
ample, pieces(units)’ initial positions may be differ-
ent in each play. This is different from Chess and
Go, which have only one initial state. As the num-
ber and placement of pieces(units) changes, players
need to think flexibly about their strategies. For exam-
ple, Fire Emblem (Nintendo, 2019), Battle for Wes-
noth (White, 2003) and Nintendo Wars (Nintendo,
1988) are famous TBS games with such rules.
To make the discussions clearer, TBS games in the
rest of this paper exclude classical board games. For
classical board games, state-of-the-art AI players are
strong enough as humans’ opponents. Particularly,
AlphaGo defeated top professional Go players Ke Jie
and Lee Sedol (Silver et al., 2017), and the successor
AlphaZero also achieved superhuman levels in Chess
and Shogi (Silver et al., 2018). In contrast, AI players
for TBS games are still weak, mainly because of the
massive number of move combinations in each turn,
coming from the fact that a player can move many
units in any order in one turn.
In this research, we employ an academic TBS
game platform called TUBSTAP (Fujiki et al., 2015),
in which several types of units exist, and each type
has different attack damage on other types. The maps
also contain different terrains (for example, plain, for-
est, and sea), which influence the mobility of units
and damage. Despite the simplified rules of TUB-
STAP, it is challenging to create strong AI players
that can deal with many different situations well. A
well-known method for creating evaluation functions
of game states is to learn from game records, such as
AlphaZero (Silver et al., 2018). The goal of our re-
search is to find out what kind of network can be used
to create a better state evaluation function for TUB-
STAP.
In the case of AlphaZero, the state evaluation
function is called a value network, and its input, i.e.,
552
Li, W., He, H., Hsueh, C. and Ikeda, K.
Graph Convolutional Networks for Turn-Based Strategy Games.
DOI: 10.5220/0010904200003116
In Proceedings of the 14th International Conference on Agents and Artificial Intelligence (ICAART 2022) - Volume 2, pages 552-561
ISBN: 978-989-758-547-0; ISSN: 2184-433X
Copyright
c
2022 by SCITEPRESS – Science and Technology Publications, Lda. All rights reserved

Figure 1: Game state 1.
the board, is represented as an “image” (for example,
19×19 planes representing black and white stones for
Go). And value networks are based on convolutional
neural networks (CNN) (Silver et al., 2018). Even
though TBS maps are also image-like, image input
may not be the best approach since the relationships
between units are more important for decision mak-
ing. Instead of image-like representation, we think
it is promising to treat the states as graphs in order
to adequately represent the relationships. So we pro-
pose to represent game states by graphs. Each node
is for one unit in this graph, and each directed edge
indicates that one unit can attack another. In addi-
tion, graph convolutional neural networks (GCN) has
been proposed to deal with graph-based data better
than CNN (Wu et al., 2020), so we employ GCN to
evaluate state values.
There are several potential advantages of graph
representation to image representation. Firstly, essen-
tially similar unit arrangements have the same repre-
sentation even the relative distance between two units
is not the same. Such an advantage can make the
learning efficient. Secondly, learning does not depend
much on the size of the map or the terrain but most on
the relationships between units. Therefore, the trained
value network which employs graph representation is
expected to be more reusable/applicable than the case
of image representation.
In our experiments, we confirm that our proposed
method increases the accuracy of the state evaluation
and thus the playing strength. At first, we employ su-
pervised learning to train value networks that evaluate
game states and test them by prediction accuracy. The
input of networks is the game state, and the output is
game results (win/loss/tie). We collected the training
and test data (states and game results) by Monte Carlo
tree search (MCTS) (Browne et al., 2012) player vs.
MCTS player. We compare image input with graph
input, and CNN with GCN. The best estimation accu-
racy is obtained with the combination of graph input
and GCN. We then combine the value networks into
Figure 2: Game state 2.
minimax search to make the TBS game player. The
GCN player obtains the highest winning ratio among
all tested players.
In the rest of this paper, Section 2 briefly intro-
duces TUBSTAP and GCN. Section 3 presents the
graph representation of TUBSTAP states, how to train
value networks, and how to do minimax searches with
the value networks. Section 4 shows the experiment
results, and Section 5 makes concluding remarks and
introduces our future work.
2 BACKGROUND
In this Section, we will explain the background of this
research. In Section 2.1, we will introduce the ex-
periment platform TUBSTAP. In Section 2.2, we will
explain the graph convolutional networks (GCN).
2.1 TBS Game and Research Platform:
TUBSTAP
In this paper, we focus on TBS games that allow play-
ers to move multiple pieces in one turn and have mul-
tiple initial states. There are many such TBS games,
and their features make them differently challenging
from Chess and Go.
TUBSTAP is a two-player complete informa-
tion TBS game platform developed for academic re-
search (Fujiki et al., 2015). It is a TBS game that
do not contain internal politics elements (for exam-
ple, gaining resources and using resource to create
units, or upgrading units to improve their ability).
TUBSTAP is a convenient platform, where some re-
searchers have introduced and tested their algorithms
on it (Fujiki et al., 2015; Sato and Ikeda, 2016;
Kimura and Ikeda, 2020; Pipan, 2021). We consider
that TUBSTAP has rules of moderate complexity and
is suitable for comparing different methods, explained
as follows. Too-simple rule will make it difficult to
Graph Convolutional Networks for Turn-Based Strategy Games
553

Table 1: The characteristic of different units.
attack
Mobility Shooting Range
Fighter Attacker Panzer Cannon anti-aiR Infantry
F 55 65 0 0 0 0 9 1
A 0 0 105 105 85 115 7 1
P 0 0 55 70 75 75 6 1
C 0 0 60 75 65 90 5 2-3
R 70 70 15 50 45 115 6 1
I 0 0 5 10 3 55 3 1
propose new methods because it is easy to create a
strong player using existing methods. Too-complex
rule will make it difficult to compare methods purely
because various elements of the rules need to be ad-
dressed to create a strong computer player. Hence we
consider using TUBSTAP as our test environment.
Figure 1 and Figure 2 show examples of this game
platform. TUBSTAP’s rule is based on Advance Wars
Days of Ruin (Nintendo, 1988). One player owns the
red units and the other player the blue units. The hit
point (HP) of each unit is shown on the top-right of the
unit. Different types of units have different character-
istics, such as attack ability, which will be explained
soon later. Victory condition of the game is to destroy
all enemy’s units or to have the sum of HP higher than
that of enemy after some certain turns.
There are 6 types of units in TUBSTAP game:
Fighter, Attacker, Panzer, Cannon, Anti-air and In-
fantry. Their characteristics such as attack power,
mobility, and shooting ranges are shown in Table 1.
We can find some predator-prey relationships; for ex-
ample, Fighter(F) exploits Attacker(A), A exploits
Panzer(P), P exploits anti-aiR(R), and R exploits F.
The mobility decides how far a unit can move. For ex-
ample, Infantries have the mobility of 3. When mov-
ing on the plain terrain (moving cost 1), Infantries can
move at most three grids counted by Manhattan dis-
tances. And a unit cannot move through enemy units.
The shooting range decides how far a unit can attack.
Because of the differences between the units, how to
use them cleverly is the core issue that players need
to consider and is also the most interesting part of the
game.
As for the battle system, the damage of an attack
action is determined by the attacker’s attack power,
the attacker’s HP, the defender’s HP, and a terrain fac-
tor, as shown in Eq. 1 The terrain factor will be ex-
plained in Appendix.
70 + (Attack ×AT Kunit
0
sHP)
100 + (DEFunit
0
sHP ×TerrainFactor)
(1)
When attacking neighbor units, after the attacker’s
damage has been applied to the defender, a counterat-
tack is launched. For example, an Infantry with 10 HP
attacks another Infantry with 10 HP on the Plain; the
attack will give (70+(55×10)/100+(10 ×1)) = 5.6
damage. And the counter-attack will give (70 +(55×
4.4)/100 + (10 ×1)) = 1.2 damage
1
.
Some researchers have employed TUBSTAP in
their research on TBS games. Fujiki et al. intro-
duced a depth-limited Monte-Carlo tree search and
tested their method on TUBSTAP (Fujiki et al., 2015).
Sato and Ikeda proposed forward-pruning techniques
to minimax search variants and evaluated them on
TUBSTAP (Sato and Ikeda, 2016). Kimura and Ikeda
used an AlphaZero-like method on the TBS game and
introduced their method on TUBSTAP, and their main
idea is to use the network multiple times. Their selec-
tion unit is in the input layer, as opposed to the usual
implementation where the unit selection is in the out-
put layer. Their main purpose is to reduce the com-
plexity of the output layer and improve learning effi-
ciency (Kimura and Ikeda, 2020). Pipan implemented
three MCTS-based game-playing agents in his modi-
fied TUBSTAP and compared their performance; the
main purpose is to apply and understand how MCTS
variations work with hidden information (for exam-
ple, fog-of-war) in TBS game (Pipan, 2021). In our
case, the main purpose is to find out what kind of net-
work can be used to create a better board evaluation
function for TUBSTAP.
2.2 Graph Convolutional Network
AlphaZero uses CNN to build the value network to
evaluate the state of the game of Go (Silver et al.,
2018). CNN is being used not only for games, but
also in other fields, such as image recognition (Le-
Cun et al., 2015). Usually, CNN deals with the
image or image-like data well; however, many data
in the real world are represented by graphs, such
as social networks (Meqdad et al., 2020), informa-
tion networks (Xiong et al., 2021), and knowledge
1
The example rounds off the HP to one decimal place;
we used float-type to calculate the HP in our program,
which is different from the original TUBSTAP calculation
method that rounds off to integers.
ICAART 2022 - 14th International Conference on Agents and Artificial Intelligence
554
graphs (Yang et al., 2020). CNN may not be suit-
able to deal with graph data. Kipf and Welling (Kipf
and Welling, 2016) proposed graph convolutional net-
works (GCN) to deal with graph data in neural net-
works “directly”. Unlike CNN, the graph convo-
lution’s process is similar to matrix dot calculation,
which would not change the size of the input graph.
GCN model can make use of the graph struc-
ture (and of features extracted from the graph struc-
ture at later layers) (Kipf and Welling, 2016). GCN
has been successfully employed in some applications
where the input is essentially one or some graphs.
For example, DeepMind used GCN to boost the ac-
curacy of the Google maps estimated time of ar-
rival (Derrow-Pinion et al., 2021). Their method suc-
ceeded in reducing the estimation error by about half
in cities such as Berlin, Sydney, Tokyo and Washing-
ton DC (Derrow-Pinion et al., 2021).
3 APPROACHES
In this Section, we will introduce the purposed meth-
ods. In Section 3.1, we will introduce how we repre-
sent the game state as graph. In Section 3.2, we will
introduce the training method on state evaluation. In
Section 3.3, we will introduce minimax search with
GCN.
3.1 Graph Representation for Game
State
There are many possible ways to represent a stage of
TUBSTAP. One way is to represent TUBSTAP game
states as image-like data, which uses several matri-
ces to represent the units’ position, HP, attack, color
(side), type and other information separately. For sim-
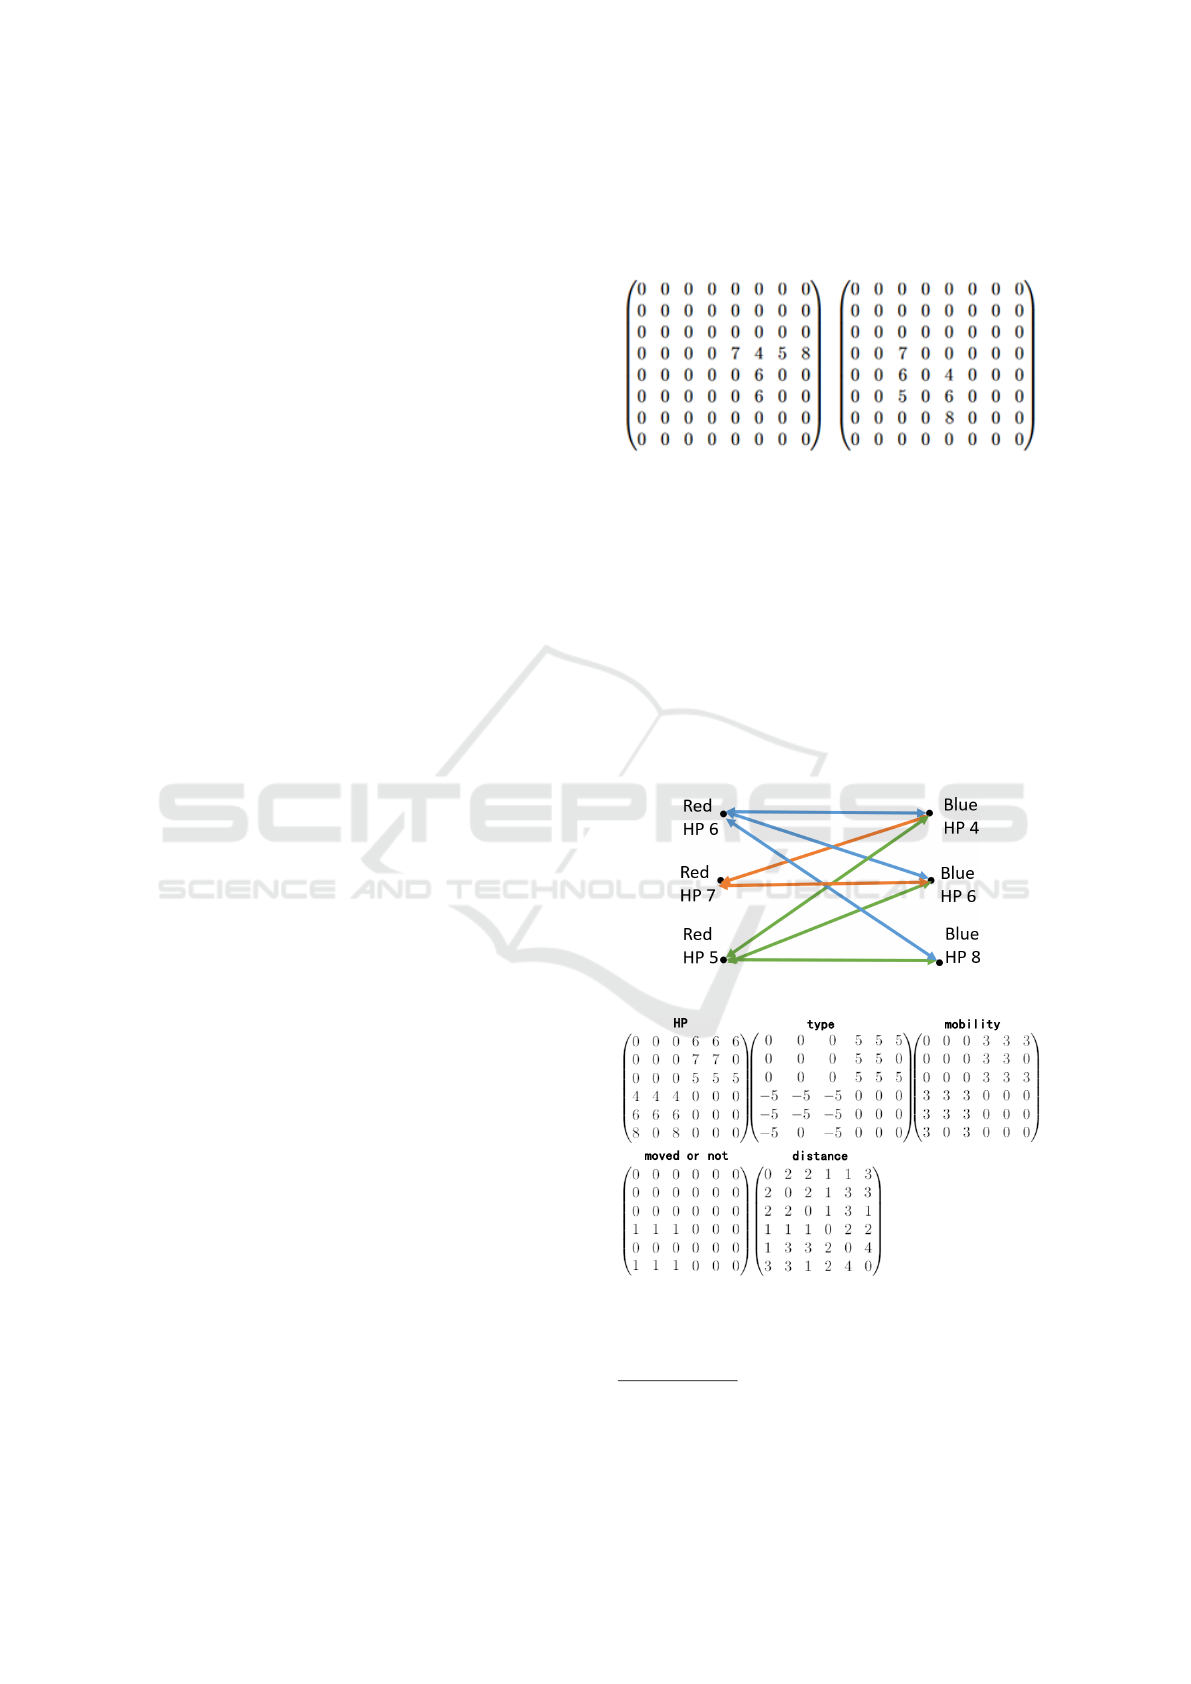
plicity of discussions, we will explain using the HP
matrix as an example. The matrix representations of
the HP information of the state in Figure 1 is shown
in the left of Figure 3, and state in Figure 2 is shown
in the right Figure 3. Each element in the matrices is
the HP of the unit on the corresponding grid.
As we can tell from the figure, the two matrices
are entirely different, i.e., image representation will
treat these two states as different states. However,
all units’ relationships (which units can attack which
units) are essentially similar; for example, both the
red units with 6 HP in Figure 1 and 2 can move and
then attack all the blue units. Using image represen-
tation may cause training inefficiently. Besides, the
image representation requires different sizes of net-
work inputs when the map size is changed. It is hard
to apply a trained network directly to a map of a dif-
ferent size
2
. It is usually necessary to prepare a new
network of that size and train it again.
Figure 3: HP matrix of game states 1(left) and 2(right).
To solve these problems, we propose to represent
a TUBSTAP state as a graph. Each node in this graph
represents one unit in the current map. A directed
edge from node-X to node-Y means that unit X can
attack unit Y. The absolute placement provides a rich
amount of information, but we believe that consider-
ing whether units can attack each other is often suf-
ficient to estimate the goodness of a state. By repre-
senting many similar states with similar evaluation in
the same graph, learning is expected to be more effi-
cient. If we consider the two examples before, their
representation of graphs is like Figure 4.
Figure 4: Graph for game state in Figure 1.
Figure 5: Graph representation for game state in Figure 1.
For the two game states in Figure 1 and Figure 2,
the units’ relationships (can attack another) are essen-
2
As CNN cannot be applied directly to larger maps, our
idea (GCN, shown next) cannot be applied directly to maps
with more units than it was trained.
Graph Convolutional Networks for Turn-Based Strategy Games
555

tially similar, so they can be represented by the simi-
lar graph. Adjacency matrices are one way to repre-
sent a graph, and GCN usually expects one or more
adjacency matrices to be input. Figure 5 shows the
adjacency matrix of HP information for the graph in
Figure 4. Each directed edge is weighted by the HP of
the attacking unit, indicated by the parent node. Natu-
rally, the size of the adjacency matrix depends on the
number of ALIVE units, but we fix it to x ×x, where x
is the number of total units in the initial states. So it is
also possible to apply our graph presentation to maps
with different sizes. And we can reuse the trained net-
work for these different maps.
In addition to the HP matrix, several matrices are
input to the value network. The type, mobility ma-
trix are adjacency matrices but have different edge
weights to represent different information. The other
two matrices represent whether moved or not and the
distance information. The example of different matri-
ces are shown in Figure 5; it should be noted that the
blue unit with 6 HP has already been moved.
1. type: similar to the HP matrices, we fill the posi-
tion with unit type number, and type numbers are
positive for red player, negative for blue player.
2. mobility: similar to the HP matrices, we fill the
matrix with units mobility.
3. whether moved or not: if we we have n units for
each side, if Red i-th unit can move, then in i-th
row, (i,n +1) to (i,2n) are filled with 1; if Blue j-
th unit can move, then in j-th row, ( j,1) to ( j, n)
are filled with 1; with this information, the net-
work can determine the current turn player.
4. distance: if we have n units for each side, in this
matrix, for each i-th row, (i,1) to (i, 2n) are filled
with the distance between the i-th unit and all
units no matter they can attack each other or not.
We use the Manhattan distance between two units
i and j, i.e.,
x
i
−x
j
+
y
i
−y
j
where x
i
and x
j
are the row coordinates of i and j, y
i
and y
j
are
the column coordinates.
With the adjacency matrix’s help, we can ame-
liorate the input data of the neural network to make
one representation correspond to the different unit ar-
rangements and different map sizes. To sum it up,
we will convert the game state into a graph structure
representation, use an adjacency matrix to represent
it, and finally send it to the neural network to learn
features.
3.2 Supervised Learning on State
Evaluation
Kimura et al. tried AlphaZero-like learning to train
the value network for the TBS game (Kimura and
Ikeda, 2020), but AlphaZero learning is more com-
plex than pure supervised learning because game
records are created simultaneously, and policy net-
work is also trained. Since the output representation
of the policy network is another issue that greatly
affects the performance, we decided to separate it
and use simple supervised learning to train value net-
works. We prepare training data as follows. We ran-
domly generated various opening situations, let exist-
ing AI players play from these opening situations, and
collected the initial/intermediate states and results. As
for why using different opening situations, in TBS
games, opening situations are often designed by the
game designers and differ much. We want to train
a good value network that can handle several kinds
of opening situations, so the variety of opening situa-
tions is important.
For each state in a game record, we label the value
as the final result (win/loss/tie) of that game from the
view of the player to move. In more detail, if Red
player wins a game, we label 1 for all Red turn states
and -1 for all Blue turn states and vice versa. And
if the game ends as a tie, we will mark all states to
0. By learning state-outcome pairs in this way, we
expect the neural network to be able to estimate the
value (how advantageous the player is) of the given
game state.
3.3 Minimax Search with GCN
The minimax algorithm is a classical tree search al-
gorithm for zero-sum two-player games, one player is
called the maximizer, and the other player is a mini-
mizer. If we assign an evaluation score to game state,s
one player tries to choose a game state with the max-
imum score, while the other chooses a state with the
minimum score (Russell and Norvig, 2010). The ideal
way of minimax tree search is searching the game
state until wins/losses/ties are obtained, but it is infea-
sible for most cases. Thus, evaluating states by some
function is practical.
Different from classical board games, players in
TUBSTAP (and other TBS games) can operate mul-
tiple units in one turn. If one “action” includes all
unit’s moves, the number of possible actions is con-
siderably large. Taking three Infantries versus three
Infantries (situation in Figure 2) without consider-
ing unit interaction as an example, each player has
roughly (3!)×25 ×25 ×25 = 93,750 moves per turn,
ICAART 2022 - 14th International Conference on Agents and Artificial Intelligence
556
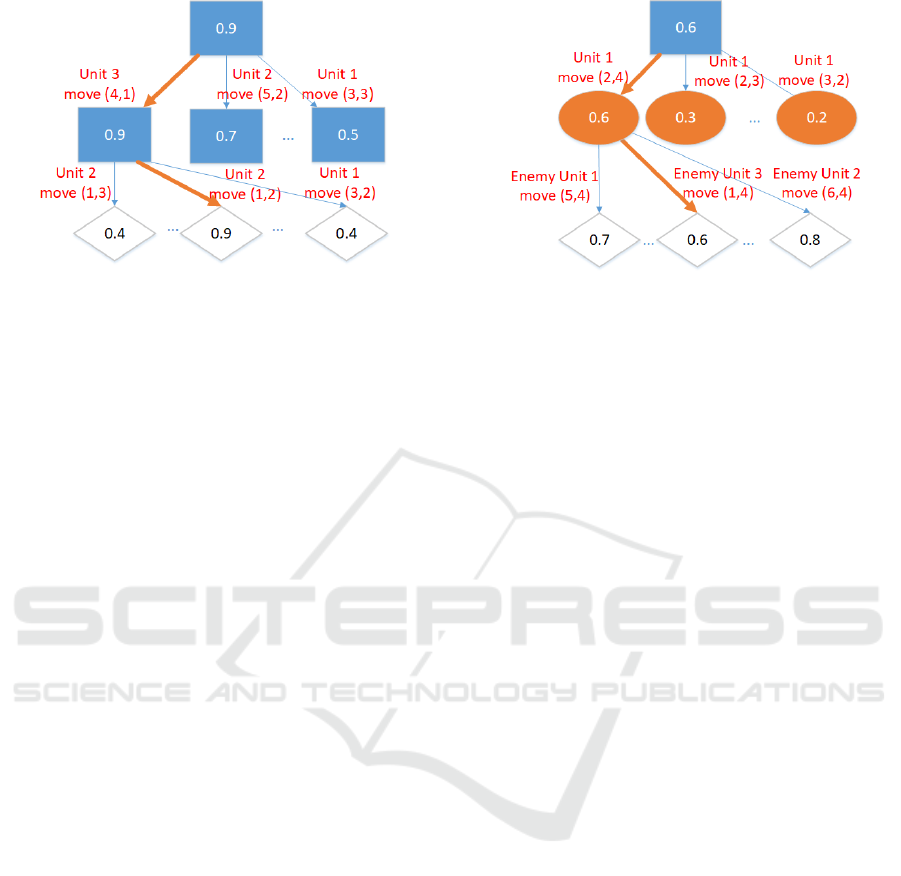
Figure 6: An example of MAX-MAX search with principal
variation (orange bold arrow).
where 3! is for the different order of moving three In-
fantries and 25 for possible movements of an Infantry.
When doing a minimax search considering only two
turns, about 93, 750
2
= 8, 789,062,500 states will be
evaluated, which is extremely costly.
Therefore, we break down one turn-action into
several unit operations and modify the minimax
search a little (Muto and Nishino, 2016). As long
as it is the player’s turn, the tree nodes are MAX-
nodes; similarly, when it is the opponent’s turn, the
tree nodes are MIN-nodes. Taking the same example
of three Infantries, assume to look ahead for two oper-
ations (depth 2). When 0 or 1 unit has been moved in
that turn, a MAX-MAX search is executed, which is
shown in Figure 6. When two units have been moved,
a MAX-MIN search is executed because after the first
move, all three units complete their moves then the
opponent’s turn begins, which is shown in Figure 7.
The depth-2 search may not be promising in strength,
but we can get an affordable search cost and a sim-
ple way to compare different value networks’ abili-
ties. When doing such a unit-based search, the leaf
node is not necessarily at the beginning of the turn
but after some units have moved. To allow the value
networks to evaluate such intermediate states, we in-
clude “whether moved or not” in the input (described
in Section 3.1) and also include the intermediate states
in the training data(described in Section 3.2).
4 EXPERIMENT AND ANALYSIS
In this Section, we present the results of our evalu-
ation experiments. The purpose of our experiments
is to compare graph representation with image-like
representation, and to compare GCN with CNN. Sec-
tion 4.1 introduces the maps used for training and
evaluation. Section 4.2 describes the settings and re-
sults of supervised learning of the value network. Sec-
Figure 7: An example of MAX-MIN search with principal
variation (orange bold arrow).
tion 4.3 shows the results when the trained network is
combined with Minmax tree search.
4.1 Map Generation
In TBS games, a complete game (or story) often con-
sists of multiple scenes that happen in different maps
with various sizes, terrains, and units’ types, num-
bers, and locations. In our experiments, the TUB-
STAP games consisted of one single 8 × 8 map, and
the terrain was fixed to plains only, but various pat-
terns of units were used for learning and evaluation.
The generated maps can be divided into three main
categories: random maps, symmetric maps, and local-
search maps.
The victory conditions are the same for all cate-
gories. The player who destroys all of his/her oppo-
nent’s units wins. If the HP of any unit of both sides
is not reduced for 20 turns, the game is judged as a
tie.
Random Map. A random map contains three Red
Infantries and three Blue Infantries. Their positions
and HPs were randomly determined. The HP of the
initial player ranges from 1 to 10, where the HP of
the second player ranges from 1 to 9. Maps are often
unfair because of the randomness of their placement,
rather than the impact of different HP ranges. It is
usually easy to predict the outcome of such an unfair
map.
Symmetric Map. Symmetric unit arrangement at
the beginning of a game are often used in traditional
turn-based board games such as Chess and Shogi, so
we also consider this kind of maps. A symmetric map
has two Infantries and one Panzer for each side. The
Infantries’ HP is fixed to 10, and the Panzers’ HP is
fixed to 5. We firstly randomly decide positions for
the red side units in the upper half of the game map.
Graph Convolutional Networks for Turn-Based Strategy Games
557
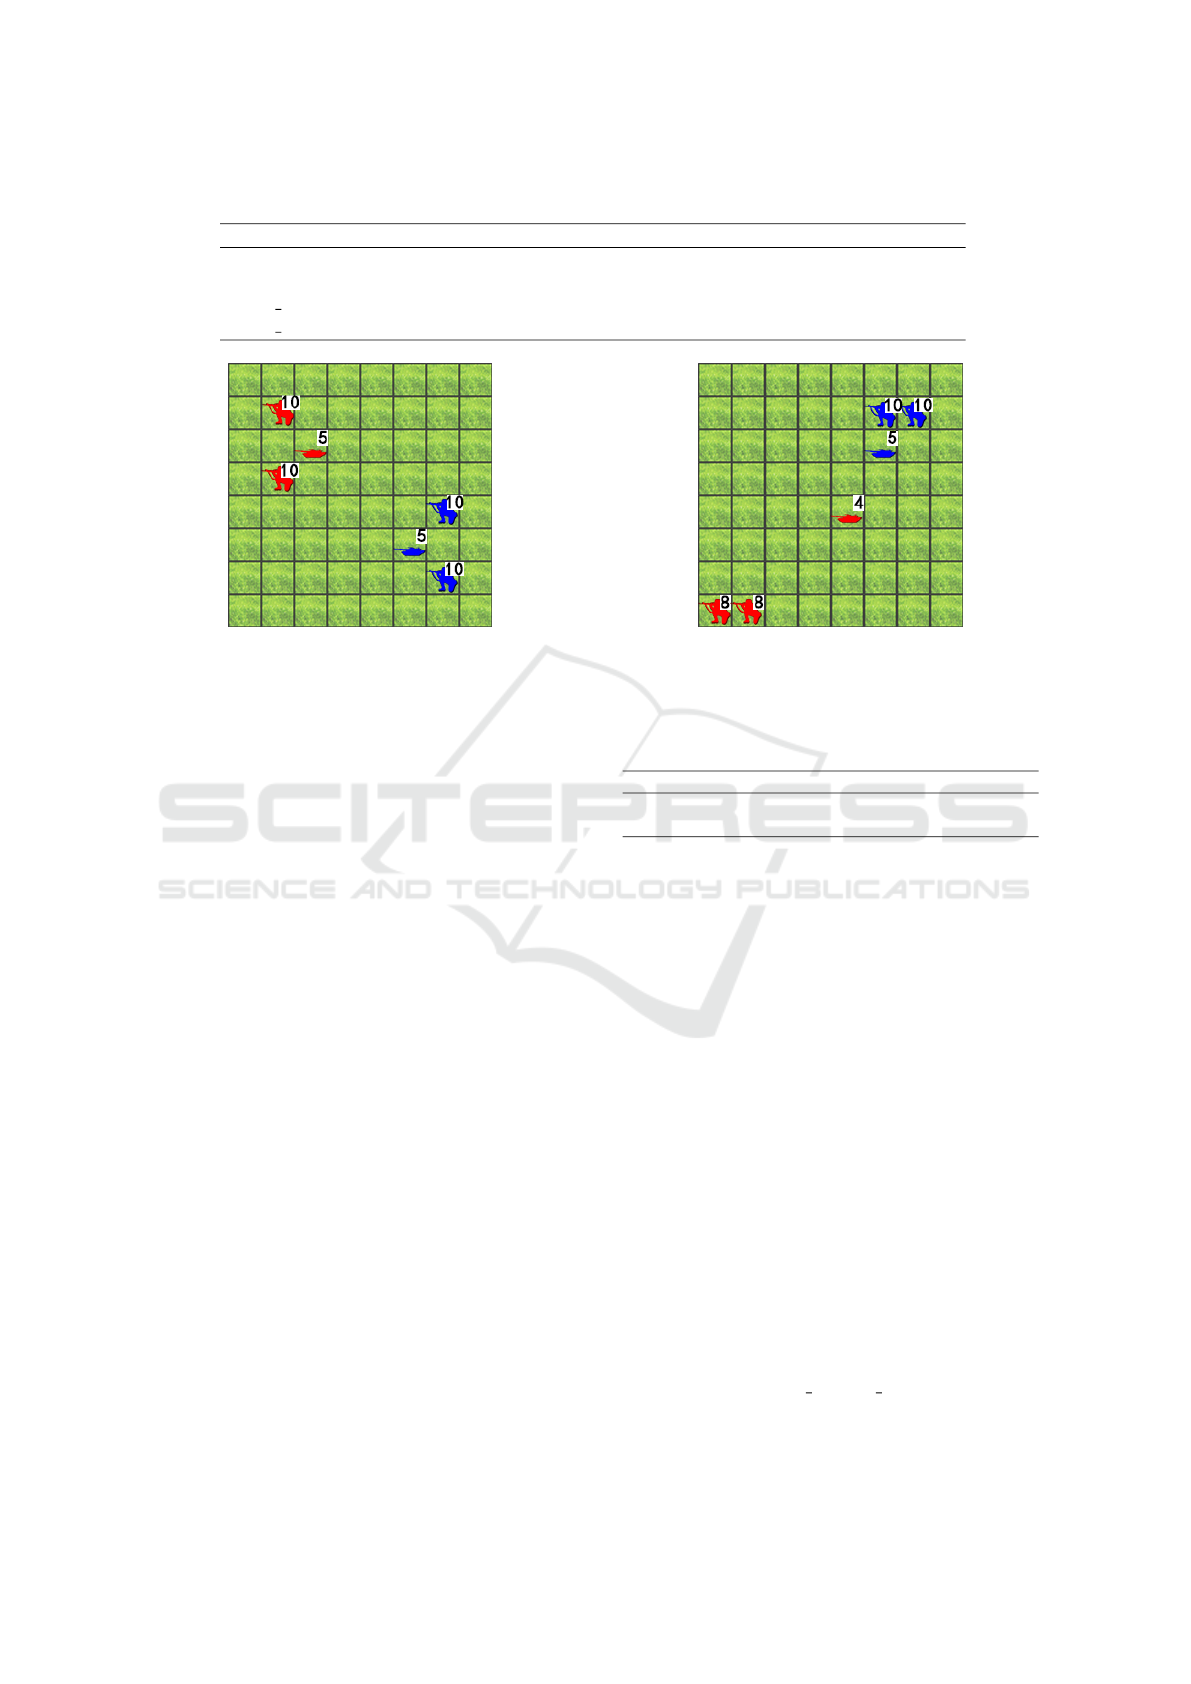
Table 3: The network layers.
Network name layer 1 layer 2 layer 3 layer 4 weight number
CNN
i
cnn 32 ×3 ×3 cnn 64 ×2 ×2 FC 512 FC 512 174,721
CNN
g
cnn 32 ×3 ×3 cnn 64 ×2 ×2 FC 256 FC 512 76,705
GCN 4 gcn 16 ×6 ×6 gcn 4 ×6 ×6 FC 144 FC 512 76,433
GCN 32 gcn 16 ×6 ×6 gcn 32 ×6 ×6 FC 1152 FC 512 596,225
Figure 8: An example of symmetric maps.
Then we set the blue side units rotationally symmet-
rically at the lower right of the game map. The sym-
metric maps may be still unfair because of an initial
player advantage or disadvantage. The example of a
symmetric map is shown in Figure 8.
Local-search Map. A local-search map contains
two Infantries and one Panzer for each side. At first,
the units’ position is randomly set, and the Infantries’
HP is 10, the Panzers’ Hp is 5. We then employ two
MCTS players with 6400 rollouts to play this map
against each other. If one player wins, we decrease
one unit’s HP by 1 for the winning side or increase
one unit’s HP by 1 for the losing side. Until there is
a tie or the winning side changes, we save the map
as a local-search map. We expect such maps to be
relatively fair for the two players. The example of a
local-search map is shown in Figure 9.
4.2 Supervised Learning for Value
Network
In this experiment, we are going to train value net-
works and test their prediction accuracy. We led
MCTS players play against each other, then collected
the result (win/loss/tie). All states were labeled by
1/-1/0 for win/loss/tie, as mentioned in Section 3.2.
We collected 83,060 (state, result) pairs for training
from 200 random map games, 274 symmetric map
games, and 1,900 local-search map games. We also
collected 3,859 pairs for testing from another 15 ran-
dom maps, another 25 symmetric maps, and another
Figure 9: An example of local-search maps (red first move).
80 local-search maps. The number of states for each
label in training data and test data is shown in Table 2.
Table 2: The number of states for each label.
win loss tie total
Training data 34,863 19,768 28,429 83,060
Test data 1,783 1,186 890 3,859
The collected (state, result) pairs are used for su-
pervised learning, where the state is input to net-
works, and networks output the result. Different net-
work structures and weight numbers may cause dif-
ferent prediction abilities. We designed four net-
works shown in Table 3, CNN’s structure is based
on Le-Net (Kayed et al., 2020). And in this table
gcn n ×m ×k means n-dimensional graph convolu-
tion layer with m ×k kernel; cnn n ×m ×k means
n-dimensional convolution layer with m ×k kernel;
FC n means a fully-connected layer containing n neu-
rons. All output layers consist of one node, which
expresses [-1, 1], representing the input state’s good-
ness.
The network would output the continuous value
in float type. In order to calculate the prediction accu-
racy, we converted the output value into three labels
(win/loss/tie) in this experiment. We set the label as
“win” when the output value is higher than 0.5, and
set the label as “loss” when the output value is lower
than -0.5; otherwise, we set the label as “tie”. We will
compare the output label with the true label and get
the prediction accuracy.
We compared GCN 4, GCN 32 with CNNs. The
result in Figure 10 shows that the CNN’s prediction
accuracy was significantly better when using graph
ICAART 2022 - 14th International Conference on Agents and Artificial Intelligence
558
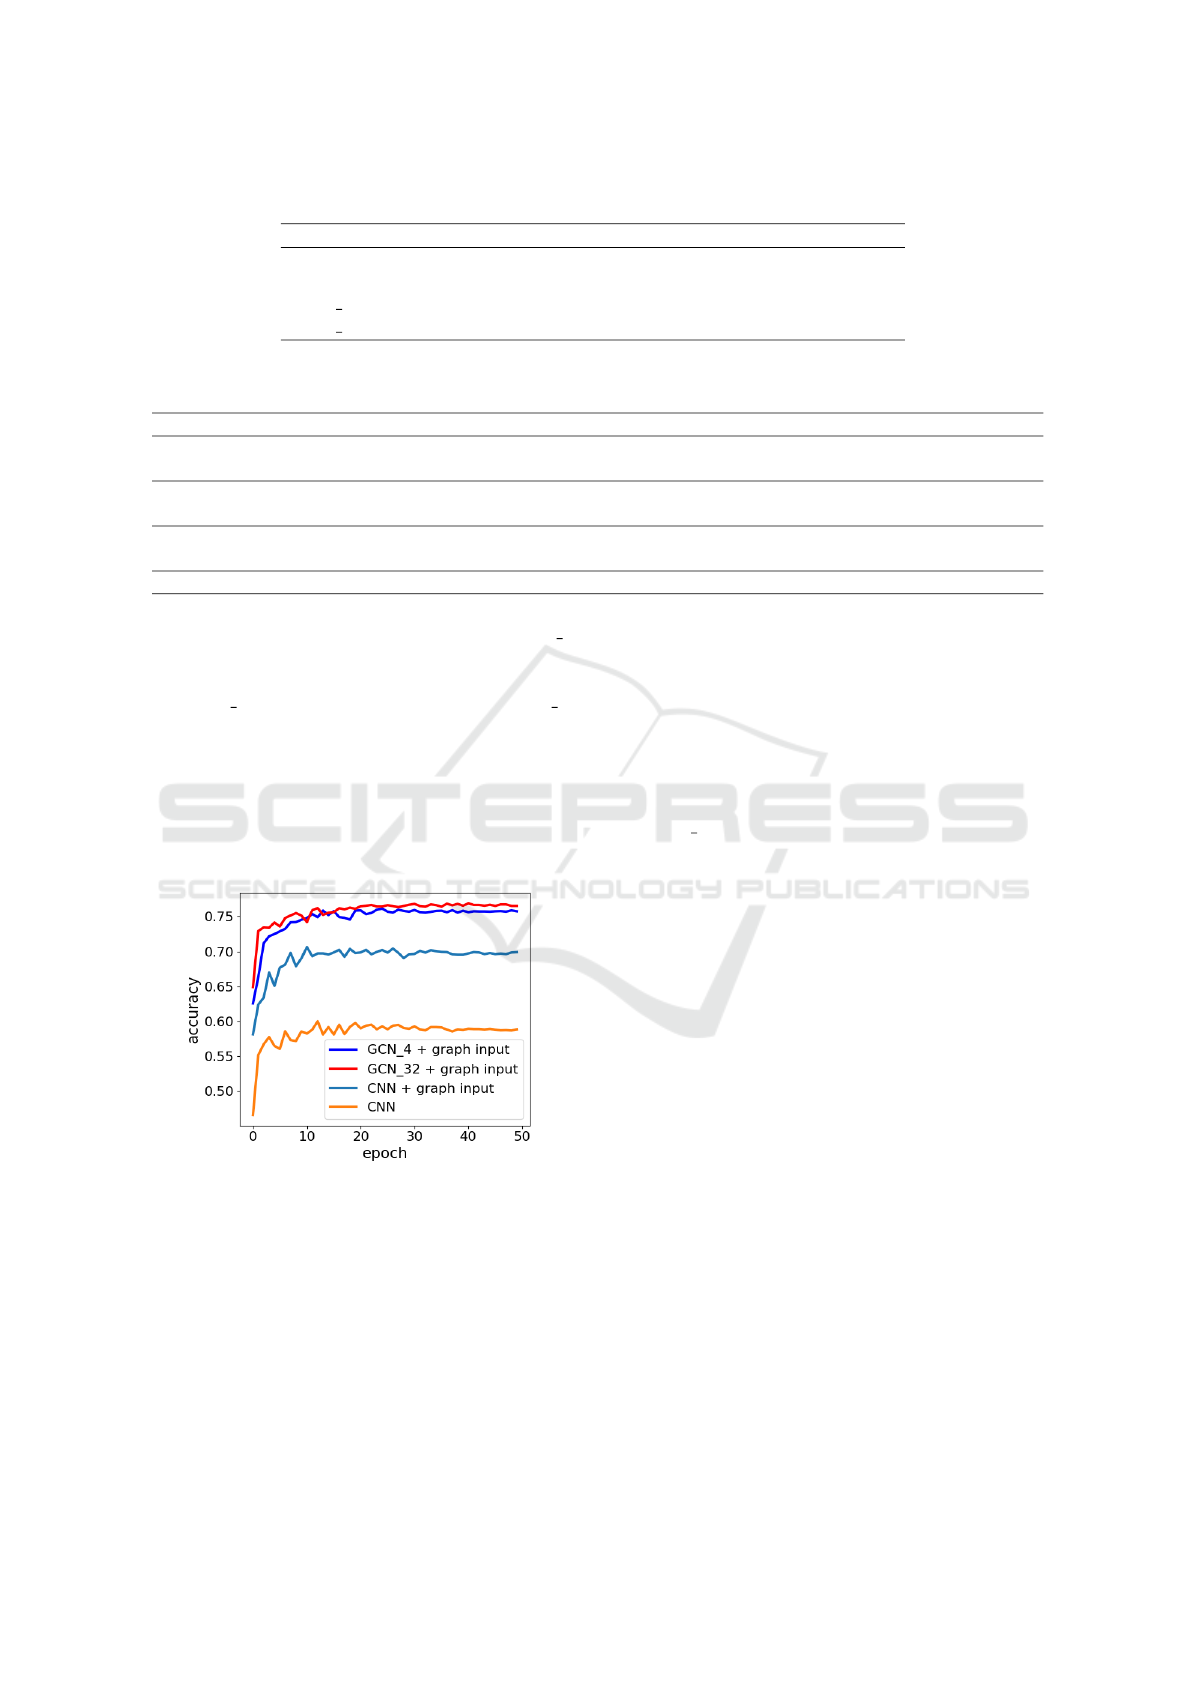
Table 4: The results in prediction accuracy for GCNs and CNNs.
Overall Random map Symmetric map Local-search map
CNN
i
58.2% 74.5% 61.1% 56.8%
CNN
g
71.5% 81.1% 75.9% 70.6%
GCN 4 77.5% 85.3% 81.2% 76.7%
GCN 32 78.2% 85.4% 81.2% 77.5%
Table 5: Results of game matches between 4 players on symmetric maps. The winning ratios, win-loss-tie counts and avg.
thinking times in the initial maps.
vs GCN player CNN
g
player CNN
i
player MCTS-200 player avg. thinking time
GCN player -
55.5%
(199-144-157)
78.2%
(349-67-84)
64.6%
(304-158-38)
1.42s
CNN
g
player 44.5% -
71.0%
(298-88-114)
42.7%
(196-269-35)
1.78s
CNN
i
player 21.8% 29.0% -
20.2%
(95-393-12)
1.89s
MCTS-200 player 35.4% 57.3% 79.8% - 5.34s
input (71.5%) than image input (58.2%). And GCN 4
showed better accuracy (77.5%) than CNN
g
(71.5%)
even though they have similar numbers of weights.
And GCN 32 is a much richer network than GCN 4,
but the improvement in accuracy was about 0.8%. Ta-
ble 4 also shows the evaluation results when applying
individual map groups to test each value network. The
tendency for graph input and GCN to outperform im-
age input and CNN is the same for each map group.
And as expected, when tested on unfair maps, it is
easier for networks to predict the game results.
Figure 10: Accuracy transition of supervised learning for
predicting win/loss/tie.
From the result, we can say that, CNN’s prediction
accuracy is significantly improved with graph input,
and GCN shows better prediction performance than
CNN. Our approach improved the value networks’
prediction accuracy.
4.3 AI Players for TUBSTAP
Since we showed the superiority of graph input and
GCN in terms of learning accurate value networks,
next we evaluated the strength of the computer player
when the value network was combined with tree
search. We prepared four players as follows:
1. GCN player: Depth-2 minimax search with the
GCN 4 value network.
2. CNN
g
player: Depth-2 minimax search with the
CNN
g
value network, which use graph represen-
tation as input.
3. CNN
i
player: Depth-2 minimax search with the
CNN
i
value network, which use image represen-
tation as input.
4. MCTS-200 player: MCTS with 200 rollouts.
There are six possible combinations of players.
For each combination, 250 symmetric maps and 250
local-search maps were given. Each map was played
twice for fairness, where the two players alternately
played as the first player. For symmetric maps, we
generated the map for each game. And for local-
search maps, we prepared 250 newly created maps
and shared by all combinations. The results of the
four players playing against each other are shown in
Table 5 and Table 6, denoted by winning ratio (win-
loss-tie), where a tie was counted as a half win. Wins
and losses are from the views of the players in the first
column. The average computation time to decide the
next move in the initial maps (when both sides had all
three units) is also shown for reference.
In symmetric maps, from the result, we can find
that the CNN
g
player was stronger than the CNN
i
player. GCN player’s superiority is not obvious when
Graph Convolutional Networks for Turn-Based Strategy Games
559

Table 6: Results of game matches between 4 players on local-search maps. The winning ratios, win-loss-tie counts and avg.
thinking time in the initial maps.
vs GCN player CNN
g
player CNN
i
player MCTS-200 player avg. thinking time
GCN player -
59.4%
(213-119-168)
78.3%
(356-73-71)
64.0%
(315-175-10)
3.64s
CNN
g
player 40.6% -
72.9%
(306-77-117)
39.6%
(182-286-32)
3.98s
CNN
i
player 21.7% 27.1% -
18.9%
(93-404-3)
4.15s
MCTS-200 player 36.0% 60.4% 81.1% - 5.54s
the opponent is a CNN
g
player but still gets an over-
half winning ratio. Even though the result of direct
matching on GCN player and CNN
g
player was not
clear, when playing against other players, GCN player
performed better, and the differences were clear. So
we can say that GCN player had the best playing
strength in these three players. The result is similar to
prediction accuracy, where GCN is better than CNN
g
,
and CNN
g
is better than CNN
i
.
In local-search maps, results were similar to sym-
metric maps. The graph input improved CNN’s play-
ing strength, and GCN player showed the best perfor-
mance in game playing. With the results from these
two kinds of maps, we can say that our graph repre-
sentation improved the CNN’s playing strength, and
GCN showed its advantage over CNN in our experi-
ment.
4.3.1 Experiment on Different Map Size
As we mentioned in Section 3.1, it is also possi-
ble to apply our proposed methods to maps with
different sizes. We tested the GCN player against
the MCTS-200 player in larger (10 ×10) symmetric
map. 250 maps were newly generated, and each map
was played twice, where the two players alternately
played as the first player. In these 500 games, the
GCN player won 296 games, lost 89 games, and tied
115 games. The average thinking time in initial board
for the GCN player was 1.65s, and the average think-
ing time for the MCTS-200 player was 5.76s. The
results showed that our proposed methods could work
well even in the untrained larger map size.
5 CONCLUSION AND FUTURE
WORK
This paper studied TBS games through an academic
platform TUBSTAP. We proposed to use graphs to
represent game states and employed CNNs or GCNs
to learn state evaluations (i.e., value networks) by su-
pervised learning. We further combined the value net-
works into a modified minimax search that one edge
represents one action of one unit. The experimen-
tal results showed that graph representation improved
the prediction ability for CNN, and GCN obtained the
best prediction accuracy. When incorporating trained
networks into the minimax search with depth 2, the
GCN player obtained the highest winning ratio among
all tested players.
There are many experiments and implementations
to be done in the near future. First, since only a lim-
ited variety of unit types and terrains were used in
this paper, it would be valuable to investigate the per-
formance of GCN on more complex maps. The next
issue is that a minimax search with a depth of 2 is not
enough, but it is also difficult to search any deeper.
The reason is many possible moves, including bad
ones, and prioritization using a policy network would
be effective. Hence, thirdly, it would be promising to
use graph input and GCN for AlphaZero-like learn-
ing, which learns value and policy simultaneously
while playing against itself.
REFERENCES
Browne, C. B., Powley, E., Whitehouse, D., Lucas, S. M.,
Cowling, P. I., Rohlfshagen, P., Tavener, S., Perez,
D., Samothrakis, S., and Colton, S. (2012). A survey
of monte carlo tree search methods. IEEE Transac-
tions on Computational Intelligence and AI in games,
4(1):1–43.
Derrow-Pinion, A., She, J., Wong, D., Lange, O., Hes-
ter, T., Perez, L., Nunkesser, M., Lee, S., Guo, X.,
Wiltshire, B., et al. (2021). Eta prediction with
graph neural networks in google maps. arXiv preprint
arXiv:2108.11482.
Fujiki, T., Ikeda, K., and Viennot, S. (2015). A platform
for turn-based strategy games, with a comparison of
monte-carlo algorithms. In 2015 IEEE Conference on
Computational Intelligence and Games (CIG), pages
407–414. IEEE.
Kayed, M., Anter, A., and Mohamed, H. (2020). Classi-
fication of garments from fashion mnist dataset using
cnn lenet-5 architecture. In 2020 International Con-
ference on Innovative Trends in Communication and
Computer Engineering (ITCE), pages 238–243. IEEE.
ICAART 2022 - 14th International Conference on Agents and Artificial Intelligence
560

Table 7: The terrain factors and moving cost in TUBSTAP.
Plain Fortress Mountain Forest Sea Road
terrain factor for F,A 0 0 0 0 0 0
terrain factor for P,C,R,I 1 4 4 3 0 0
moving cost for F,A 1 1 1 1 1 1
moving cost for P,C,R 1 1 - 2 - 1
moving cost for I 1 1 2 1 - 1
Kimura, T. and Ikeda, K. (2020). High-performance al-
gorithms using deep learning in turn-based strategy
games. In ICAART (2), pages 555–562.
Kipf, T. N. and Welling, M. (2016). Semi-supervised clas-
sification with graph convolutional networks. arXiv
preprint arXiv:1609.02907.
Kocsis, L. and Szepesv
´
ari, C. (2006). Bandit based monte-
carlo planning. In European conference on machine
learning, pages 282–293. Springer.
LeCun, Y., Bengio, Y., and Hinton, G. (2015). Deep learn-
ing. nature, 521(7553):436–444.
Meqdad, M. N., Al-Akam, R., and Kadry, S. (2020).
New prediction method for data spreading in so-
cial networks based on machine learning algorithm.
TELKOMNIKA, 18(6):3331–3338.
Muto, K. and Nishino, J. (2016). Fuzzy evaluation of
macroscopic situation for turn based strategic games.
In 2016 Joint 8th International Conference on Soft
Computing and Intelligent Systems (SCIS) and 17th
International Symposium on Advanced Intelligent
Systems (ISIS), pages 1–4. IEEE.
Nintendo (1988). Wars (series). https://en.wikipedia.org/
wiki/Wars\ (series). accessed 2021-11-08.
Nintendo (2019). Nintendo switch fire emblem: Three
houses. https://www.nintendo.com/games/detail/fire-
emblem-three-houses-switch. accessed 2021-11-08.
Pipan, C. M. (2021). Application of the monte-carlo tree
search to multi-action turn-based games with hidden
information. Theses and Dissertations. 4906.
Russell, S. and Norvig, P. (2010). Artificial Intelligence: A
Modern Approach, pages 163 – 167. Prentice Hall, 3
edition.
Sato, N. and Ikeda, K. (2016). Three types of forward
pruning techniques to apply the alpha beta algorithm
to turn-based strategy games. In 2016 IEEE Con-
ference on Computational Intelligence and Games
(CIG), pages 1–8. IEEE.
Silver, D., Hubert, T., Schrittwieser, J., Antonoglou, I., Lai,
M., Guez, A., Lanctot, M., Sifre, L., Kumaran, D.,
Graepel, T., et al. (2018). A general reinforcement
learning algorithm that masters chess, shogi, and go
through self-play. Science, 362(6419):1140–1144.
Silver, D., Schrittwieser, J., Simonyan, K., Antonoglou, I.,
Huang, A., Guez, A., Hubert, T., Baker, L., Lai, M.,
Bolton, A., et al. (2017). Mastering the game of go
without human knowledge. nature, 550(7676):354–
359.
White, D. (2003). Battle for wesnoth. https://en.wikipedia.
org/wiki/The\ Battle\ for\ Wesnoth. accessed 2021-
11-08.
Wu, Z., Pan, S., Chen, F., Long, G., Zhang, C., and Philip,
S. Y. (2020). A comprehensive survey on graph neural
networks. IEEE transactions on neural networks and
learning systems, 32(1):4–24.
Xiong, Y., Zhang, Y., Kong, X., Chen, H., and Zhu, Y.
(2021). Graphinception: Convolutional neural net-
works for collective classification in heterogeneous in-
formation networks. IEEE Transactions on Knowl-
edge and Data Engineering, 33(5):1960–1972.
Yang, J., Zhou, W., Wei, L., Lin, J., Han, J., and Hu, S.
(2020). Re-gcn: Relation enhanced graph convolu-
tional network for entity alignment in heterogeneous
knowledge graphs. In International Conference on
Database Systems for Advanced Applications, pages
432–447. Springer.
APPENDIX
In this appendix, the detailed setting is described,
which is a bit far from the central issue of this pa-
per. The following two paragraphs introduce the ter-
rain factor of TUBSTAP and the implementation of
the MCTS player used in the experiments.
In TUBSTAP maps, there are different terrains, as
listed in Table 7. In our experiments, only the plain
terrain was employed. Two sets of rules relating to
terrains are the terrain factor and the moving cost. The
terrain factor is one of the elements deciding the dam-
age of an attack, as shown in Eq. 1 in Section 2.1. A
higher terrain factor means that it is better for defense.
The moving cost, along with the mobility of a unit,
decides how far the unit can go. With a higher mov-
ing cost, a unit takes more moves to travel the same
distance.
The MCTS players in this research are MCTS
with upper confidence bound (UCB) (Kocsis and
Szepesv
´
ari, 2006). Where the coefficient for UCB is
√
2. It contains four steps, selection, expansion, sim-
ulation, and backpropagation. In the selection step,
we use the UCB to choose which node to expand. In
the expand step, the selected node would be fully ex-
panded, which means all valid child nodes would be
created. In the simulation step, we employ a random
player, and the simulation ends till the game end. In
the backpropagation step, nodes’ value is updated by
the result in the simulation.
Graph Convolutional Networks for Turn-Based Strategy Games
561
