
Developing and Experimenting on Approaches to
Explainability in AI Systems
Yuhao Zhang
1,2
, Kevin McAreavey
2
and Weiru Liu
2
1
Tencent AI Lab, Shanghai, China
2
Department of Engineering Mathematics, University of Bristol, U.K.
Keywords:
Explainable AI, Explainable Machine Learning, Global And Local Explanations, Counterfactual Explanations.
Abstract:
There has been a sharp rise in research activities on explainable artificial intelligence (XAI), especially in the
context of machine learning (ML). However, there has been less progress in developing and implementing
XAI techniques in AI-enabled environments involving non-expert stakeholders. This paper reports our inves-
tigations into providing explanations on the outcomes of ML algorithms to non-experts. We investigate the
use of three explanation approaches (global, local, and counterfactual), considering decision trees as a use
case ML model. We demonstrate the approaches with a sample dataset, and provide empirical results from a
study involving over 200 participants. Our results show that most participants have a good understanding of
the generated explanations.
1 INTRODUCTION
Overview: Artificial intelligence (AI) technology is
increasingly important in many sectors (Russell and
Norvig, 2020). At the same time, there is an emerg-
ing demand for transparency in deployed AI systems,
including via explanations of AI decisions (Goodman
and Flaxman, 2017). There is no standard or generally
accepted definition of explainable artificial intelli-
gence (XAI), despite the dramatic increase in research
interest around the topic (Lipton, 2018). Broadly
speaking, XAI can be understood as comprising any
process/tool/method that enables stakeholders of AI-
enabled systems to comprehend and trust the system.
AI-enabled systems are being developed and de-
ployed in many settings, while AI systems are in-
creasingly expected to operate autonomously (Biran
and Cotton, 2017). Machine learning (ML) in particu-
lar has been used for a wide range of tasks, and is now
pervasive in everyday life. The need for stakeholders
to understand and trust the outputs of AI systems (e.g.
recommendations or actions) is now a critical issue.
Conversely, a lack of transparency and explainabilty
is a major barrier to further adoption AI-enabled sys-
tems (Gunning and Aha, 2019).
In many cases, recommendations and actions by
AI systems can be vital (e.g. in security domains or
medical diagnosis). Users not only need to know the
output, but also know why that output was given (Tjoa
and Guan, 2021). For AI applications where acting on
the outputs of an AI system entails high risk, there is
a need for proper understanding of the outputs in or-
der to mitigate those risks. If an AI system operates
in human-agent environments, it is crucial for expla-
nations to be accepted before actions are taken. For
example, if an ML model is used to evaluate CVs for
jobs, an administrator needs to know whether a judge-
ment has been influenced by gender or ethnic back-
ground (Boehmke and Greenwell, 2019).
In the AI literature interpretability and explain-
ability are separate but closely related concepts. The
former characterises models that are understandable
due to inherent characteristics (Gleicher, 2016). The
latter characterises interfaces between the outputs of
an AI system and its stakeholders. Interpretability can
be seen as the ability to provideß meaning in under-
standable terms to a human, whilst explainability is
associated with the notion of explanation as an inter-
face between humans and a decision-maker (Guidotti
et al., 2018; Arrieta et al., 2020).
Background on XAI: Historically, explanation meth-
ods can be found in the early development of rule-
based expert systems and Bayesian networks, such
as the work reported by Davis et al. (1977). More
recently, there has been a focus on explanations for
both white-box and black-box ML models (Lipton,
2018). These can be differentiated into intrinsic and
518
Zhang, Y., McAreavey, K. and Liu, W.
Developing and Experimenting on Approaches to Explainability in AI Systems.
DOI: 10.5220/0010900300003116
In Proceedings of the 14th International Conference on Agents and Artificial Intelligence (ICAART 2022) - Volume 2, pages 518-527
ISBN: 978-989-758-547-0; ISSN: 2184-433X
Copyright
c
2022 by SCITEPRESS – Science and Technology Publications, Lda. All rights reserved

post-hoc methods, such as Partial Dependency Plots,
LIME, and Shapley (Boehmke and Greenwell, 2019).
With these methods explanations are formed around
different aspects of a model, such as feature summary
statistics, feature summary visualisation, and counter-
factual datapoints.
Challenges in XAI: Das and Rad (2020) argue that
XAI approaches should be evaluated and selected
carefully for different applications. User studies have
indicated that typical explanations may not be suf-
ficient to help users make decisions. For example,
XAI in critical applications may be impeded by hu-
man bias in interpreting visual explanations. Compu-
tational complexity and necessary performance opti-
misations may also harm interpretability of models.
Human-grounded evaluation has made progress
recently, and indications are that the XAI landscape
is proceeding in a promising prospect (Das and Rad,
2020). Nonetheless, XAI may still benefit from a
generally recognised and accepted concept of explain-
ability as well as appropriate evaluation methods. A
common foundation would be beneficial to existing
and emerging techniques and methods contributed by
the community. Such a foundation might provide a
unified structure for XAI systems and their evalua-
tion (Arrieta et al., 2020). Since the intended stake-
holders of XAI are typically humans, evaluation with
humans is important to demonstrate the usefulness of
XAI methods and systems. These evaluations may in
turn benefit from common evaluation metrics. For ex-
ample, it was suggested by Arrieta et al. (2020) that a
metric or group of metrics might be used to compare
the extent to which an XAI model fits the concept of
explainability. This is in contrast to the classic met-
rics (accuracy, F1, sensitivity, etc.) that can describe
to what extent a model performs in a definite aspect
of explainability (Arrieta et al., 2020).
Contributions: Given these challenges, in this paper
we investigate existing XAI tools/platforms that are
applicable to both white- and black-box ML models.
We investigate and experiment using the XAI tools
InterpretML, LIME, and DICE, while considering de-
cision trees as a use case ML model. In particular, we
use these tools: (i) to generate global explanations;
(ii) to generate local explanations using feature im-
portance; (iii) to generate counterfactual explanations
using feature importance when selecting counter dat-
apoints. We also use these tools as part of an expla-
nation prototype that we evaluate in a study involving
over 200 participants.
The rest of the paper is organised as follows: in
Section 2 we introduce our dataset and XAI tools un-
der consideration, in Section 3 we demonstrate global
and local explanations, in Section 4 we demonstrate
counterfactual explanations, in Section 5 we present
our evaluation, and in Section 6 we conclude.
2 PRELIMINARIES
Dataset: We use a dataset from Kaggle
1
on churn (i.e.
attrition) modeling. The dataset includes 14 columns
and 10,000 rows. The columns include RowNumber,
CustomerId, Surname, CreditScore, Geography, Gen-
der, Age, Tenure, Balance, NumOfProducts, HasCr-
Card, IsActiveMember, EstimatedSalary, and Exited.
The Exited column is the label column with value 1
for stay and 0 for exit.
To build an ML model, we use both Azure Ma-
chine Learning Studio
2
and Scikit-learn to generate a
decision tree. AzureML Studio can provide visualisa-
tions of the dataset and the structure of the decision
tree model. Scikit-learn typically generates a more
complex decision tree from the same dataset. We use
both a simple ML model (a simple tree) and a rela-
tively complex model (a complex tree) in order to in-
vestigate implications on explanations. Since we are
not concerned with ML itself, we will not detail how
to run these tools to generate decision trees, but as-
sume the decision tree has been constructed. For XAI
techniques, we start with InterpretML,
3
which offers
methods to explain both white-box (i.e. built with an
interpretable algorithm) and black-box ML models.
LIME and DICE algorithms, PDP and other built-in
functions, as well as their extensions are used to gen-
erate global, local, and counterfactual explanations.
Examples: Let us take the 1st (customer A) and the
4th (customer D) instances in Figure 1 as examples to
illustrate the outcomes of predictions from a decision
tree by following tree branches.
Figure 1: Example customer instances.
Customer A is aged 43 and has been using only
one product from the bank, but has been an active
member. In addition, customer A is French (this is
where bias might come in when using such algorithm
to build the model), thus A is not likely to Churn. The
decision path is shown in Figure 2.
1
https://www.kaggle.com/santoshd3/bank-customers
2
https://studio.azureml.net/
3
https://github.com/interpretml/interpret
Developing and Experimenting on Approaches to Explainability in AI Systems
519

Figure 2: Decision path for customer A.
Customer D is aged 47, has been using only one
product, and is not an active member. It is concluded
that D is likely to Churn. The decision path is shown
in Figure 4.
Figure 3: Decision path for customer D.
Explanations: First and foremost, what is an expla-
nation? Miller (2019) states:
To explain an event is to provide some in-
formation about its causal history. In an act
of explaining, someone who is in possession
of some information about the causal history
of some event — explanatory information, I
shall call it — tries to convey it to someone
else. (Miller, 2019)
This is a definition of explanations from philosophy.
When it comes to the relationship between human and
AI systems, an AI system plays a role of “someone
who is in possession of the explanatory information”
and the human is the who that information should be
conveyed to. Thus, before providing an explanation,
we need to know what information is possessed by an
AI system but not by the human.
Contextual Background: A decision tree model usu-
ally outputs the importance of features along with a
tree model, which can be used to order the sequence
of features when selecting which feature to use for
explanation. Feature importance finds the most influ-
ential features in contributing to the model’s overall
accuracy or for a particular decision (Boehmke and
Greenwell, 2019). One of the difficulties is that a fea-
ture may appear multiple times in a tree (or contribut-
ing to the split of a tree multiple times). Thus, how
to summarise the overall contribution of a feature for
a specific instance prediction along a tree path is a
challenging problem. One possible solution accord-
ing to Boehmke and Greenwell (2019) is:
ˆ
f (x) = ¯y +
D
∑
d=1
split.contrib (d, x)
= ¯y +
p
∑
j=1
feat.contrib ( j, x)
(1)
Equation 1 says that the prediction of instance x, de-
noted by
ˆ
f (x), corresponds to the accumulation of
contributions of every feature (feat.contrib( j, x)) from
a total of p features that appear on the path for the in-
stance plus the mean of the target outcome (¯y).
A feature might be used for more than one split or
not at all. We can add the contributions for each of the
p features and get an interpretation of how much each
feature has contributed to a prediction (Boehmke and
Greenwell, 2019). Therefore, an explanation is not
simply a traversal of a decision path in a tree but is
from the joint consideration of a feature’s importance
and its accumulated contributions along the path.
Explanation Optimisation: For black-box ML mod-
els, some research has sought to simplify models
in order to make them more transparent, e.g. by
simplifying a neural network model into a decision
tree. In this paper, although we take a decision tree
model as a use case, but want to investigate and de-
velop explanation approaches that are more generic
and applicable to other ML models, including black-
box models. We thus investigate post-hoc explana-
tion approaches which can be either model-specific
or model-agnostic (Boehmke and Greenwell, 2019).
Feature importance and model simplification methods
are two broad kinds of model-specific approaches.
Model-agnostic approaches include a range of alter-
native methods, including visual explanations and lo-
cal explanations (see Figure 4, Boehmke and Green-
well, 2019).
Feature extraction can be applied to both model-
agnostic and model-specific approaches, which
makes it suitable in the next step of generating model
interpretations before moving to the construction of
explanations for stakeholders. Explanations based on
feature extraction approaches can explain how each
feature performs after the model has already been
built (which might not be the actual principle of how
ICAART 2022 - 14th International Conference on Agents and Artificial Intelligence
520
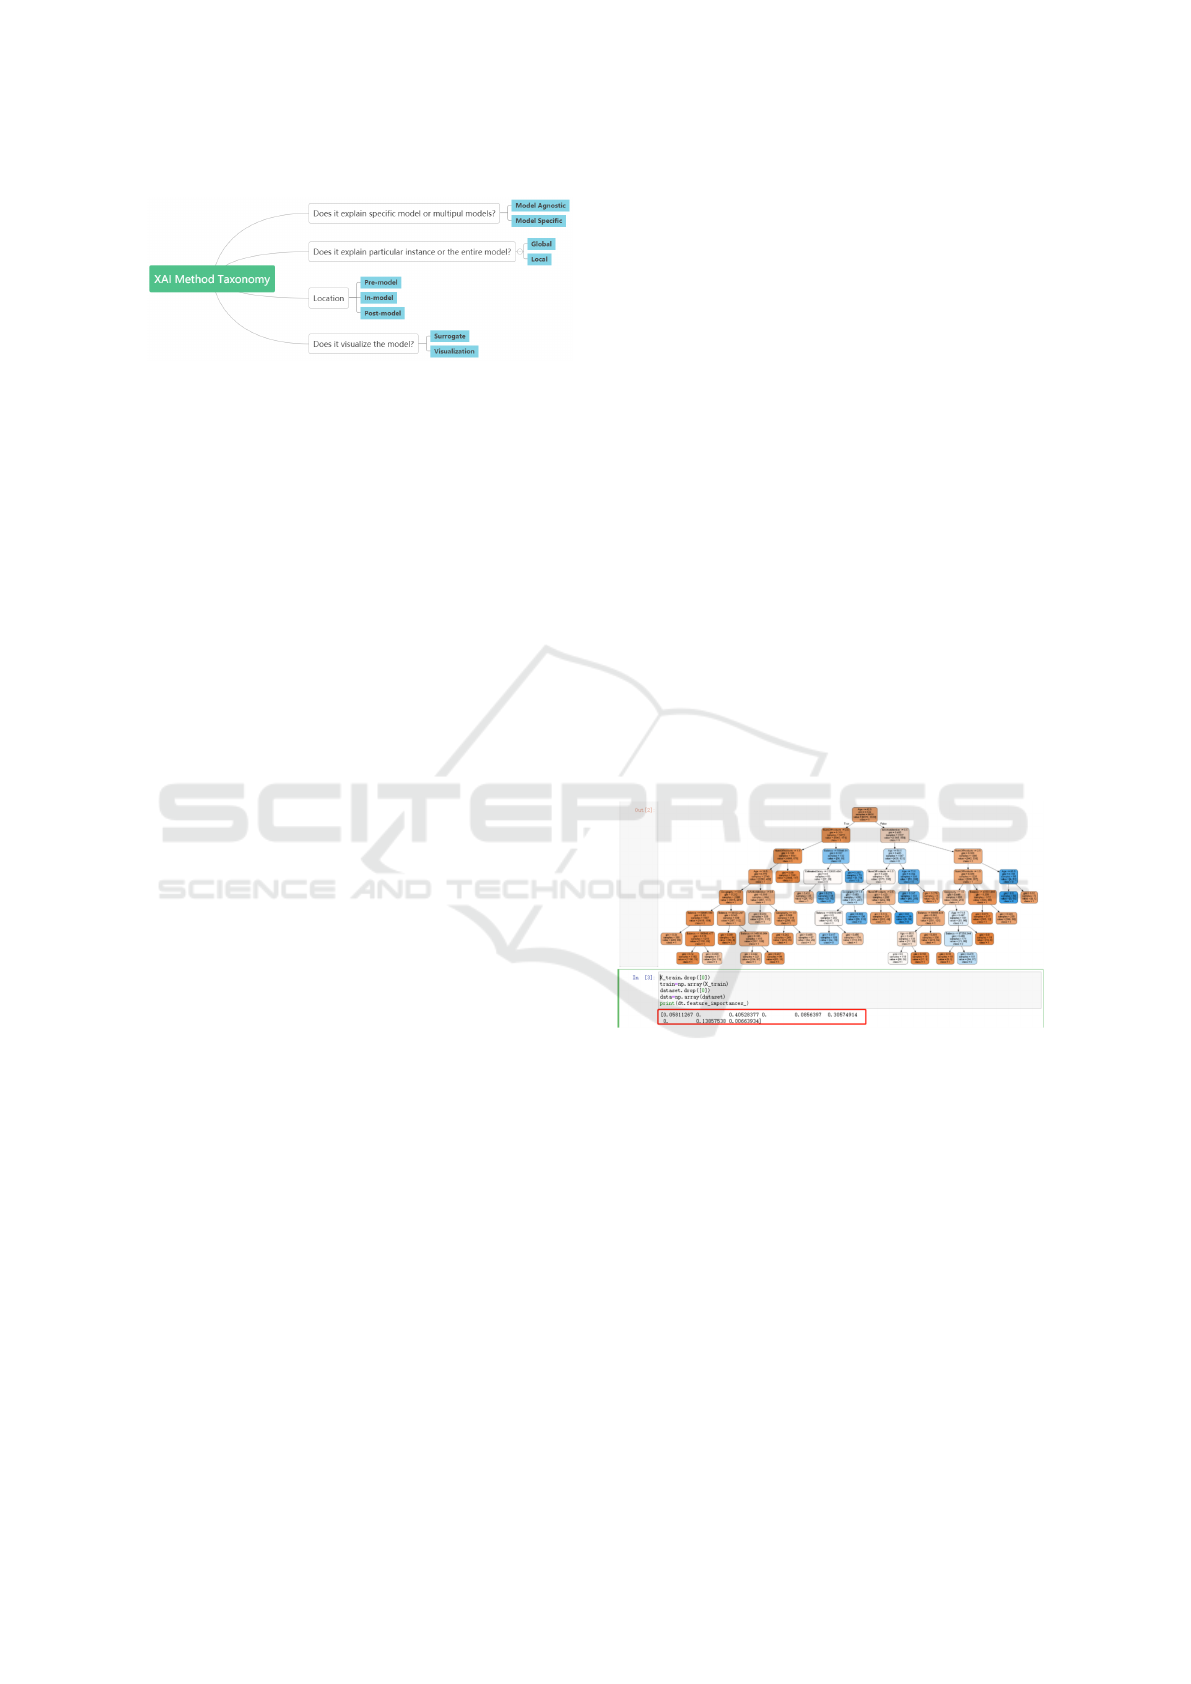
Figure 4: XAI method taxonomy.
the algorithm works inside the original model). Nev-
ertheless, it can give indirect and understandable ex-
planations to stakeholders, and can be further divided
into global or local explanations.
3 GLOBAL VS. LOCAL
EXPLANATIONS
A global explanation aims to give an overall explana-
tion to a model, whether it is to make a black-box al-
gorithm interpretable or to make a model explainable
as a whole, while a local explanation is to provide a
tailored explanation to a single specific instance.
3.1 Global Explanation
What is a Good Explanation? Let us take an exam-
ple from (Hoffman et al., 2018) to illustrate a global
explanation which has been assessed as a relatively
‘good’ explanation:
How do computers predict hurricanes?
• Explanation Judged a priori to be Relatively
“Good”
– Computers have a mathematical model of
the atmosphere that divides the world into
many small regions, each just a few square
kilometres.
– Each region is defined in terms of its air
pressure, temperature, winds, and mois-
ture.
– The computer calculates what will hap-
pen at the boundaries of each region. For
example, strong winds in one region will
move air into an adjacent region.
– These calculations must be performed for
every boundary between all the regions.
This allows the prediction of the path a
hurricane will take.
• Explanation Judged a prior to be Relatively
“Bad”
– The computers have a database of all pre-
vious hurricanes and the paths that they
followed.
– Once a hurricane is located, using a satel-
lite image, the computer accesses the
database and determines the path that was
most frequently taken by hurricanes hav-
ing that initial location.
– This process is repeated once every hour,
tracking the hurricane as it moves.
– The computers can also tell when the
winds and rain will impact the land, and
that is when the hurricane warnings are is-
sued.
(Hoffman et al., 2018)
The good explanation seems to have highlighted fea-
tures much early on (“each region is defined in terms
of its air pressure, temperature, winds, and moisture”)
in contrast to the bad explanation.
Global Analysis: Finding a sequence of features
based on their importance is necessary when giving
global explanations, which can be achieved by using
the built-in functions of a decision tree algorithm, for
instance as shown in Figure 5.
Figure 5: Visualisation of the tree model.
From the plot we can see the importance of each
feature: ‘Geography’ = 0.05, ‘Gender’ = 0.00, ‘Age’
= 0.40, ‘Tenure’ = 0.00, ‘Balance’ = 0.08, ‘NumOf-
Products’ = 0.30, ‘HasCrCard’ = 0.00, ‘IsActive-
Member’ = 0.13, ‘EstimatedSalary’ = 0.00. Then a
sequence of features according to their importance
could be: ‘Age’ > ‘Number of Products’ > ‘IsAc-
tiveMember’ > ‘Balance’ > Others.
We can also gain relationships between features
and a prediction result by using the partial depen-
dence plot (PDP (Friedman, 2001)). Here we take the
first and the second important features as an example.
As shown in Figure 6, when other features (val-
ues) are unchanged, a customer with the age between
45-75 is more likely to stay instead of churn. Also,
if the number of products a customer has is equal to
Developing and Experimenting on Approaches to Explainability in AI Systems
521

Figure 6: PDP plot of the model.
or more than 2, the customer is more likely to stay.
These figures and the conclusions can be used to give
both global and local explanations of the model. Ac-
cordingly, when giving global explanations, the im-
portance of features are considered first then corre-
lations between the most important features and the
outcome can be further taken into account.
3.2 Local Explanation
Local explanation is different from global expla-
nation, it focuses exactly on single predictions.
Specifically, local explanation can be further cate-
gorised into approximation and example-based ap-
proaches (Verma et al., 2020). Approximation ap-
proaches sample new datapoints in the vicinity of
the datapoint whose prediction from the model needs
to be explained, and then fit a linear model (e.g.
LIME (Ribeiro et al., 2016)) or extract a rule set from
them (e.g. Anchors (Ribeiro et al., 2018), (Verma
et al., 2020)). Example-based approaches either se-
lect datapoints with the same prediction as that of the
explainee’s datapoint, or datapoints with the counter-
prediction of the explainee datapoint. The latter type
of datapoints shall still be close to the explainee data-
point and are termed as “counterfactual” explanations
(see the next section).
LIME: LIME is an algorithm that can explain the
predictions of any classifier or regressor in a faith-
ful way, by approximating it locally with an inter-
pretable model (Ribeiro et al., 2016). The algorithm
can approximate an instance by creating new data-
points around the explainee datapoint to provide a lin-
ear model. The model allows us to get an insight of
features and how each feature contributes to the pre-
diction of the instance.
The system has given the prediction of this in-
stance as ‘not Churn’.
According to Figure 7, the plot at the left is the
probabilities of the predictions. The tree-like plot in
the middle is the comparative plot of the contributions
of each feature. The table on the right represents the
Table 1: An instance of the customer data.
Geography Gender Age
2 1 54
Tenure NumOfProducts HasCrCard
3 3 1
IsActiveMember EstimatedSalary Balance
0 96013.5 125889.3
Figure 7: LIME plots.
value of each feature that has been used in sequence
by their contributions. In detail, the features in blue
mean their contributions to the prediction is negative,
whilst the features in orange mean their contributions
are positive. In addition, if a trained model is a multi-
class classification, the plot of the tree-like part in
LIME can be done through a series of similar binary
trees, each of which is for one class label as A or not
A.
Explanations with LIME: LIME is a post-hoc in-
terpretable ML method and thus can be adopted for
both white-box and black-box models. The outputs
of LIME are the coefficients of features, and these co-
efficients represent the contributions of features to a
prediction. Feature contributions can be used to or-
der features when generating explanations. A sample
local explanation might look like:
Because the customer’s NumOfProducts=2,
secondly, the 32.00 < Age <= 37.00,
thirdly, the Balance <= 0.00 the proba-
bility of the customer to churn is 0.92
4 COUNTERFACTUAL
EXPLANATION
Global and local explanations we gave are the ex-
planations based on analysing the importance of fea-
tures or certain properties of the instances themselves.
Such explanations are straightforward and exactly re-
veal how a system has taken features’ importance into
consideration when ML model. But we also need to
consider other factors, which leads us to consider ex-
planatory relevance. The idea of explanatory rele-
vance was extended in (Verma et al., 2020) for XAI
based on an early work from (Hesslow, 1988): “the
effect or the explanandum; i.e., the event to be ex-
plained, should be construed, not as an object’s hav-
ICAART 2022 - 14th International Conference on Agents and Artificial Intelligence
522

ing a certain property, but as a difference between ob-
jects with regard to that property.”
There are many examples that have been men-
tioned in the literature about the importance of coun-
terfactual when giving the explanations. The most
classical example is for application of a loan. A cus-
tomer may want to know the reason why its loan ap-
plication has been refused by a system, not just as an
explanation of what features have been used to derive
a conclusion, but also what else can be done to make
the result different. In this case, compared to the tra-
ditional explanations the counterfactual explanation is
more acceptable and cognitively less demanding to
both questioner and explainer (Lewis, 1987). (Lipton,
1990) proposes that explanation selection is best de-
scribed using the Difference Condition: “To explain
why P rather than Q, we must cite a causal difference
between P and not-Q, consisting of a cause of P and
the absence of a corresponding event in the history
of not-Q”. In (Verma et al., 2020), it was suggested
that there is a difference between Lewis’s idea, stat-
ing that the explanation should be a certain event, and
Lipton’s explanation which emphasises the difference
between the fact and the counter-fact.
Contextual Methods: A recent review paper has con-
cluded the five optimisation objectives of counterfac-
tual explanation, which are Sparsity, Data Manifold
closeness, Causality, Feature-correlation, and Out-
lier risk (Verma et al., 2020). Another perspective
has been mentioned which is Actionability (Kanamori
et al., 2020). We do not regard actionability as an ob-
jective of explanations and thus will omit it from fur-
ther discussions. So, only the first five qualities will
be taken into consideration later when adopting the
counterfactual methods.
There are many ways to generate counterfactual
explanations. In this paper, we focus on generating
explanations with counter-datapoint instead of find-
ing the correlation between different facts. Since we
only consider binary classification problems here (e.g.
A or not A), defining distances between a counter-
datapoint to the explainee-datapoint can be achieved
using some known distance measures, such as:
Euclidean: minimise magnitude of each per-
turbation
Cosine: minimise change in relationship be-
tween features
Manhattan: minimise proportion of features
that are perturbed
Mahalanobis: minimise magnitude of each
perturbation while accounting for correla-
tion between variables
(Lucic et al., 2019)
A counterfactual explanation using counter-
datapoint is usually achieved by finding the clos-
est counter-datapoint around the explainee datapoint.
However, there might be many different counter-
datapoints which have the same minimal distance to
the explainee datapoint. When this happens, feature
importance and/or user’s needs can influence how an
explanation can be formed. As pointed by (Wachter
et al., 2017): “in many situations, providing sev-
eral explanations covering a range of diverse coun-
terfactuals corresponding to relevant or informative
‘close possible worlds’ rather than ‘the closest pos-
sible world’ may be more helpful.”
What is more, an ML model itself might not be
trustworthy when giving a specific counter-datapoint.
In other words, we cannot just use the closest counter-
datapoint as the counterfactual datapoint based only
on the trained model but ignoring the potential value
of the original data. Thus, we need to use the dat-
apoint that is on the data manifold (in other words,
the counter-datapoint should follow the trends of dat-
apoints of the original dataset).
Figure 8: Counterfactual explanation using the closest dat-
apoints.
Implementation: The cosine distance is mostly
adopted when the model is built on the purpose of text
analysis. Among the other three distance standards,
the Euclidean distance is the most direct distance be-
tween two points which is used in this paper and it
normalises feature value ranges as shown in Equation
2.
d
x
i
, x
0
=
∑
k∈F
x
i,k
− x
0
k
2
std
j∈P
x
j,k
(2)
Here, ‘k” and “F” stand for feature “k” in the fea-
ture set “F”. “std” stands for the standard deviation.
The distance between x
i
and x
0
is equal to the sum-
mary of distances between their features divided by
the standard deviation of them and this is used in
DICE (Mothilal et al., 2020). it can be adopted on
both white-box and black-box models, and we use the
Developing and Experimenting on Approaches to Explainability in AI Systems
523

DICE package to give counterfactual explanations on
the decision tree model in this paper.
Figure 9: Counterfactual explanations in DICE without fea-
ture value restrictions.
Here we use the instance in Figure 9 as an exam-
ple to give two counterfactual instances. In this fig-
ure, the middle row represents the feature values of
the explainee datapoint and the bottom rows represent
two counter-datapoints. In these two rows, features
with “-” mean that these features have the same val-
ues as the explainee datapoint. Accordingly, the fea-
tures with values present are those which are different
from the explainee datapoint’s features. We can see
the original result of prediction is that the customer is
likely to churn (note that for the label “Exited”, “0”
stands for “churn” and “1” stands for “stay”). We
found the counter-datapoints that hypothetically say-
ing that, either its balance can increase to £218638.7,
or its tenure can decrease to 5 plus his balance can
increase to £206156.0, then the customer is not likely
to churn. However, neither Tenure nor Balance is a
feature with a significant contribution to a prediction
in this case. Therefore, we need to consider differ-
ences between the most significant features’ values
when selecting counter datapoints.
Optimisation: In order to give counterfactual expla-
nations with the change of the most important fea-
tures, we need to refer to the feature importance that
we gave in the last section. In (Lewis, 1987), Ramar-
avind et al tested the correlation between feature im-
portance algorithm LIME and SHAP with the coun-
terfactual methods DICE and WatcherCFfeature, and
concluded that “importance induced from DICE and
WachterCF can be highly correlated with LIME and
SHAP on low-dimensional datasets such as Adult-
Income, they become more different as the feature
dimension grows (Lewis, 1987).” In this study, the
dataset we use as an example has nine features which
is much less than that has been mentioned in (Lewis,
1987) where the number of features is more than 200.
Accordingly, we modified LIME considering feature
importance to constraint how counter-datapoints se-
lection can be optimised. Figure 10 shows counter-
datapoints before constrains and Figure 11 shows how
optimised counter-datapoints were selected. AS we
can see, in Figure 11, the range on Age from counter
datapoints is reduced to be closer to that of the ex-
plainee datapoint.
Figure 10: Counterfactual explanations with few or no con-
straints on features values.
Figure 11: Counterfactual explanations with constraints im-
portant features.
As such, using the counterfactual datapoint gener-
ated, it is possible to further output local explanations
with these datapoints as the counterfactual reference
as illustated below:
Hypothetically, if their Age is 49.0,
and their NumOfProducts is 3.0, they
will be not likely to churn.
5 EVALUATION
“The property of ‘being an explanation’ is not a prop-
erty of statements, it is an interaction” (Kanamori
et al., 2020). Accordingly, for most of the time, it
can be a suitable evaluation tool to evaluate the ex-
planation by directly asking for feedback from users
through delivering questionnaires.
We used an existing evaluation scale Explanation
Satisfaction Scale which has been used to collecting
judgments by research participants feedback after be-
ing given the explanations. “The Explanation Satis-
faction Scale was based on the literatures in cognitive
psychology, philosophy of science, and other perti-
nent disciplines regarding the features that make ex-
planations good.” (Kanamori et al., 2020)
Since the dataset we used is about a banking sys-
tem, we divided participants into two groups: non-
experts and users with banking business experience.
An online questionnaire website Wenjuanxing
4
was
4
https://www.wjx.cn
ICAART 2022 - 14th International Conference on Agents and Artificial Intelligence
524
used to create the questionnaire and the questionnaire
was first shared with a groups of participants selected
by the first author (with some participants working in
Bank of Communications of China ), then these ini-
tial participants further shared the questionnaire with
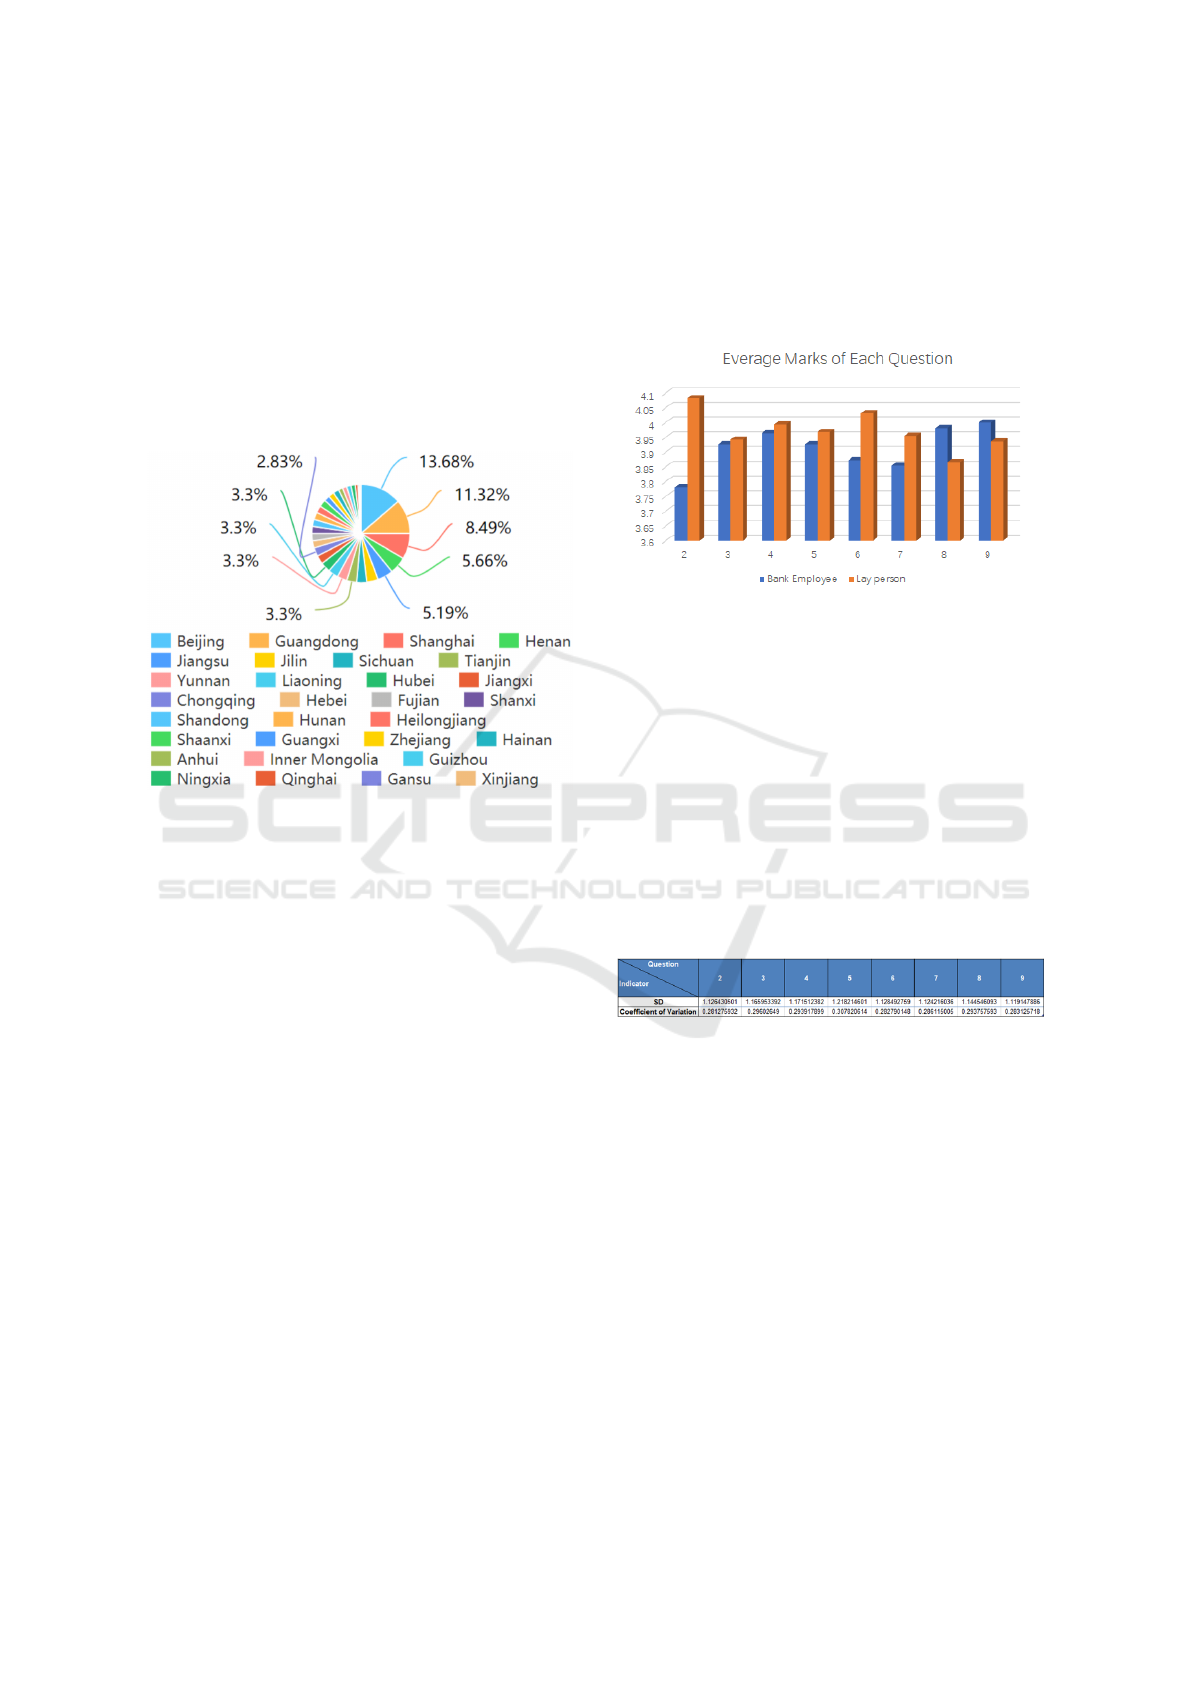
their colleagues and friends. Eventually, 212 ques-
tionnaires were received, 55 of are from banking em-
ployees, and 157 are from random non-experts. They
are from different provinces and cities within China,
and the distribution of the geographical location of
participants is shown below.
Figure 12: Geographical position distribution of partici-
pants.
Evaluation Results: The statistics of the feed-backs
are as follow: we have 9 individual questions, the first
is a YES/NO question and the rest are with scales
from 1 to 5, with 1 the least satisfactory and 5 the
most satisfactory of the system to the question posed.
These questions are:
1. Are you a practitioner in banking-related indus-
tries?
2. Through the output of the system, I can under-
stand how the system works
3. Whether the interpretation of the system output is
satisfactory
4. The explanation given by the system is satisfac-
tory in detail
5. The explanation given by the system is relatively
complete
6. The explanation given by the system told me how
to use it
7. The explanation given by the system satisfies my
curiosity and expectations for the system
8. The explanation about the system made me under-
stand the accuracy of the system’s judgment
9. The explanation about the system allowed me to
know when I can believe it, and on the contrary, it
also lets me know when I can’t believe it
Among the 212 participants, 74.06% are from non-
banking sector. The average of the average score of
each question is summarised in Figure 13:
Figure 13: The visualisation represents the average point of
each question.
We can see that the average scores of each ques-
tion both for bank employees and non-experts are
all above 3.5, which means the satisfaction degree is
overall above average. Interestingly, for the 2nd ques-
tion, bank employees feel they have less understand-
ing of the system than the non-expert group. For the
rest of the questions, the average scores of the remain-
ing questions are not dramatically different. The 4th
question stands out as the one which is equally ap-
preciated by both groups. We also calculated the SD
and Coefficient of Variation of the scores from each
question to see the differences between the scores The
result is shown in the table below.
Figure 14: SD and coefficient of variation of the result.
We can see from the table, the participants’ degree
of understanding of the explanation varies consider-
ably. Overall, for all of the eight questions, their co-
efficient variations are higher than 28%. Specifically,
the fourth question has the highest SD and coefficient
of variation which are 1.22 and 30.78% respectively.
Which mean the participants have considerably dif-
ference in understanding of The explanation of how
the system works seems complete. And the seventh
question The explanation of the system shows me how
accurate the system is is of the second highest SD and
coefficient of variation. These statistical results con-
firms the expectation that an explanation has different
effects to different group of users.
Developing and Experimenting on Approaches to Explainability in AI Systems
525

6 CONCLUSION
In this paper we reported our investigations into XAI.
We focused on a decision tree for a sample dataset as a
use case to illustrate existing XAI tools/platforms. We
discussed and demonstrated how an explanation can
be constructed at global and local levels, as well as
how such explanations can be further enhanced by us-
ing counterfactural datapoints. Finally, we described
our evaluation methodology and provided an analysis
of participant feedback. Although the work described
here is preliminary, we believe it provides some useful
starting points for researchers who are new to the field
of XAI. Our results show that developing a proper and
easily accessible XAI system and interface is a non-
trivial task. Deep understanding of the AI system be-
ing used, the application domain, and user groups are
all important and may have a significant impact on the
quality and acceptance of research outcomes. There
are several possible avenues for future work:
• Explanation may be more understandable to hu-
mans if they incorporate natural language genera-
tion (NLG) techniques. When implementing XAI
techniques on specific cases, NLG may be used to
improve language in final explanations.
• We only considered counterfactual explanations
in the context of binary classification models. Ad-
ditional methods may be adopted to support multi-
class classification models.
• We only consider explanations for a single (gen-
eral) class of stakeholder. However, explanations
tailored to other specific classes of stakeholder
may be achieved by incorporating preferences or
other background information.
ACKNOWLEDGEMENTS
This work received funding from the EPSRC CHAI
project (EP/T026820/1). The authors thank Marco
Tulio Correia Ribeiro for help with LIME.
REFERENCES
Arrieta, A. B. et al. (2020). Explainable artificial intel-
ligence (XAI): Concepts, taxonomies, opportunities
and challenges toward responsible AI. Information
Fusion, 58:82–115.
Biran, O. and Cotton, C. (2017). Explanation and justifica-
tion in machine learning: A survey. In Proceedings of
the IJCAI’17 Workshop on Explainable Artificial In-
telligence (XAI’17), pages 8–13.
Boehmke, B. and Greenwell, B. (2019). Interpretable ma-
chine learning. In Hands-On Machine Learning with
R. Chapman and Hall/CRC.
Das, A. and Rad, P. (2020). Opportunities and challenges
in explainable artificial intelligence (XAI): A survey.
arXiv:2006.11371.
Davis, R., Buchanan, B., and Shortliffe, E. (1977). Produc-
tion rules as a representation for a knowledge-based
consultation program. Artificial Intelligence, 8(1):15–
45.
Friedman, J. H. (2001). Greedy function approximation: a
gradient boosting machine. Annals of Statistics, pages
1189–1232.
Gleicher, M. (2016). A framework for considering compre-
hensibility in modeling. Big Data, 4(2):75–88.
Goodman, B. and Flaxman, S. (2017). European Union reg-
ulations on algorithmic decision-making and a “right
to explanation”. AI Magazine, 38(3):50–57.
Guidotti, R., Monreale, A., Ruggieri, S., Turini, F., Gian-
notti, F., and Pedreschi, D. (2018). A survey of meth-
ods for explaining black box models. ACM Computing
Surveys, 51(5):1–42.
Gunning, D. and Aha, D. (2019). DARPA’s explainable
artificial intelligence (XAI) program. AI Magazine,
40(2):44–58.
Hesslow, G. (1988). The problem of causal selection.
In Hilton, D. J., editor, Contemporary science and
natural explanation: Commonsense conceptions of
causality. New York University Press.
Hoffman, R. R., Mueller, S. T., Klein, G., and Litman, J.
(2018). Metrics for explainable AI: Challenges and
prospects. arXiv:1812.04608.
Kanamori, K., Takagi, T., Kobayashi, K., and Arimura,
H. (2020). DACE: Distribution-aware counterfac-
tual explanation by mixed-integer linear optimization.
In Proceedings of the 29th International Joint Con-
ference on Artificial Intelligence (IJCAI’20), pages
2855–2862.
Lewis, D. (1987). Causal explanation. In Lewis, D., edi-
tor, Philosophical Papers Volume II, pages 214–240.
Oxford University Press.
Lipton, P. (1990). Contrastive explanation. Royal Institute
of Philosophy Supplements, 27:247–266.
Lipton, Z. C. (2018). The mythos of model interpretability:
In machine learning, the concept of interpretability is
both important and slippery. ACM Queue, 16(3):31–
57.
Lucic, A., Oosterhuis, H., Haned, H., and de Rijke, M.
(2019). FOCUS: Flexible optimizable counterfactual
explanations for tree ensembles. arXiv:1911.12199.
Miller, T. (2019). Explanation in artificial intelligence: In-
sights from the social sciences. Artificial Intelligence,
267:1–38.
Mothilal, R. K., Sharma, A., and Tan, C. (2020). Explain-
ing machine learning classifiers through diverse coun-
terfactual explanations. In Proceedings of the 2020
Conference on Fairness, Accountability, and Trans-
parency (FAccT’20), pages 607–617.
Ribeiro, M. T., Singh, S., and Guestrin, C. (2016). “Why
should i trust you?” Explaining the predictions of any
ICAART 2022 - 14th International Conference on Agents and Artificial Intelligence
526

classifier. In Proceedings of the 22nd ACM SIGKDD
International Conference on Knowledge Discovery
and Data Mining (KDD’16), pages 1135–1144.
Ribeiro, M. T., Singh, S., and Guestrin, C. (2018). Anchors:
High-precision model-agnostic explanations. In Pro-
ceedings of the AAAI Conference on Artificial Intelli-
gence (AAAI’18), pages 1527–1535.
Russell, S. J. and Norvig, P. (2020). Artificial Intelligence:
A Modern Approach. Prentice Hall, 4th edition.
Tjoa, E. and Guan, C. (2021). A survey on explainable arti-
ficial intelligence (XAI): Towards medical XAI. IEEE
Transactions on Neural Networks and Learning Sys-
tems, 32(11):4793–4813.
Verma, S., Dickerson, J., and Hines, K. (2020). Counterfac-
tual explanations for machine learning: A review. In
Proceedings of the NeurIPS’20 Workshop: ML Retro-
spectives, Surveys & Meta-Analyses (ML-RSA’20).
Wachter, S., Mittelstadt, B., and Russell, C. (2017). Coun-
terfactual explanations without opening the black box:
Automated decisions and the GDPR. Harvard Journal
of Law & Technology, 31:841–887.
Developing and Experimenting on Approaches to Explainability in AI Systems
527
