
Instance Selection on CNNs for Alzheimer’s Disease Classification from
MRI
J. A. Castro-Silva
1,2,5
, M. N. Moreno-Garc
´
ıa
1
, Lorena Guachi-Guachi
3,5
and D. H. Peluffo-Ord
´
o
˜
nez
4,5
1
Universidad de Salamanca, Salamanca, Spain
2
Universidad SurColombiana, Neiva, Colombia
3
Department of Mechatronics, Universidad Internacional del Ecuador, Quito, Ecuador
4
Mohammed VI Polytechnic University, Ben Guerir, Morocco
5
Smart Data Analysis Systems Group - SDAS Research Group, Ben Guerir, Morocco
Keywords:
Convolutional Neural Network, Instance Selection, Data Leakage, Alzheimer’s Disease.
Abstract:
The selection of more informative instances from a dataset is an important preprocessing step that can be
applied in many classification tasks. Since databases are becoming increasingly large, instance selection
techniques have been used to reduce the data to a manageable size. Besides, the use of test data in any part of
the training process, called data leakage, can produce a biased evaluation of classification algorithms. In this
context, this work introduces an instance selection methodology to avoid data leakage using an early subject,
volume, and slice dataset split, and a novel percentile-position-analysis method to identify the regions with the
most informative instances. The proposed methodology includes four stages. First, 3D magnetic resonance
images are prepared to extract 2D slices of all subjects and only one volume per subject. Second, the extracted
2D slices are evaluated in a percentile distribution fashion in order to select the most insightful 2D instances.
Third, image preprocessing techniques are used to suppress noisy data, preserving semantic information in the
image. Finally, the selected instances are used to generate the training, validation and test datasets. Preliminary
tests are carried out referring to the OASIS-3 dataset to demonstrate the impact of the number of slices per
subject, the preprocessing techniques, and the instance selection method on the overall performance of CNN-
based classification models such as DenseNet121 and EfficientNetB0. The proposed methodology achieved a
competitive overall accuracy at a slice level of about 77.01% in comparison to 76.94% reported by benchmark-
and-recent works conducting experiments on the same dataset and focusing on instance selection approaches.
1 INTRODUCTION
Alzheimer’s disease (AD) is a progressive brain dis-
order and the most common cause of dementia in the
elderly. AD causes nerve cell death and tissue loss
throughout the brain, resulting in a dramatic reduction
in brain volume over time and affecting the major-
ity of its functions. This brain structure is noticeable
on images obtained using various imaging modali-
ties, including Magnetic Resonance Imaging (MRI),
Positron Emission Tomography (PET), and Diffusion
Tensor Imaging (DTI). Due to the increase in life ex-
pectancy and the aging population in developed coun-
tries, it is estimated that AD will affect 60 million
people worldwide over the next 50 years (Ortiz et al.,
2016). There is no cure for AD, and currently avail-
able medications can only help slow the disease’s pro-
gression. As a result, early diagnosis becomes the
best way to ensure effective treatments.
Recently, innovative automatic methods based on
Convolutional Neural Networks (CNNs), which are
part of the deep learning technique, have shown to be
successful in detecting structural changes in the brain
using MRI (Jabason et al., 2019b),(Bae et al., 2020),
(Guan, 2019), (Hussain et al., 2020), (Khan et al.,
2019). CNNs can analyze 2D slices (Farooq et al.,
2017a), (Khan et al., 2019); 3D-patches (Backstrom
et al., 2018), (Zhao et al., 2021); Region-of-interest
(ROI) (Khvostikov et al., 2018), (Lin et al., 2018);
and 3D-subject (Duc et al., 2020), (Backstrom et al.,
2018). Most CNN-based works use a random selec-
tion of training data, which might result in overly op-
timistic or biased models, particularly in cases of data
leakage. Data leakage is often caused by an incor-
rectly split dataset, the lack of an independent dataset
for testing, a late split dataset, or biased transfer learn-
330
Castro-Silva, J., Moreno-García, M., Guachi-Guachi, L. and Peluffo-Ordóñez, D.
Instance Selection on CNNs for Alzheimer’s Disease Classification from MRI.
DOI: 10.5220/0010900100003122
In Proceedings of the 11th International Conference on Pattern Recognition Applications and Methods (ICPRAM 2022), pages 330-337
ISBN: 978-989-758-549-4; ISSN: 2184-4313
Copyright
c
2022 by SCITEPRESS – Science and Technology Publications, Lda. All rights reserved

ing (Wen et al., 2020).
In order to minimize data leakage when devel-
oping CNN-based classification models, some works
have proposed different approaches for selecting in-
stances for Alzheimer’s disease classification. They
differ in terms of the technique used to obtain the
most representative slices and the number of slices
chosen. For instance, (Farooq et al., 2017b) removes
all slices without informative content. Besides, (Sar-
raf et al., 2016) withdraws the last ten slices as well as
those with a pixel intensity sum of zero. Other auto-
matic techniques (Jabason et al., 2019b), (Khan et al.,
2019) analyze the variation of each slice based on en-
tropy calculation. These techniques select the slices
with the highest entropy values as the most informa-
tive ones. As for the number of slices, works such as
(Hon and Khan, 2017), (Wu et al., 2018), (Qiu et al.,
2018), (Ren et al., 2019), (Khan et al., 2019), (Jaba-
son et al., 2019b) propose using a fixed number of
slices ranging from 30, 32, 48, and 100.
Furthermore, to improve the classification per-
formance, researchers apply various image prepro-
cessing techniques such as FreeSurfer (Ren et al.,
2019), (Backstrom et al., 2018) for skull extraction,
segmentation and nonlinear registration; FSL (Duc
et al., 2020), (Zhao et al., 2021) for brain extraction
and tissue segmentation; Statistical parametric map-
ping (SPM) (Farooq et al., 2017a), (Guan, 2019) for
smoothing scans, among others.
Although the data leakage is a problem that af-
fects classification models in general, particularly, the
development of solutions that solve the data leak-
age problem by selecting the most informative in-
stances is still a challenging and underexplored task
for AD detection, which demands accurate and un-
biased solutions. Therefore, this work introduces a
methodology for strategically identifying and select-
ing the most informative 2D slices using a percentile-
position-analysis method. The proposed methodol-
ogy intends to reduce data leakage by ensuring that
each subject (patient) belongs to a single subject dis-
tribution set and that only one volume (3D MR im-
age) per subject is selected. Besides, a preprocessing
step is included to use the most informative content of
each 2D slice.
The ability of the proposed methodology to cor-
rectly select the most informative instances is pre-
liminarily explored using two CNN architectures
(DenseNet121 (Huang et al., 2017) and Efficient-
NetB0 (Tan and Le, 2019)), the most well-known in
the state of the art, to classify CN=Normal Cogni-
tion and AD=Alzheimer’s cases from the OASIS-3
dataset.
Furthermore, data leakage behavior is experimen-
tally evaluated by randomly assigning 2D slices to
training, test, and validation sets, which may result in
training data containing information that is intended
to be predicted.
The remaining of this paper is structured as fol-
lows: The materials and methods used for preprocess-
ing and instance selection are included in Section 2.
Section 3 stated the experiment description and pa-
rameter settings of this work. The results and discus-
sion are presented in Section 4. Finally, Section 5
gathers the concluding remarks.
2 MATERIALS AND METHODS
2.1 Dataset
This work uses the OASIS-3 dataset (https://www.
oasis-brains.org/#data), which consists of 3395 T1-
weighted structural magnetic resonance imaging (3D-
MRI) images from 2168 sessions belonging to 1098
subjects ranging in age from 42 to 97 years. Subjects
are characterized using the Clinical Dementia Rating
(CDR) scale, which is a measure that ranges from 0
to 3 often used to determine the overall severity of de-
mentia. A CDR of zero characterizes CN cases, while
a CDR of one or greater characterizes AD cases.
2.2 Proposed Methodology
The proposed methodology aims at selecting the most
informative instances from the dataset to reduce both
the leakage of relevant data and the use of noisy
instances, which could decrease the overall perfor-
mance of a CNN-based classification model. The
methodology consists of four stages, as shown in Fig.
1. First, 3D MRI images are prepared to extract 2D
slices of all subjects and one volume per subject. Sec-
ond, the extracted 2D slices are subjected to a novel
percentile-position-analysis (PPA) method in order to
select the most insightful 2D instances. Third, image
preprocessing techniques are used to suppress noisy
data. Finally, the selected instances are used to gener-
ate the training, validation and test datasets.
Data Preparation: This stage starts by randomly
splitting the 3D-MRIs from the OASIS-3 dataset to
ensure that each subject is part of a single subject-
distribution-set (training, validation, or test). This
division guarantees reproducible tests and prevents
data leakage by creating independent training, test,
and validation sets. The subject-distribution-set has
k number of subjects per class, where (k) is less than
Instance Selection on CNNs for Alzheimer’s Disease Classification from MRI
331
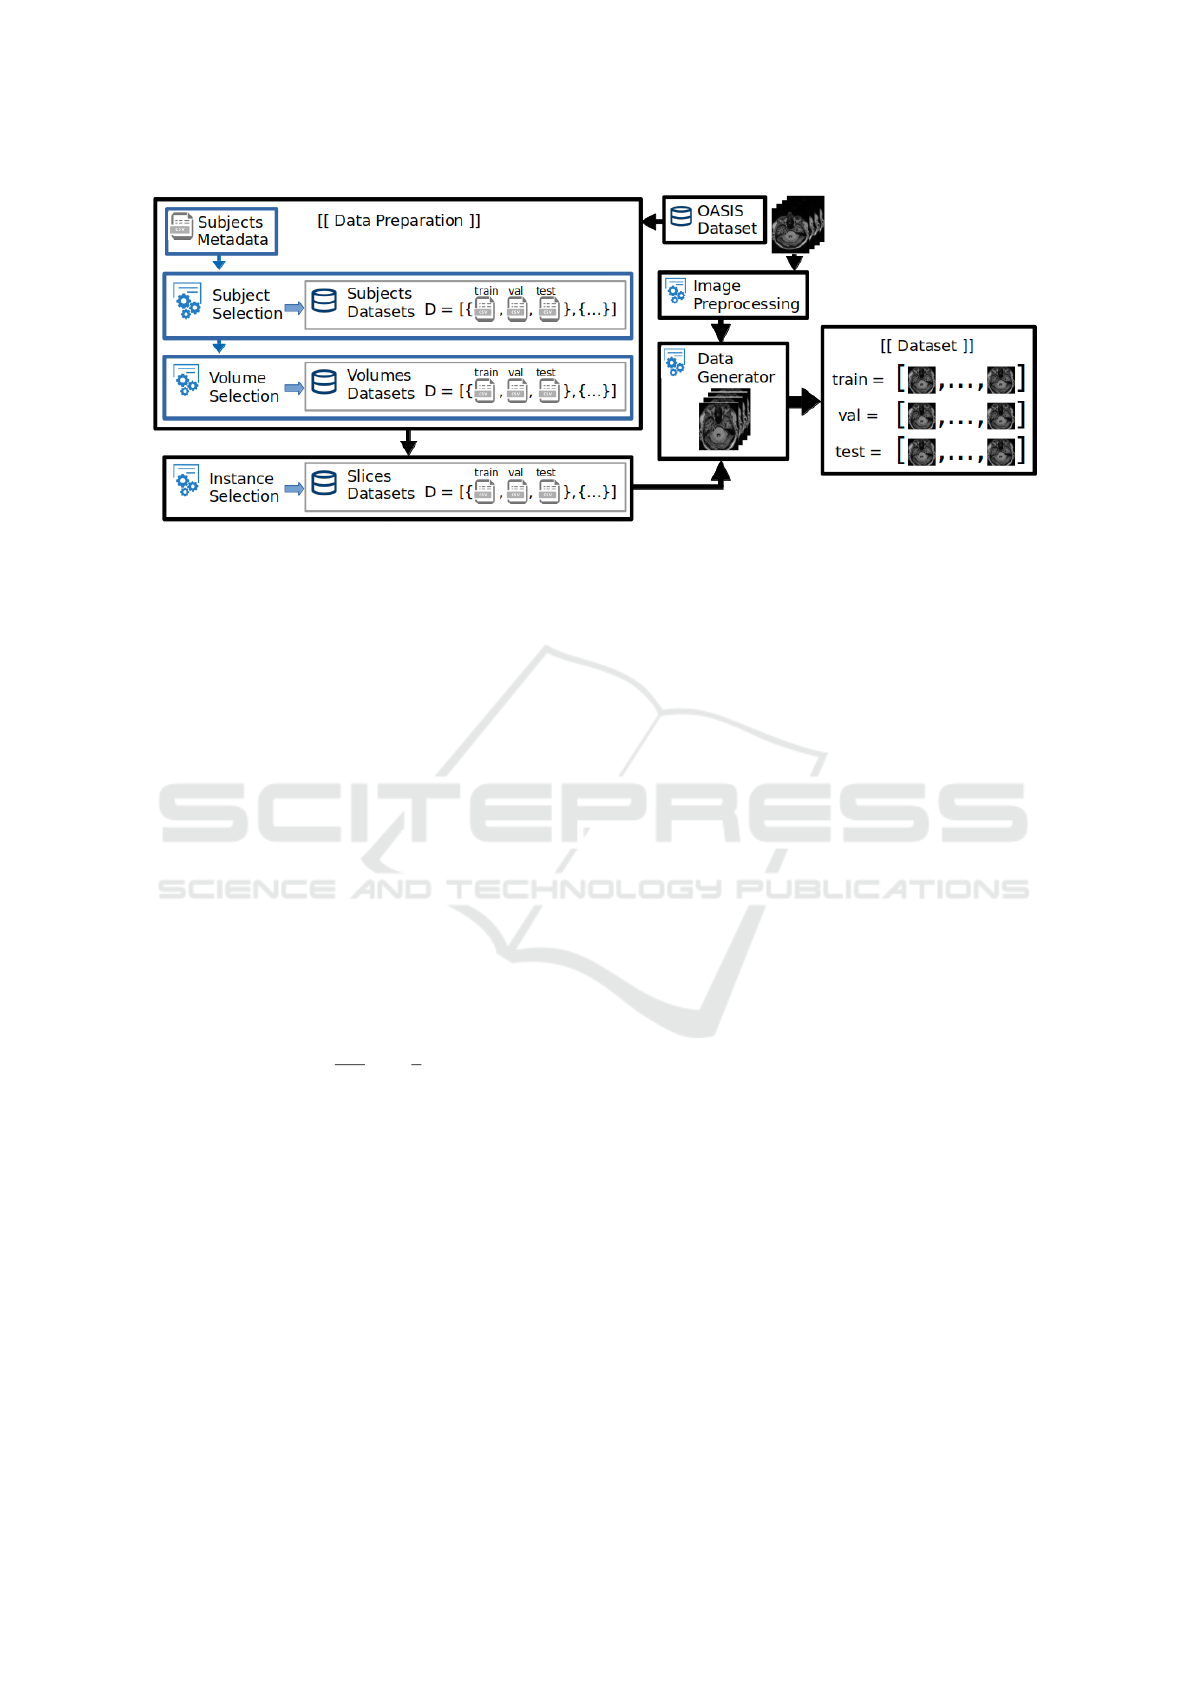
Figure 1: Workflow of the proposed methodology empowered by the novel percentile-position-analysis method for optimal
instance selection.
or equal to the number of samples from the minority
class, to avoid the class imbalance problems. Sub-
sequently, the volume-distribution-set is generated by
selecting one volume for each subject.
Finally, the volume-distribution-set is processed
to extract 2D slices of the orthogonal planes of the
3D MRI (axial, coronal and sagittal). The generated
2D slices are saved in .png format with the image ori-
entation set in RAS (Right-Anterior-Superior).
Instance Selection based on Percentile-Position-
Analysis (PPA) Method: PPA creates 2D-slice
subsets from five specific percentile-based positions
-here denoted as P =
{
p
20
, p
35
, p
50
, p
65
, p
80
}
, includ-
ing a fixed number (k) of instances to explore the as-
sociation between slice location and slice content.
For each subset, the initial slice number (i) is com-
puted by equation (1):
i =
n
100
c
−
k
2
. (1)
where n is the total number of slices per plane, c is the
subset position expressed in percentile, and k is the
desired number of slices. The slice subset (S) includes
the sequence of selected instances from s
i
to s
i+k
, as
follows
S =
{
s
i
,s
i+1
,s
i+2
,··· , s
i+k−2
,s
i+k−1
,s
i+k
}
. (2)
Image Preprocessing: The input image is down-
sampled by standard CNN classification models into
smaller images (e.g. 224×224) (Huang et al., 2017),
(Tan and Le, 2019). Down-sampling preserves the se-
mantic information in the image while significantly
reducing the number of model parameters. However,
small regions of brain may be vanished from the im-
age by using this technique, making them impossi-
ble to detect its structure. Besides, down-sampling
approaches can reduce the data quality by removing
any essential features that lie at the edges of the im-
age, distorting an image, or adding noisy data. To
address this issue and continue to feed the classifica-
tion model with the most revealing pixels from the 2D
slices, this work examines the following preprocess-
ing techniques:
• Image Trimming: It corrects and standardizes
the brain area by removing black pixel outliers as
depicted in Fig. 2(b).
• Image Resize: Since the size of the 2D slices
varies, the proposed methodology uses three tech-
niques to define a base size for all slices either
stretching or maintaining the existing aspect ratio,
which is the proportional relationship between an
image width and height:
1. Full Image Resize: The image size is changed
to the new size without preserving the image
aspect ratio, as shown in Fig. 2(f).
2. Resize by Cropping: The longest axis of the
image is cropped to get a square size, and then
it is resized, preserving the aspect ratio as illus-
trated in Fig. 2(e).
3. Resize by Padding: This technique adds black
pixels to the shortest axis to get a square size
image, and then it is changed to the new size,
preserving the aspect ratio. Padding is used to
avoid removing any essential features that lie at
the edges of the image as shown in Fig. 2(d).
• Cropping: It extracts a region of interest (re-
gion of the brain). If the shortest axis is smaller
than the new size, the image is padded to get a
ICPRAM 2022 - 11th International Conference on Pattern Recognition Applications and Methods
332
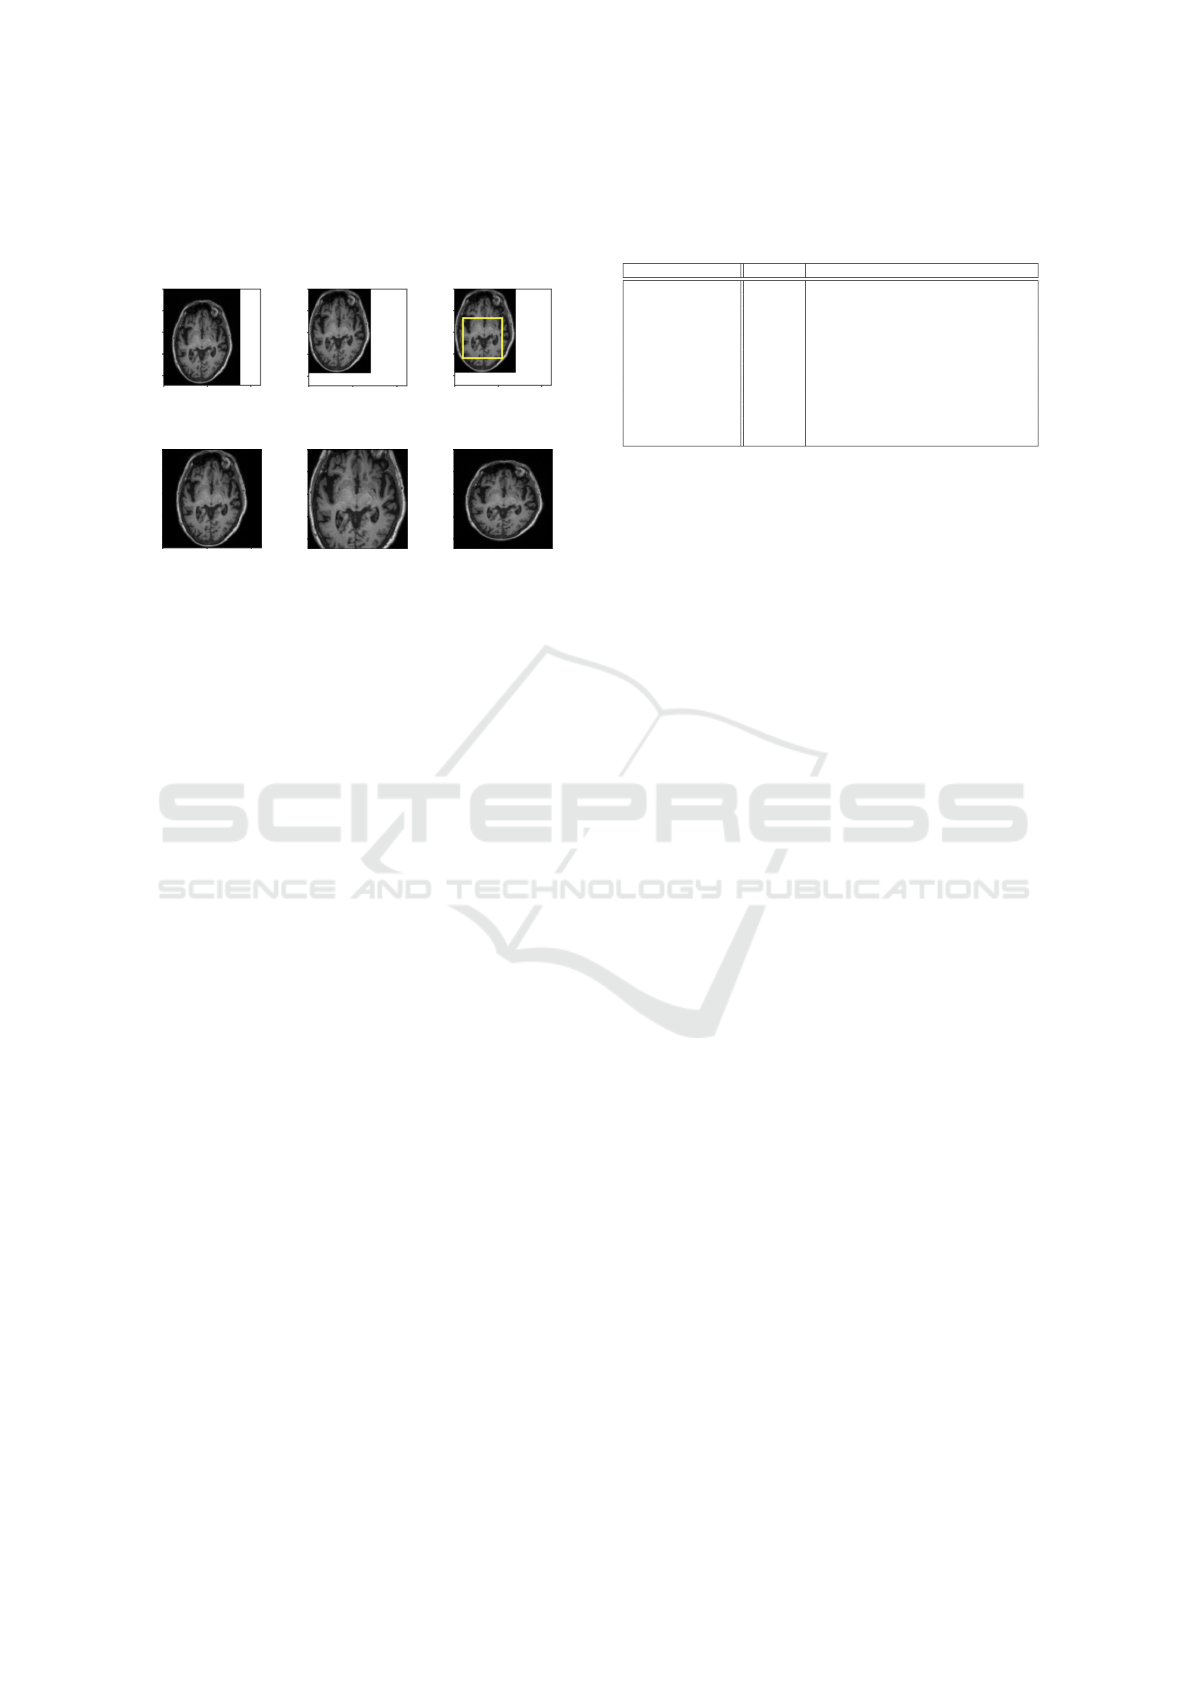
square image, and then the region of the interest
is cropped as illustrated in Fig. 2(c).
(a) Input image. (b) Trimming. (c) Cropping.
(d) Padding
Resize.
(e) Cropping
Resize.
(f) Full
Resize.
Figure 2: Image preprocessing techniques to suppress the
less informative pixels.
Data Generator: This stage prepares the training
data for batch-by-batch loading since large training
samples often do not fit in memory simultaneously.
The data generator reads the slice metadata dataset
(e.g., slice filename, class) and preprocesses the im-
ages in training time (without saving to disk) accord-
ing to the desired image output (e.g., image size,
resize technique). The dataset batch-size produced
is based on the computational resources (e.g., GPU,
memory).
3 EXPERIMENTAL SETUP
For experimental tests, 2D slices extracted from 100
CN and 100 AD cases are split into training (60%),
validation (20%), and test (20%) sets before prepro-
cessing. Furthermore, DenseNet121 (Huang et al.,
2017), and EfficientNetB0 (Tan and Le, 2019) are
selected to explore the influence of the proposed
methodology on the overall performance of a CNN-
based classification model. They have been selected
for their successful contribution to the computer vi-
sion field as image classification, object detection and
localization, scene understanding, and other related
tasks (Goodfellow et al., 2016), (Rosebrock, 2017).
Random search techniques were used to find the
optimal hyperparameters using the OASIS-3 dataset
split, as stated before, into three distribution subsets
(train, validation, and test). The proposed methodol-
ogy and all the selected CNNs have been trained with
these hyperparameters capable of achieving the high-
est accuracy to classify Alzheimer’s cases from MRI.
Table 1 provides relevant information about the hy-
perparameter values chosen for the CNN models.
Table 1: Hyperparameter values for DenseNet121 (Huang
et al., 2017) and EfficientNetB0 (Tan and Le, 2019) on
OASIS-3 dataset.
Hyperparameter Value Description
Position 50 Subset position in percentile (1..100).
Anatomical plane Axial Orthogonal plane (Sagittal, Coronal, Axial).
Number of images 32 Number of instances per subject-volume.
Number of channels 3 Number of channels (3=RGB, 1=Gray scale).
Epochs 20 Number of epochs.
Batch size 16 Number of instances by batch.
Transfer learning ImageNet Dataset name.
Optimizer RMSprop Type of optimizer (Adam, SGD, RMSprop).
Learning rate LRS LearningRateSchedule exponential decay.
Initial learning rate 0.0001 A float number. The initial learning rate.
Decay steps 10000 A int number. Must be positive.
Decay rate 0.9 A float number. The decay rate.
All experiments are reported at the slice level and
were run five times to obtain consistent results. Addi-
tionally, to obtain a classification at the subject level,
all the classifications obtained at the slice level from
a subject were fused by majority voting. A random
seed was also set for the os, random, TensorFlow, and
NumPy libraries to improve the reproducibility of the
experiments. TensorFlow with Keras and Python li-
braries (including PIL and NumPy) were used to train
and test the explored CNNs with the 2D slices se-
lected through the proposed methodology. Experi-
ments were carried out using a workstation with an
Intel Core i9 9900K processor, 32 GB RAM, and 11
GB NVIDIA RTX 2080Ti GPU.
The influence of the proposed methodology on
overall CNN performance for Alzheimer’s case clas-
sification was measured in terms of the average and
standard deviation of accuracy = (T
p
+ T
n
)/(T
p
+
F
n
+ T
n
+ F
p
) metric. Where T
p
, T
n
, F
p
, and F
n
re-
fer to the number of AD cases correctly classified as
AD, number of CN cases correctly classified as CN,
number of AD cases misclassified as CN, and number
of CN cases incorrectly classified as AD, respectively.
In this sense, accuracy quantifies the proportion of
correctly classified cases.
4 EXPERIMENTAL RESULTS
AND DISCUSSION
4.1 Data Leakage vs. Independent Data
Sets
This work experimentally evaluates the effect of a
random selection by mixing and shuffling all the 2D
slices of all the distribution sets (data leakage), which
might cause training data to contain information that
is intended to be predicted.
Since selecting the most informative slices from
the original data set may improve the overall perfor-
mance of the prediction model (Khan et al., 2019),
Instance Selection on CNNs for Alzheimer’s Disease Classification from MRI
333
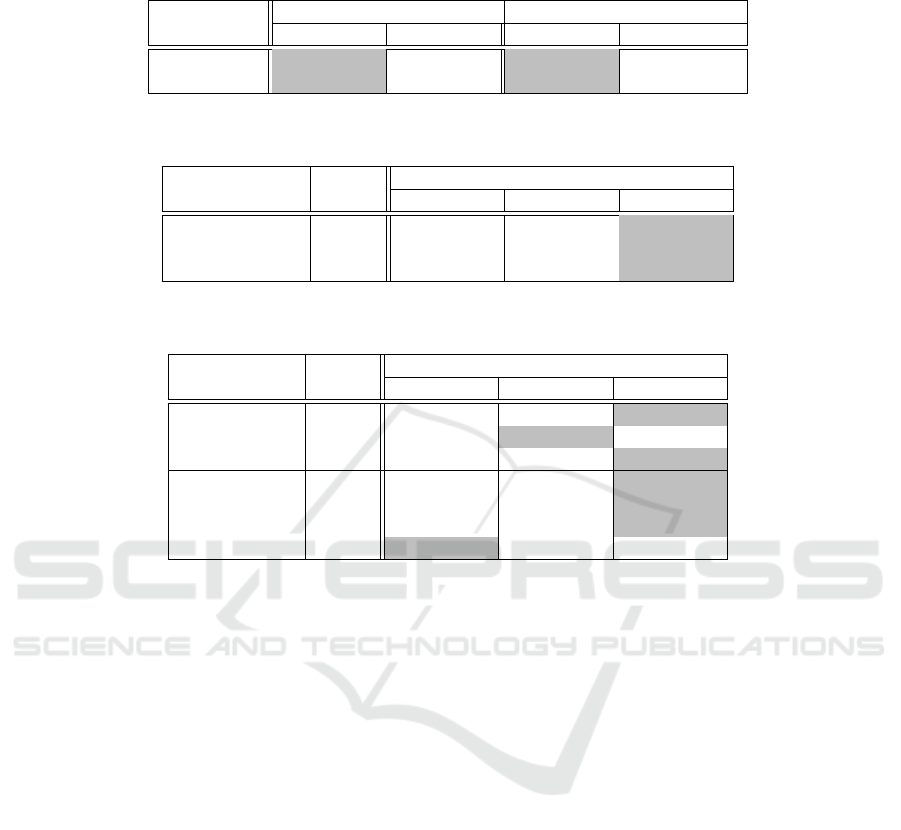
Table 2: Average accuracy from OASIS-3 with instances from the 50th-percentile (independent dataset) and comparison with
data leakage. Classification accuracy measured at subject and slice levels. The highest values are highlighted.
CNN model Slices from the 50th-percentile Data leakage from shuffled slices
Subject-Level Slice-Level Subject-Level Slice-Level
DenseNet121 79.00% ± 3.35 75.26% ± 1.35 98.30%± 1.64 96.40% ± 2.66
EfficientNetB0 51.00% ± 1.37 50.96%± 2.76 99.30% ± 0.84 98.08% ± 1.69
Table 3: Average accuracy values achieved by DenseNet121 with different resize techniques. Classification accuracy mea-
sured at slice levels. The highest values are highlighted.
Resize Size Planes
Techniques Sagittal Coronal Axial
Full image resize 63.28% ± 2.08 73.87% ± 1.96 76.57% ± 0.93
Resize by cropping 224x224 68.60% ± 1.43 71.02% ± 1.44 75.26% ± 1.35
Resize by padding 60.88% ± 3.41 71.39% ± 0.76 73.95% ± 3.25
Table 4: Average accuracy values achieved by DenseNet121 with different input image sizes. Classification accuracy mea-
sured at slice levels. The highest values are highlighted.
Cropping Size Planes
Technique Sagittal Coronal Axial
Cropping Region
64x64 65.15% ± 1.19 70.60% ±2.22 72.07% ± 1.51
96x96 67.39% ± 2.74 72.44% ±1.18 72.04% ± 2.24
128x128 62.21% ± 5.18 70.49% ± 2.76 75.79% ±1.42
Cropping Resize
160x160 67.07% ± 2.61 71.07% ± 3.67 74.04% ±1.17
192x192 70.24% ± 0.87 72.71% ± 2.93 75.90% ±1.14
224x224 68.60% ± 1.43 71.02% ± 1.44 75.26% ±1.35
256x256 71.87% ± 2.21 69.59% ± 2.07 71.42% ±2.75
this experiment also includes results from CNN mod-
els trained with an independent set where the slices of
a subject belong to only one distribution set (training,
validation or test). The dataset was taken from the
50th percentile, as extreme slices often appear black
or have less informative data.
From the results collected in Table 2, it can be
seen that data leakage caused by shuffled slices pro-
duces overly optimistic results (higher or equal than
96.40%) when compared to the results of models
trained with the 50th percentile independent dataset
slices (no data leakage). This behavior is repeated for
both subject-level and slice-level classification, de-
manding the development of more robust solutions for
selecting more informative slices.
DenseNet121 is the CNN classification model
used in the following experiments because it achieves
the highest accuracy (more than 25 %) compared with
EfficientNetB0.
4.2 The Impact of Preprocessing
Techniques
Resizing experiments are conducted on the training
set (in processing time) to evaluate the effectiveness
of each resizing technique on the overall performance
of the CNN-based classification model, as shown in
Table 3. All resizing techniques achieve the highest
average accuracy values for the axial planes as they
capture the most critical information of the regions
affected by Alzheimer’s disease.
On the other hand, the average accuracy values
for each technique show that resizing by cropping
technique ensures higher accuracy for all three planes
(sagittal, coronal and axial). Besides, the resizing
by padding technique yields the lowest accuracy due
to the addition of noise when padding the segment.
Since resizing by cropping guarantees a significantly
high accuracy value for all three planes, it has been
chosen as the best resizing technique for the proposed
methodology.
Reducing image size leads to information loss.
This experiment examines the impact of image size
on classification results. Sizes of 64×64, 96×96
and 128×128 are tried using the cropping region
technique; meanwhile, sizes of 160×160, 192×192,
224×224 and 256×256 are tried using the cropping
resizing technique as shown in Table 4.
From Table 4, it can be observed that the
192×192 size outperforms the average accuracy of
the 224×224 size (experimentally selected for previ-
ous experiments), despite of the fact that almost all
sizes achieved high accuracy for the axial plane.
ICPRAM 2022 - 11th International Conference on Pattern Recognition Applications and Methods
334
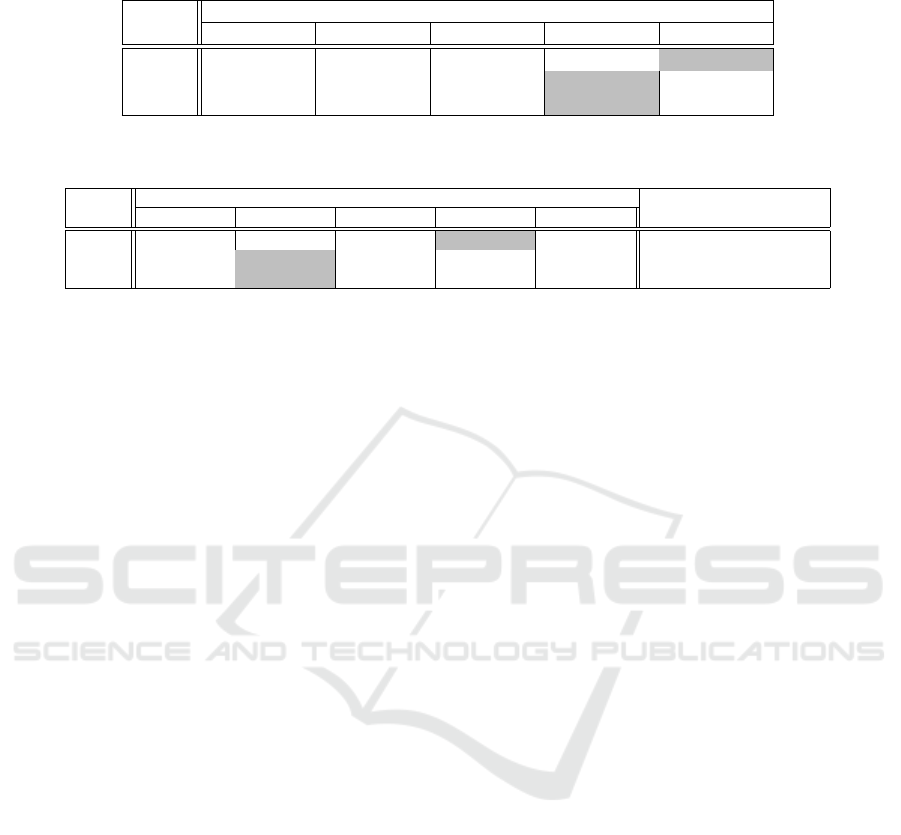
Table 5: Average accuracy of DenseNet 121 for the selected number of slices. Classification accuracy measured at slice levels.
The highest values are highlighted.
Number of instance selected
Plane 1 8 16 32 64
Sagittal 52.50% ±6.01 63.92% ± 1.46 68.21% ± 1.97 68.60% ± 1.43 70.05% ± 2.71
Coronal 50.00% ±6.99 70.85% ± 3.50 68.21% ± 3.29 71.02% ± 1.44 68.38%± 4.11
Axial 54.37% ± 6.48 74.15% ± 1.98 74.23% ± 2.44 75.26%± 1.35 74.98% ± 1.07
Table 6: Average accuracy reached by DenseNet121 which is trained with 2D-slice subsets selected in a percentile distribution
fashion. Classification accuracy measured at slice levels. The highest values achieved for each plane are highlighted.
Percentiles explored by the proposed methodology Entropy-based
Plane 20 35 50 65 80 method (Jabason et al., 2019a)
Sagittal 66.63% ±2.46 71.50% ± 3.26 68.60% ±1.43 72.42% ± 2.72 70.73% ±1.49
Coronal 64.14% ±3.55 72.07% ± 1.26 71.02% ± 1.44 70.44% ±0.78 65.44% ± 3.95
Axial 67.68% ± 2.94 77.01% ± 1.61 75.26% ± 1.35 71.95% ±2.06 66.71% ± 1.24 76.94% ± 1.85
4.3 The Impact of the Number of Slices
Selected, and Instance Selection
based on
Percentile-Position-Analysis (PPA)
Method
Number of Slices Selected per Subject: Since the
dataset quantity and quality influence the final perfor-
mance of classification models, this experiment eval-
uates the impact of the number of selected informa-
tive slices over classification results of DenseNet121
(Huang et al., 2017) by testing subsets of 1, 8, 16, 32,
and 64 slices.
From Table 5, it can be observed that the selec-
tion of 32 2D slices per subject reaches high average
accuracy for planes coronal and axial (71.02% and
75.26%) and 64 slices for the sagittal plane (70.05%).
Furthermore, it is seen that subsets with 64 images
per subject show a slight decrease in accuracy for ax-
ial and coronal planes compared to subsets with 32
slices. This behavior is because adding more im-
age slices with less informative content can result in
redundant, noisy, or less representative information,
lowering CNN performance. On the other hand, sub-
sets with 1 and 8 slices per subject achieve the lowest
accuracy values for all planes. These findings show
that a number of slices per subject less than or equal
to 8 does not ensure the representativeness of the 170-
256 instances that comprise an MRI volume.
Due to the high accuracy values achieved by sub-
sets with 32 slices, the proposed methodology estab-
lishes the number of 32 slices as the appropriate num-
ber of the most-representative-slices which can be se-
lected for the classification of Alzheimer’s cases.
PPA Method: As it is well known, 2D slices from
3D MRI can range from dark to informative images,
and the quality of the content is dependent on the
volume’s position. Therefore, to determine how 2D
slices from different positions and planes affect the
overall performance of DenseNet121 (Huang et al.,
2017) for Alzheimer’s disease classification, training
subsets are created with 2D slices distributed in a per-
centile fashion P =
{
p
20
, p
35
, p
50
, p
65
, p
80
}
.
From results obtained in Table 6, it can be seen
that the most representative 2D slices are located in
the 35th percentile, with the highest accuracy values
for axial (77.01%) and coronal (72.07%) planes. Re-
markably, the most representative 2D slices are found
in the 65th and 35th percentiles for the sagittal plane,
with accuracy values of 72.42% and 71.50%, respec-
tively. This difference indicates a structural symmetry
in the sagittal plane (left and right sides). On the other
hand, it can also be observed that the less informative
slices are found in the extreme percentiles for all three
planes.
Based on the high values of the accuracy average
obtained by the 35th percentile for the axial, sagittal,
and coronal planes, the proposed methodology estab-
lishes the 35th percentile as containing the most infor-
mative instances for the classification of Alzheimer’s
disease.
Finally, for comparison purposes, the entropy-
based methodology demonstrated in (Jabason et al.,
2019a) is compared to this work in Table 6. It has
been chosen not only because it is one of the most effi-
cient instance selection techniques with the Densenet
121 architecture, but also because it is similar to the
goal of this work, as it also performs Alzheimer’s
case classification. The obtained results show that the
PPA method slightly outperforms the entropy-based
method in terms of overall results. This behavior can
be attributed to the careful assembly of subject and
volume distribution sets, as well as to the optimal se-
lection of the most significant instances.
Instance Selection on CNNs for Alzheimer’s Disease Classification from MRI
335

5 CONCLUSIONS AND FUTURE
WORK
This work introduces a methodology for strategi-
cally identifying and selecting the most informative
2D slices using a percentile-based-position-analysis
method. The impact of the proposed methodology on
the overall performance of CNN-based classification
models is explored experimentally. The slice subsets
contribution to the model performance varies accord-
ing to the position; the 35th percentile reaches the
higher accuracy. Based on the best average results,
the proposed methodology establishes the resize by
cropping technique, the image sizes of (224 × 224)
and (192 × 192) and the axial plane, as suitable to
get the highest model performance for Alzheimer’s
disease classification. The number of slices per sub-
ject greatly influences the model performance, sub-
sets with 32 slices presenting the best results.
The use of 2D slices produces an increased num-
ber of instances and the possibility of using existing
2D CNNs to train a model with transfer learning or
from scratch. The classifications obtained at the slice
level must be fused to obtain a classification at the
subject level. Finally, data leakage can be avoided by
using a subject dataset early split and creating an inde-
pendent test set as proposed in the instance selection
process.
For future work, image metrics will be used to
select the most informative instances. Also, custom
CNNs and model ensembles using the different planes
and cropping regions should be considered to improve
the classification model performance and reliability.
ACKNOWLEDGMENTS
This work is supported by the Smart Data Analy-
sis Systems Group - SDAS Research Group (http:
//sdas-group.com)
REFERENCES
Backstrom, K., Nazari, M., Gu, I. Y. H., and Jakola, A. S.
(2018). An efficient 3D deep convolutional network
for Alzheimer’s disease diagnosis using MR images.
Proceedings - International Symposium on Biomedi-
cal Imaging, 2018-April(Isbi):149–153.
Bae, J. B., Lee, S., Jung, W., Park, S., Kim, W., Oh, H., Han,
J. W., Kim, G. E., Kim, J. S., Kim, J. H., and Kim,
K. W. (2020). Identification of Alzheimer’s disease
using a convolutional neural network model based on
T1-weighted magnetic resonance imaging. Scientific
Reports, 10(1):1–10.
Duc, N. T., Ryu, S., Qureshi, M. N. I., Choi, M., Lee, K. H.,
and Lee, B. (2020). 3D-Deep Learning Based Au-
tomatic Diagnosis of Alzheimer’s Disease with Joint
MMSE Prediction Using Resting-State fMRI. Neu-
roinformatics, 18(1):71–86.
Farooq, A., Anwar, S., Awais, M., and Alnowami, M.
(2017a). Artificial intelligence based smart diagno-
sis of Alzheimer’s disease and mild cognitive impair-
ment. 2017 International Smart Cities Conference,
ISC2 2017, pages 0–3.
Farooq, A., Anwar, S. M., Awais, M., and Rehman, S.
(2017b). A deep CNN based multi-class classifica-
tion of Alzheimer’s disease using MRI. 2017 IEEE In-
ternational Conference on Imaging Systems and Tech-
niques (IST), pages 3–8.
Goodfellow, I., Bengio, Y., and Courville, A. (2016). Deep
Learning. MIT Press.
Guan, Z. (2019). A Comprehensive Study of Alzheimer ’ s
Disease. pages 1–16.
Hon, M. and Khan, N. M. (2017). Towards Alzheimer’s
disease classification through transfer learning. Pro-
ceedings - 2017 IEEE International Conference on
Bioinformatics and Biomedicine, BIBM 2017, 2017-
Janua:1166–1169.
Huang, G., Liu, Z., Van Der Maaten, L., and Weinberger,
K. Q. (2017). Densely connected convolutional net-
works. In Proceedings of the IEEE conference on
computer vision and pattern recognition, pages 4700–
4708.
Hussain, E., Hasan, M., Hassan, S. Z., Hassan Azmi, T.,
Rahman, M. A., and Zavid Parvez, M. (2020). Deep
Learning Based Binary Classification for Alzheimer’s
Disease Detection using Brain MRI Images. Proceed-
ings of the 15th IEEE Conference on Industrial Elec-
tronics and Applications, ICIEA 2020, pages 1115–
1120.
Jabason, E., Ahmad, M. O., and Swamy, M. N. (2019a).
Classification of Alzheimer’s Disease from MRI Data
Using an Ensemble of Hybrid Deep Convolutional
Neural Networks. Midwest Symposium on Circuits
and Systems, 2019-Augus(Mci):481–484.
Jabason, E., Omair Ahmad, M., and Swamy, M. N.
(2019b). Hybrid Feature Fusion Using RNN and Pre-
trained CNN for Classification of Alzheimer’s Disease
(Poster). FUSION 2019 - 22nd International Confer-
ence on Information Fusion, pages 2019–2022.
Khan, N. M., Abraham, N., and Hon, M. (2019). Trans-
fer Learning with Intelligent Training Data Selection
for Prediction of Alzheimer’s Disease. IEEE Access,
7:72726–72735.
Khvostikov, A., Aderghal, K., Krylov, A., Catheline,
G., and Benois-Pineau, J. (2018). 3D inception-
based CNN with sMRI and MD-DTI data fusion for
Alzheimer’s disease diagnostics. arXiv.
Lin, W., Tong, T., Gao, Q., Guo, D., Du, X., Yang, Y.,
Guo, G., Xiao, M., Du, M., and Qu, X. (2018). Con-
volutional neural networks-based MRI image analy-
sis for the Alzheimer’s disease prediction from mild
ICPRAM 2022 - 11th International Conference on Pattern Recognition Applications and Methods
336

cognitive impairment. Frontiers in Neuroscience,
12(NOV):1–13.
Ortiz, A., Munilla, J., G
´
orriz, J. M., and Ram
´
ırez, J. (2016).
Ensembles of Deep Learning Architectures for the
Early Diagnosis of the Alzheimer’s Disease. Inter-
national Journal of Neural Systems, 26(07):1650025.
Qiu, S., Chang, G. H., Panagia, M., Gopal, D. M., Au, R.,
and Kolachalama, V. B. (2018). Fusion of deep learn-
ing models of MRI scans, Mini–Mental State Exami-
nation, and logical memory test enhances diagnosis of
mild cognitive impairment. Alzheimer’s and Demen-
tia: Diagnosis, Assessment and Disease Monitoring,
10(September):737–749.
Ren, F., Yang, C., Qiu, Q., Zeng, N., Cai, C., Hou, C., and
Zou, Q. (2019). Exploiting Discriminative Regions of
Brain Slices Based on 2D CNNs for Alzheimer’s Dis-
ease Classification. IEEE Access, 7:181423–181433.
Rosebrock, A. (2017). Deep Learning for Computer Vision
with Python:StarterBundle. Deep learning for com-
puter vision with Python. PyImageSearch.
Sarraf, S., DeSouza, D., Anderson, J., and Tofighi, G.
(2016). DeepAD: Alzheimer’s Disease Classification
via Deep Convolutional Neural Networks using MRI
and fMRI. bioRxiv, page 070441.
Tan, M. and Le, Q. (2019). Efficientnet: Rethinking model
scaling for convolutional neural networks. In Interna-
tional Conference on Machine Learning, pages 6105–
6114. PMLR.
Wen, J., Thibeau-Sutre, E., Diaz-Melo, M., Samper-
Gonz
´
alez, J., Routier, A., Bottani, S., Dormont, D.,
Durrleman, S., Burgos, N., and Colliot, O. (2020).
Overview of classification of Alzheimer’s disease.
Medical Image Analysis, 63.
Wu, C., Guo, S., Hong, Y., Xiao, B., Wu, Y., and Zhang, Q.
(2018). Discrimination and conversion prediction of
mild cognitive impairment using convolutional neu-
ral networks. Quantitative Imaging in Medicine and
Surgery, 8(10):992–1003.
Zhao, Y., Ma, B., Jiang, P., Zeng, D., Wang, X., and Li, S.
(2021). Prediction of Alzheimer’s Disease Progres-
sion with Multi-Information Generative Adversarial
Network. IEEE Journal of Biomedical and Health In-
formatics, 25(3):711–719.
Instance Selection on CNNs for Alzheimer’s Disease Classification from MRI
337
