
How Long Are Various Types of Daily Activities? Statistical Analysis of a
Multimodal Wearable Sensor-based Human Activity Dataset
Hui Liu
a
and Tanja Schultz
b
Cognitive Systems Lab, University of Bremen, Bremen, Germany
Keywords:
Human Activity, Human Activity Recogntion, Activities of Daily Living, Wearable Sensing, Internal Sensing,
Biosignals, CSL-SHARE, Statistical Analysis.
Abstract:
Human activity research in the field of informatics, such as activity segmentation, modeling, and recognition,
is moving in an increasingly interpretable direction with the introduction of sports and kinematics knowledge.
Many related research topics face a question: How long is the typical duration of the activities needed to be
modeled? Several public human activity datasets do not strictly limit single motions’ repetition times, such
as gait cycle numbers, in recording sessions, so they are not statistically significant concerning activity du-
ration. Standing on the rigorous acquisition protocol design and well-segmented data corpus of the recently
released multimodal wearable sensor-based human activity dataset CSL-SHARE, this paper analyzes the du-
ration statistics and distribution of 22 basic single motions of daily activities and sports, hoping to provide
research references for human activity studies. We discovered that (1) the duration of each studied human
daily activity or simple sports activity reflects interpersonal similarities and naturally obeys a normal distribu-
tion; (2) one single motion (such as jumping and sitting down) or one cycle in the activities of cyclical motions
(such as one gait cycle in walking) has an average duration in the interval from about 1 second to 2 seconds.
1 INTRODUCTION
In today’s highly automated society, human activities
are being studied more and more widely in the field
of Artificial Intelligence (AI) to facilitate human life,
such as in medical care (Ejupi et al., 2016), interac-
tive interfaces (Ancans et al., 2017), and multime-
dia entertainment (Jung and Cha, 2010) (Zok, 2014).
Generally speaking, human activity can refer to all
behaviors related to human beings, such as brain ac-
tivity, which do not need to produce any movement.
However, when we use the concept of “human ac-
tivity” in the research category of Machine Learning
(ML), we generally mean the connotation of kinemat-
ics, for which the concept “motion” matches more
closely. More specifically, a human activity refers
to the movement(s) of one or several parts of the
person’s body, either atomic or composed of many
primitive actions performed in some sequential or-
der (Beddiar et al., 2020). Therefore, human activ-
ity has a broad denotation: It can refer to a single
human motion in a narrow sense, such as jumping,
walking, and most gestures, or a human motion se-
a
https://orcid.org/0000-0002-6850-9570
b
https://orcid.org/0000-0002-9809-7028
quence of concurrent, coupled, and sequential mo-
tions in a broad sense, like cutting a cake, as described
in (Gehrig, 2015). Moreover, in most public human
activity datasets, some postures which do not produce
substantial movement, such as standing and sitting,
are also categorized as the scope of (static) human
activity, since these activities can also be recognized
separately, given suitable equipment.
Many ML research topics related to human activ-
ities, such as segmentation, modeling, and recogni-
tion, face a question: How long is the duration of
the activity that needs to be modeled? For offline
activity modeling, the knowledge of activity duration
can help estimate the model parameters at the outset,
such as layer numbers in the Neural Network (NN) or
state numbers in the Hidden Markov Model (HMM).
For online research like real-time or streaming-based
Human Activity Recognition (HAR), the duration of
the activities to be recognized will help seek a bet-
ter trade-off between window length, window over-
lap, and performance delay (Liu and Schultz, 2019).
In sports science, activity duration is usually a
common measurement task, but there are few re-
search works where these measurement results are ad-
equately used in ML research. In kinematics, gait
680
Liu, H. and Schultz, T.
How Long Are Various Types of Daily Activities? Statistical Analysis of a Multimodal Wearable Sensor-based Human Activity Dataset.
DOI: 10.5220/0010896400003123
In Proceedings of the 15th International Joint Conference on Biomedical Engineering Systems and Technologies (BIOSTEC 2022) - Volume 5: HEALTHINF, pages 680-688
ISBN: 978-989-758-552-4; ISSN: 2184-4305
Copyright
c
2022 by SCITEPRESS – Science and Technology Publications, Lda. All rights reserved

analysis provides a good model hypothesis (Mezghani
et al., 2013) (Whittle, 1996) (Whittle, 2014) (Arous
et al., 2018), but there are few related statistical ref-
erences based on signalized kinematic data, except
that (Lanshammar, 1987) estimated gait cycle du-
ration and stride length from one-marker kinematic
data. Therefore, it is essential to conduct a statisti-
cal activity duration analysis from the perspective of
human activity data mining.
Some human daily activities, such as sitting and
vacuuming, can last for half an hour or only a few sec-
onds. Hence, among all definitions and divisions of
human activities, two categories, in which the activ-
ity duration varies from person to person, from task to
task, and from dataset to dataset, are not statistically
informative in terms of duration:
• Postures, which can maintain a steady body state
for any duration, such as standing, sitting, lying,
squatting, among others;
• Activities of sequential motions, such as cooking,
vacuuming, watching TV, among others.
This paper focuses on analyzing the duration
statistics and distribution of single motions. No mat-
ter the motion contains only one movement, such as
one-leg jumping, two-leg jumping, standing up, sit-
ting down, and turning left/right, or several contin-
uous looping cycles, such as walking, running, go-
ing upstairs/downstairs, and lateral shuffling, its du-
ration has the statistical value of interpersonal simi-
larity, which not only provides a powerful reference
for modeling but also may facilitate processing more
complex motion sequences.
2 DATASET
Except for some human activity datasets that involve
relatively small numbers of defined activities, such as
RealWorld (Sztyler and Stuckenschmidt, 2016), EN-
ABL3S (Hu et al., 2018), and Gait Analysis Data Base
(Loose et al., 2020), or only activities of particu-
lar body parts, such as mmGest for gesture (Georgi
et al., 2015), CSL hdemg for finger (Amma et al.,
2015), and Upper-body movements (Santos et al.,
2020), most of the existing public human activity
datasets, such as OPPORTUNITY (Roggen et al.,
2010), PAMAP2, (Reiss and Stricker, 2012), Daily
Log (Sztyler et al., 2016), and FORTH-TRACE (Kara-
giannaki et al., 2016), cannot be directly applied to the
statistical analysis of activity duration because of the
following two reasons:
• Unrestricted acquisition protocol designs. For ex-
ample, the activity “walking” itself can last for
any duration, but each gait cycle of a healthy adult
can be statistically analyzed; however, there are
few datasets stipulating each “walking” segment
with a fixed number of gait cycles strictly;
• Distinct activity segmentation methods. For ex-
ample, the UniMiB SHAR dataset (Micucci et al.,
2017) implements a simple way of finding the
magnitude peak of the acceleration signals to seg-
ment 17 classes of Activities of Daily Living
(ADLs) and falls. Whether it is walking, jump-
ing, or falling forward, each activity segment is
precisely 3 seconds. This kind of segmentation is
easy and efficient with almost no manual labor or
machine learning study but can hardly be applied
for accurate human activity duration analysis.
The data support we use is a multimodal wear-
able sensor-based human activity dataset called CSL-
SHARE (Liu et al., 2021a), whose quality and appli-
cability have been extensively verified in many re-
search fields of human activities, such as HAR re-
search pipeline (Liu et al., 2022), feature extraction
(Barandas et al., 2020), feature space reduction (Hart-
mann et al., 2021) (Hartmann et al., 2022), automatic
segmentation, human activity modeling and recogni-
tion (Liu et al., 2021b), among others. A knee ban-
dage was used as a wearable sensor carrier, making
the dataset distinctive and more kinematically signif-
icant. The 19-channel dataset was recorded from 9
biomechanical and bioelectrical sensors, including 2
triaxial accelerometers, 2 triaxial gyroscopes, 4 EMG
sensors, 1 biaxial electrogoniometer, and 1 airborne
microphone with sampling rates up to 1,000 Hz. By
applying the in-house implemented software Activity
Signal Kit (ASK) (Liu and Schultz, 2018) for data
acquisition, segmentation, and annotation, the CSL-
SHARE dataset covers 22 types of ADLs and sports
from 20 subjects, 5 female and 15 male, aged between
23 and 43 (30.5 ± 5.8), in a total time of 11.52 hours,
of which 6.05 hours are segmented and annotated.
Unlike many human activity datasets listed above,
the CSL-SHARE dataset adopts strictly defined ac-
quisition protocols and a semi-automatic segmen-
tation mechanism called “protocol-for-pushbutton”,
enabling efficient and accurate statistical analysis
of single motions. In addition to strictly stipulat-
ing “three gait cycles” and “left-foot-first” for gait-
based activities such as walking, running, going up-
stairs/downstairs, and left/right lateral shuffling, it
is worth mentioning that the CSL-SHARE dataset
also distinguishes some activities with left-foot-first
or right-foot-first, providing materials for similarity
analysis of activity duration.
How Long Are Various Types of Daily Activities? Statistical Analysis of a Multimodal Wearable Sensor-based Human Activity Dataset
681

Table 1: Statistics of the single motion segment duration in the CSL-SHARE dataset. The minimum, maximum, mean, and
standard deviation (std.) values are in seconds.
Activity Minimum Maximum Mean±std. Number of segments
jump-one-leg 0.830 2.949 1.69 ± 0.33 379
jump-two-leg 0.869 3.389 1.95 ± 0.39 380
walk (one gait cycle) 1.046 1.863 1.42 ± 0.15 400
walk-curve-left 90
◦
(one gait cycle) 0.966 2.150 1.45 ± 0.19 398
walk-curve-right 90
◦
(one gait cycle) 1.076 2.063 1.48 ± 0.17 393
walk-upstairs (one gait cycle) 1.263 2.243 1.59 ± 0.15 365
walk-downstairs (one gait cycle) 1.023 1.973 1.44 ± 0.17 364
spin-left-left-first 0.959 3.069 1.67 ± 0.30 380
spin-left-right-first 0.969 2.609 1.83 ± 0.29 420
spin-right-left-first 0.800 2.619 1.86 ± 0.24 401
spin-right-right-first 1.169 2.719 1.71 ± 0.22 400
run (one gait cycle) 0.773 1.373 1.05 ± 0.11 400
shuffle-left (one gait cycle) 0.580 1.290 0.96 ± 0.10 380
shuffle-right (one gait cycle) 0.696 1.386 0.97 ± 0.11 374
V-cut-left-left-first 0.809 3.039 1.81 ± 0.33 399
V-cut-left-right-first 1.019 2.709 1.88 ± 0.29 378
V-cut-right-left-first 0.840 2.759 1.80 ± 0.34 400
V-cut-right-right-first 1.209 2.649 1.84 ± 0.28 378
sit-to-stand 1.049 2.719 1.81 ± 0.32 389
stand-to-sit 1.129 3.729 1.92 ± 0.35 389
sit 0.819 8.019 1.66 ± 0.58 389
stand 0.809 6.959 1.64 ± 0.51 405
3 ACTIVITY DURATION
ANALYSIS
Table 1 gives the number of activity segments and the
minimal/maximal/mean duration of the 22 activities
in the CSL-SHARE dataset. It should be noted that,
unlike the statistics of the table given in (Liu et al.,
2021a), for the eight activities involving three com-
plete gait cycles, we only list the statistics of one gait
cycle to create referenceability for other research.
Judging from each activity segment’s number of
occurrences, we can find that this dataset is well-
balanced for each involved activity, reflecting strict
protocol design and execution. Each activity was
planned to be performed 20 times by each participant
according to the protocols. The activity occurrence
discrepancy in Table 1 is mainly due to eliminating
the misoperation during users’ execution of the semi-
automatic segmentation mechanism.
Since the pushbutton for segmentation and anno-
tation may be pressed/released earlier or later during
the acquisition process, millisecond-level operation-
related slight duration deviations make the minimum
and maximum values’ general statistical reference of
minor significance; however, they are still meaning-
ful when using the CSL-SHARE dataset for model-
ing research. Due to the big data effect of multiple
participants and multiple activity execution times, the
impact of individual operational discrepancy is com-
pensated to a high degree on the average/standard de-
viation values in Table 1. Furthermore, it is notewor-
thy that the video-based manual post verification after
each data collection process corrected obvious dura-
tion outliers.
From Table 1 we can deduce a statistical hypoth-
esis: One single motion (such as jumping and sit-
ting down) or one cycle in the cyclical single motions
(such as one gait cycle in walking) has an average du-
ration in the interval from about 1 second to 2 sec-
onds, which can help determine a priori some param-
eters for data segmentation, feature extraction, activ-
ity modeling, model training, and recognition (Hart-
mann et al., 2020) (Liu, 2021). It must be stressed that
the dataset was recorded from only healthy young to
middle-aged adults. In fact, except for unique appli-
cation scenarios, ML research often starts at this age
group. Moreover, for biomedical engineering, data
of healthy individuals is usually the first material for
establishing an applicable model, which also creates
reliable references for the study of pathological situa-
tions.
HEALTHINF 2022 - 15th International Conference on Health Informatics
682
The following subsections will analyze the dura-
tion statistics of each activity group and their distribu-
tion.
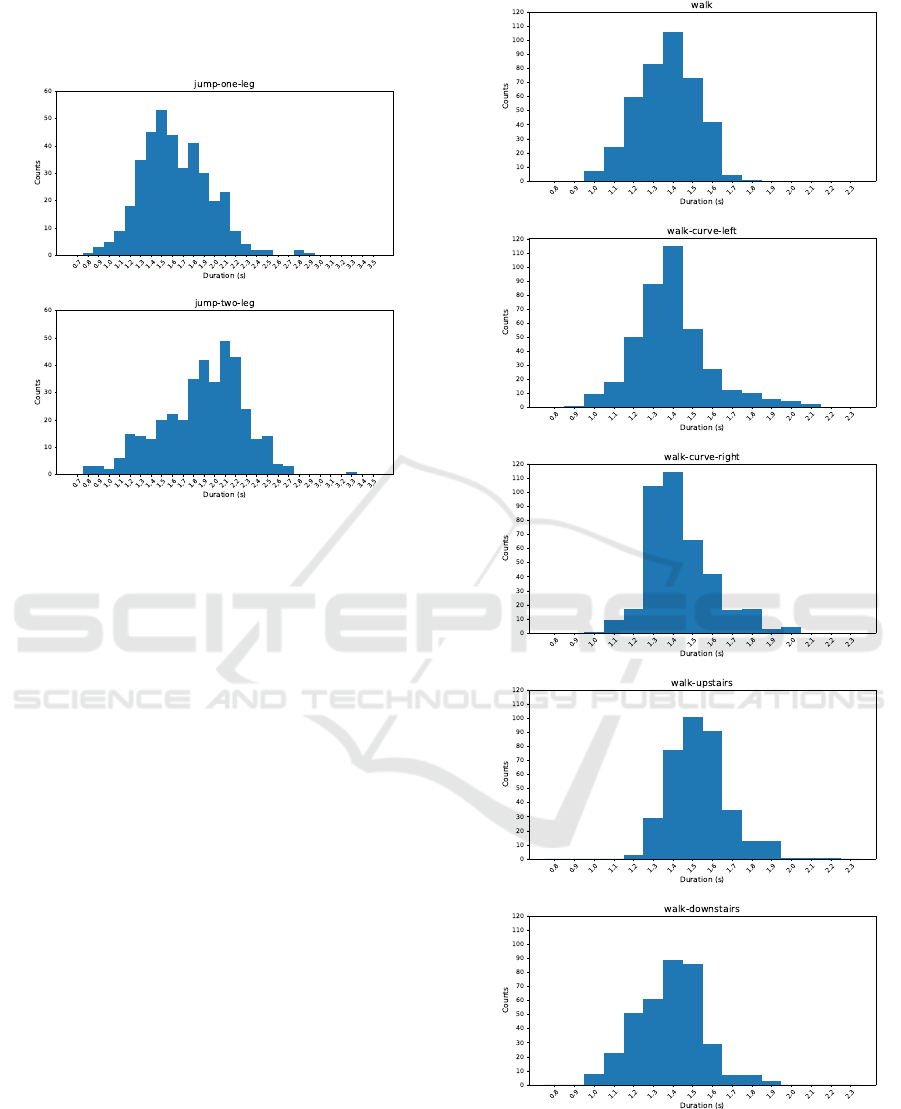
Figure 1: Duration histograms of the human activi-
ties jump-one-leg and jump-two-leg in the CSL-SHARE
dataset. The area under the curve equals the total number of
segment occurrences within 100-millisecond intervals.
3.1 Jumping Activities
The acquisition protocols for single-leg and two-leg
jumping activities in the CSL-SHARE dataset are de-
scribed as “squat, then jump upwards using the ban-
daged right leg/both legs, land in” (Liu et al., 2021a).
Table 1 and Figure 1 demonstrate that the aver-
age duration of the two jumping activities is within
the interval of 1.6 – 2.0 seconds, and the duration of
a single-leg jump is about 86% shorter than that of
a two-leg jump. It is more challenging to keep bal-
ance during the single-leg squat, so subjects gener-
ally shortened the time and amplitude of the single-
leg squat and tended to jump as soon as possible.
Therefore, the relatively reduced muscular power in
the single-leg jump also shortens the body’s stay-in-
the-air (fly) time, compared to a well-prepared two-
leg jump. This phenomenon is also witnessed by their
half-second maximum duration difference, while the
minimum values are close. Participants tended to be
more prepared for the squat in two-leg jump.
Jumping activities are certainly not only restricted
to the direction of upwards — it can be forwards-
upwards, or even leftwards/rightwards. Physically
speaking, regardless of what kind of jump happens,
as long as it happens daily and generally without a
particular purpose like a header shot, there should be
no apparent difference in duration statistics.
Figure 2: Duration histograms of one gait cycle in the
cyclical motions walk, walk-curve-left, walk-curve-right,
walk-upstairs, and walk-downstairs in the CSL-SHARE
dataset. The area under the curve equals the total number of
segment occurrences within 100-millisecond intervals.
How Long Are Various Types of Daily Activities? Statistical Analysis of a Multimodal Wearable Sensor-based Human Activity Dataset
683
3.2 Activities of Gait-based Cyclical
Motions at Waling Speed
The acquisition protocols for the five gait-based cycli-
cal motions in the CSL-SHARE dataset are described
as follows (Liu et al., 2021a):
• Walk: walk forward with three gait cycles, left
foot starts, i.e., left-right-left-right-left-right;
• Walk-curve-left/right: turn left/right 90
◦
with
three gait cycles at walking speed, left foot starts;
• Walk-upstairs/downstairs: go up/down six stairs
with three gait cycles, left foot starts.
As mentioned above, in order to establish a univer-
sal reference, we only describe one-gait-cycle statis-
tics in Table 1 and Figure 2.
Regardless of the direction, the duration of a
gait cycle at daily walking speed is about 1.4 to 1.6
seconds. Obviously, when turning left/right or go-
ing upstairs/downstairs during walking, the average
gait cycle duration is slightly longer than the normal
straightforward walking, among which walking up-
stairs leads a duration of about 100 – 200 millisec-
onds longer on average. It can also be observed that
although walking downstairs saves 10% of the time
than upstairs, it is not faster than walking straightfor-
ward. In real life, walking downstairs is considered
a fast movement than other types of walking, but in
the laboratory data acquisition sessions, participants
tended to go downstairs at a relatively normal speed
in a relaxed environment. Another thing to remind is
that the height of the stairs will also affect the activity
duration. The stairs used in the CSL-SHARE dataset
are the regular building stairs of standard height.
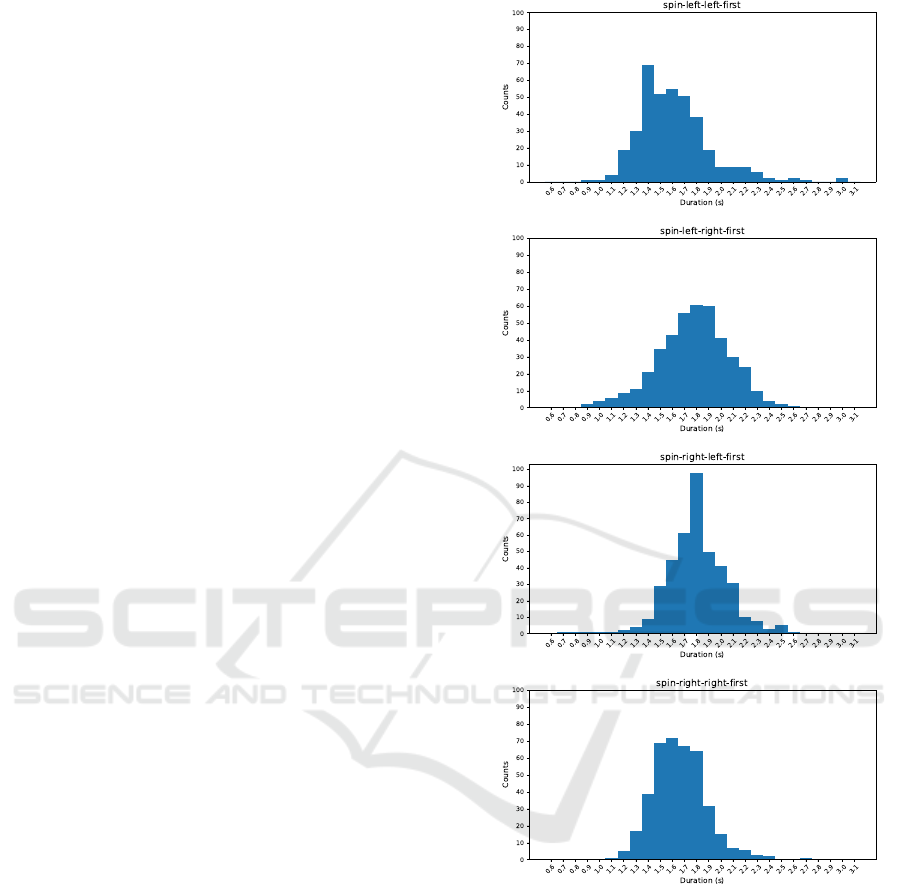
3.3 Single-gait Activities at Walking
Speed
The “spin-left” and “spin-right” activities in the CSL-
SHARE dataset can be described as the “Left face!”
or “Right face!” action in the army (but in daily situa-
tions, not so stressful as in military training). The ac-
quisition protocols are designed as “turn left/right 90
◦
in one step, left/right foot starts” (Liu et al., 2021a).
“Spin-left” is divided into “spin-left-left-first” and
“spin-left-right-first,” denoting which foot should be
moved first. Similarly, “spin-right” is also divided
into two activities in regard to the first-moved foot.
The reason for the subdivision is that these activities
only involve one gait cycle, and the data acquisition
only uses the sensors placed on the right-leg-worn
bandage. Therefore, the “left-foot-first” and “right-
foot- first” of these activities will lead to very differ-
Figure 3: Duration histograms of the single-gait human ac-
tivities spin-left-left-first, spin-left-right-first, spin-right-
left-first, and spin-right-right-first in the CSL-SHARE
dataset. The area under the curve equals the total number
of segment occurrences within 100-millisecond intervals.
ent signal patterns. On the contrary, activities involv-
ing multiple gait cycles (see Sections 3.2 and 3.4) are
not subdivided according to the first-moving foot.
As Table 1 and Figure 3 exhibit, the average dura-
tion of 90
◦
single-gait turns is larger than a single gait
cycle in walking activities due to the large turning an-
gles. The average duration is about 1.6 – 1.9 seconds.
It takes 9% more time to start with the right foot in a
left turn or start with the left foot in a right turn than to
start with the same side foot in the turning direction.
HEALTHINF 2022 - 15th International Conference on Health Informatics
684
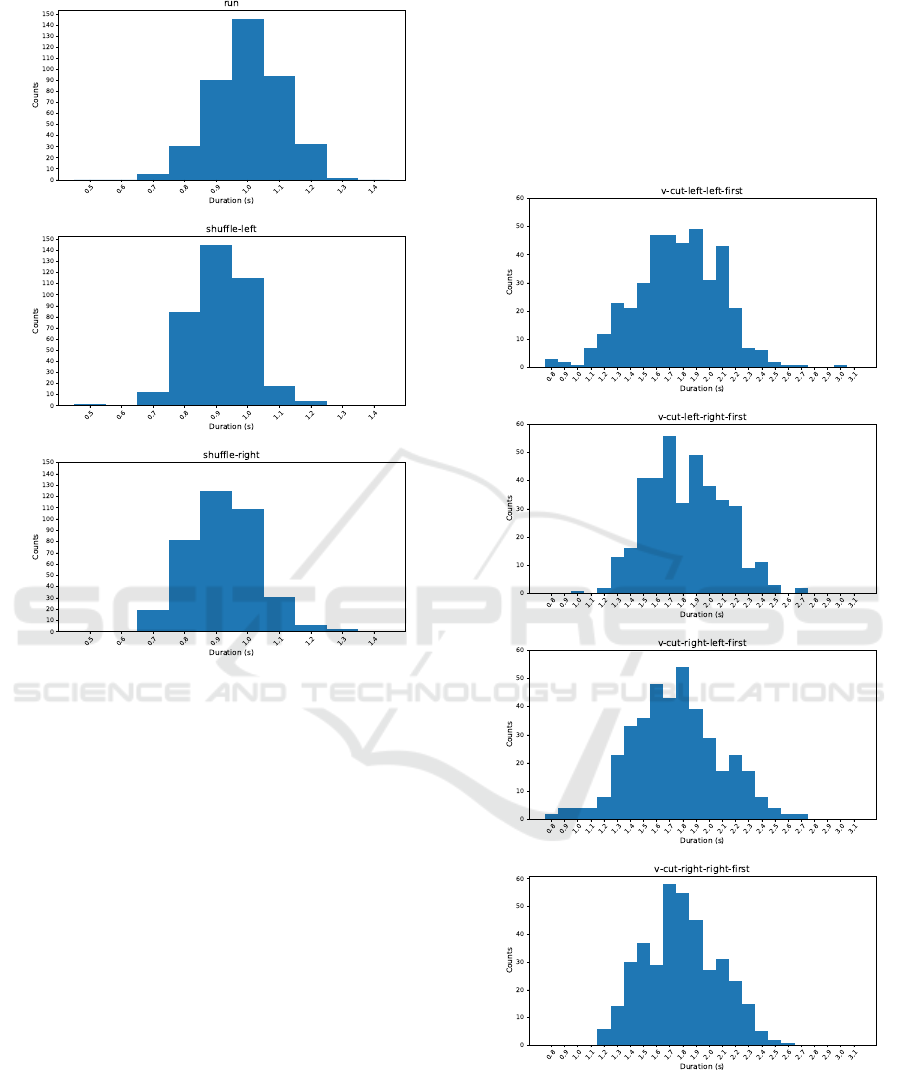
Figure 4: Duration histograms of one gait cycle in the cycli-
cal motions run, shuffle-left, and shuffle-right in the CSL-
SHARE dataset. The area under the curve equals the total
number of segment occurrences within 100-millisecond in-
tervals.
3.4 Activities of Gait-based Cyclical
Motions at Fast Speed
The acquisition protocol of “run” is basically the
same as that of “walk,” except the fast speed, while
the protocols of “shuffle-left/right” demand the sub-
ject to “move leftward/rightward with three lateral
gaits cycles, left/right foot starts, the other foot fol-
lows” (Liu et al., 2021a).
One gait cycle of the sports-related lateral shuf-
fling, as Table 1 and Figure 4 display, is the fastest
motion in the entire CSL-SHARE dataset, followed by
running. Their duration is around 1 second. Limited
to laboratory conditions, running was actually per-
formed at jogging speed instead of reaching full speed
in sports.
Roughly speaking, the duration of a single gait at a
fast-paced speed is about 30% shorter than at a walk-
ing speed. It can be highlighted that these three short-
est motions’ statistics present the least standard devi-
ations from subject to subject in the whole dataset.
3.5 Single-gait Activities at Fast Speed
“V-cut” in the CSL-SHARE dataset refers to the
single-gait motion of direction changing during run-
ning.
Figure 5: Duration histograms of the single-gait human
activities v-cut-left-left-first, v-cut-left-right-first, v-cut-
right-left-first, and v-cut-right-right-first in the CSL-
SHARE dataset. The area under the curve equals the total
number of segment occurrences within 100-millisecond in-
tervals.
How Long Are Various Types of Daily Activities? Statistical Analysis of a Multimodal Wearable Sensor-based Human Activity Dataset
685
The acquisition protocols of “V-cut” are stipulated
as follows: “turn 30
◦
left/right forward in one step
at jogging speed, left/right foot starts” (Liu et al.,
2021a). Similar to the “spin” activities, both “V-cut-
left” and “V-cut-right” are divided into two activities
regarding the first-moved foot, separately, due to the
same reason as explained in Section 3.3.
The average duration of all four “V-cut” activities
falls within 1.8 seconds to 1.9 seconds, as Table 1 and
Figure 5 indicate. Compared to the fact that there is a
significant duration difference of which foot is moved
first in the “spin” activities, for both “V-cut-left” and
“V-cut-right”, which foot is moved first affect only
slightly the activity duration, for which two reasons
can explain: Firstly, the “V-cut” activities themselves
require a large step with intense muscular prepara-
tion, where which foot to step first has no significant
influence; Secondly, it is stated in the protocol that
by “V-cut”, subjects only need to rotate 30
◦
, which
is one-third of the 90
◦
in spin activities (this is also
in line with common sense — it’s easy to turn 90
◦
while walking, but directional changing at fast speed
requires a larger motion radius).
Interestingly, whether turning 30 degrees to the
left or the right, starting with the right foot always
causes a little longer duration in average.
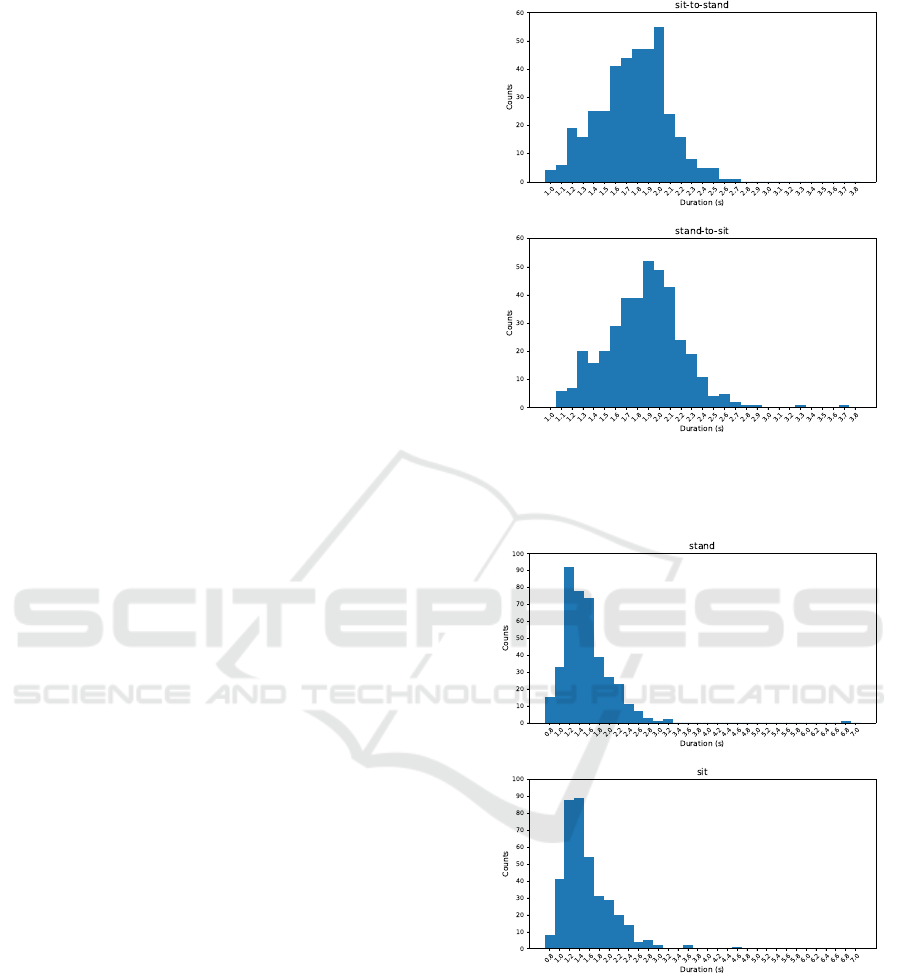
3.6 Activities of Transition between
Standing and Sitting
Figure 6 illustrates that the “stand-to-sit” activity, i.e.,
sitting down, has a similar duration distribution to
“sit-to-stand”, i.e., standing up. However, according
to Table 1 and Figure 6, it is noticeable that averagely,
sitting down is about 100 milliseconds longer than
standing up and has more outlier samples with long
duration, which is consistent with real-life situations:
The knee flexion is more difficult to act than the knee
extension, and a certain sense of organ self-protection
often accompanies knee bent.
3.7 Postures: Standing and Sitting
Activities
Like many public human activity datasets (see Section
2), CSL-SHARE also includes standing and sitting ac-
tivities, which should be classified as postures. Never-
theless, as mentioned in Section 1, these two activities
are considered no significant interindividual statisti-
cal reference, for which some clues can be glimpsed
through the long duration outliers in Figure 7. Due to
the outlier maximum duration values, these two his-
tograms use a 200-millisecond interval, different from
Figure 6: Duration histograms of the human activities sit-
to-stand and stand-to-sit in the CSL-SHARE dataset. The
area under the curve equals the total number of segment
occurrences within 100-millisecond intervals.
Figure 7: Duration histograms of the segmented postures
stand and sit in the CSL-SHARE dataset. The area under
the curve equals the total number of segment occurrences
within 200-millisecond intervals.
the 100-millisecond interval of other activities’ dura-
tion histograms, in order to display the horizontal axis
more clearly.
An arresting point can still be discovered. Even
if the organizer did not specify the duration of each
standing/sitting acquisition segment, and the partic-
ipants did not observe each other, the vast majority
HEALTHINF 2022 - 15th International Conference on Health Informatics
686

of participants still performed each standing and sit-
ting at about 1 to 2 seconds using the pushbutton, and
the overall duration statistics of these two activities
are approximately normally distributed. Such phe-
nomenons may involve a variety of topics such as
behavioral science and natural psychological rhythm,
which will not be expanded due to the different re-
search fields.
4 CONCLUSIONS
Relying on the rigorous acquisition protocol design
and execution, as well as the well-segmented data
corpus of the recently released multimodal wearable
sensor-based human activity dataset CSL-SHARE,
this paper analyzes the duration statistics and distri-
bution of 22 basic single motions of daily activities
and sports, providing research references for human
activity studies, such as segmentation, feature extrac-
tion, modeling, and recognition.
Through the big data statistical analysis of each
activity’s duration, we discovered that one single-
motion activity or one cycle in the activities of cycli-
cal motions has an average duration in the interval
from about 1 second to 2 seconds.
Furthermore, the duration distribution histograms
of each studied human daily activity or simple sports
activity evince interindividual similarities and natu-
rally obey a normal distribution. Even the two pos-
tures, standing and sitting, for which participants ar-
bitrarily decided each segment’s length, also conform
to this observation unpredictably.
As a classic case of applying activity duration
statistics in ML, (Liu and Schultz, 2019) used the pre-
vious dataset of CSL-SHARE with the same equip-
ment and investigated the transition from the offline
HAR modeling research to a real-time HAR system.
The activity duration was utilized as one of the ref-
erences to find the optimal balance between the on-
line decoding window length, the window overlap
length, and the recognition delay, endowing the real-
time demonstration with a satisfactory performance
and user experience.
We have noticed that different types of falling ac-
tivities also show interindividual similarity in terms
of duration, which is of great significance for human
activity research based on internal sensing and exter-
nal sensing, such as adopting HAR modeling for fall
detection and recognition (Xue and Liu, 2021). Dura-
tion analysis of typical falling activities will be a valu-
able topic to explore in the future, given appropriate
and adequate research materials.
REFERENCES
Amma, C., Krings, T., B
¨
oer, J., and Schultz, T. (2015).
Advancing muscle-computer interfaces with high-
density electromyography. In Proceedings of the 33rd
Annual ACM Conference on Human Factors in Com-
puting Systems, pages 929–938, New York, NY, USA.
ACM.
Ancans, A., Rozentals, A., Nesenbergs, K., and Greitans,
M. (2017). Inertial sensors and muscle electrical sig-
nals in human-computer interaction. In ICTA 2017
- 6th International Conference on Information and
Communication Technology and Accessibility, pages
1–6. IEEE.
Arous, M. A. B., Dunbar, M., Arfaoui, S., Mitiche,
A., Ouakrim, Y., Fuentes, A., Richardson, G., and
Mezghani, N. (2018). Knee kinematics feature selec-
tion for surgical and nonsurgical arthroplasty candi-
date characterization. In Proceedings of the 11th In-
ternational Joint Conference on Biomedical Engineer-
ing Systems and Technologies - Volume 3: BIOSIG-
NALS, pages 176–181.
Barandas, M., Folgado, D., Fernandes, L., Santos, S.,
Abreu, M., Bota, P., Liu, H., Schultz, T., and Gam-
boa, H. (2020). TSFEL: Time series feature extraction
library. SoftwareX, 11:100456.
Beddiar, D. R., Nini, B., Sabokrou, M., and Hadid,
A. (2020). Vision-based human activity recogni-
tion: A survey. Multimedia Tools and Applications,
79(41):30509–30555.
Ejupi, A., Gschwind, Y. J., Valenzuela, T., Lord, S. R., and
Delbaere, K. (2016). A kinect and inertial sensor-
based system for the self-assessment of fall risk: A
home-based study in older people. HCI 2016 - 18th
International Conference on Human-Computer Inter-
action, 31(3-4):261–293.
Gehrig, D. (2015). Automatic Recognition of Concurrent
and Coupled Human Motion Sequences. PhD thesis,
Karlsruher Institut f
¨
ur Technologie.
Georgi, M., Amma, C., and Schultz, T. (2015). Recognizing
hand and finger gestures with imu based motion and
emg based muscle activity sensing. In Proceedings of
the International Conference on Bio-inspired Systems
and Signal Processing - BIOSIGNALS, (BIOSTEC
2015), pages 99–108. INSTICC, SciTePress.
Hartmann, Y., Liu, H., Lahrberg, S., and Schultz, T. (2022).
Interpretable high-level features for human activity
recognition. In BIOSIGNALS 2022 — 15th Interna-
tional Conference on Bio-inspired Systems and Signal
Processing. INSTICC, SciTePress. forthcoming.
Hartmann, Y., Liu, H., and Schultz, T. (2020). Feature space
reduction for multimodal human activity recognition.
In Proceedings of the 13th International Joint Confer-
ence on Biomedical Engineering Systems and Tech-
nologies - Volume 4: BIOSIGNALS, pages 135–140.
INSTICC, SciTePress.
Hartmann, Y., Liu, H., and Schultz, T. (2021). Feature
space reduction for human activity recognition based
on multi-channel biosignals. In Proceedings of the
14th International Joint Conference on Biomedical
How Long Are Various Types of Daily Activities? Statistical Analysis of a Multimodal Wearable Sensor-based Human Activity Dataset
687

Engineering Systems and Technologies, pages 215–
222. INSTICC, SciTePress.
Hu, B., Rouse, E., and Hargrove, L. (2018). Benchmark
datasets for bilateral lower-limb neuromechanical sig-
nals from wearable sensors during unassisted locomo-
tion in able-bodied individuals. Frontiers in Robotics
and AI, 5:14.
Jung, Y. and Cha, B. (2010). Gesture recognition based on
motion inertial sensors for ubiquitous interactive game
contents. IETE Technical Review, 27(2):158–166.
Karagiannaki, K., Panousopoulou, A., and Tsakalides, P.
(2016). The forth-trace dataset for human activity
recognition of simple activities and postural transi-
tions using a body area network.
Lanshammar, H. (1987). Estimation of gait cycle dura-
tion and stride length from one marker kinematic data.
In Biomechanics: Basic and Applied Research, pages
129–134. Springer.
Liu, H. (2021). Biosignal Processing and Activity Model-
ing for Multimodal Human Activity Recognition. PhD
thesis, University of Bremen.
Liu, H., Hartmann, Y., and Schultz, T. (2021a). CSL-
SHARE: A multimodal wearable sensor-based human
activity dataset. Frontiers in Computer Science, 3:90.
Liu, H., Hartmann, Y., and Schultz, T. (2021b). Mo-
tion Units: Generalized sequence modeling of hu-
man activities for sensor-based activity recognition. In
EUSIPCO 2021 — 29th European Signal Processing
Conference, pages 1506–1510.
Liu, H., Hartmann, Y., and Schultz, T. (2022). A practical
wearable sensor-based human activity recognition re-
search pipeline. In BIODEVICES 2022 — 15th Inter-
national Conference on Biomedical Electronics and
Devices. INSTICC, SciTePress. forthcoming.
Liu, H. and Schultz, T. (2018). ASK: A framework for data
acquisition and activity recognition. In Proceedings of
the 11th International Joint Conference on Biomedi-
cal Engineering Systems and Technologies - Volume 3:
BIOSIGNALS, pages 262–268. INSTICC, SciTePress.
Liu, H. and Schultz, T. (2019). A wearable real-time hu-
man activity recognition system using biosensors in-
tegrated into a knee bandage. In Proceedings of the
12th International Joint Conference on Biomedical
Engineering Systems and Technologies - Volume 1:
BIODEVICES, pages 47–55. INSTICC, SciTePress.
Loose, H., Tetzlaff, L., and Bolmgren, J. L. (2020). A public
dataset of overground and treadmill walking in healthy
individuals captured by wearable imu and semg sen-
sors. In Biosignals 2020 - 13th International Confer-
ence on Bio-Inspired Systems and Signal Processing,
pages 164–171. INSTICC, SciTePress.
Mezghani, N., Fuentes, A., Gaudreault, N., Mitiche, A.,
Aissaoui, R., Hagmeister, N., and De Guise, J. A.
(2013). Identification of knee frontal plane kinematic
patterns in normal gait by principal component anal-
ysis. Journal of Mechanics in Medicine and Biology,
13(03):1350026.
Micucci, D., Mobilio, M., and Napoletano, P. (2017).
UniMiB SHAR: A dataset for human activity recog-
nition using acceleration data from smartphones. Ap-
plied Sciences, 7(10):1101.
Reiss, A. and Stricker, D. (2012). Introducing a new bench-
marked dataset for activity monitoring. In ISWC 2012
- 16th International Symposium on Wearable Comput-
ers, pages 108–109. IEEE.
Roggen, D., Calatroni, A., Rossi, M., Holleczek, T., F
¨
orster,
K., Tr
¨
oster, G., Lukowicz, P., Bannach, D., Pirkl, G.,
Ferscha, A., et al. (2010). Collecting complex activ-
ity datasets in highly rich networked sensor environ-
ments. In INSS 2010 - 7th International Conference
on Networked Sensing Systems, pages 233–240. IEEE.
Santos, S., Folgado, D., and Gamboa, H. (2020). Upper-
body movements: Precise tracking of human motion
using inertial sensors.
Sztyler, T., Carmona, J., V
¨
olker, J., and Stuckenschmidt,
H. (2016). Self-tracking reloaded: Applying process
mining to personalized health care from labeled sen-
sor data. 9930:160–180.
Sztyler, T. and Stuckenschmidt, H. (2016). On-body lo-
calization of wearable devices: An investigation of
position-aware activity recognition. In PerCom 2016
- 14th IEEE International Conference on Pervasive
Computing and Communications, pages 1–9. IEEE
Computer Society.
Whittle, M. W. (1996). Clinical gait analysis: A review.
Human movement science, 15(3):369–387.
Whittle, M. W. (2014). Gait analysis: An introduction.
Butterworth-Heinemann.
Xue, T. and Liu, H. (2021). Hidden Markov Model and its
application in human activity recognition and fall de-
tection: A review. In CSPS 2021 - 10th International
Conference on Communications, Signal Processing,
and Systems.
Zok, M. (2014). Inertial sensors are changing the games.
In ISISS 2014 - International Symposium on Inertial
Sensors and Systems, pages 1–3. IEEE.
HEALTHINF 2022 - 15th International Conference on Health Informatics
688
