
Real Life Pollution Measurement of Cairo
Youssef Khalil
a
, Mariam Zaky, Mostafa ElHayani
b
and Hassan Soubra
Media Engineering and Technology, German University in Cairo, Egypt
Keywords:
ITS, AQI, Pollution, IoT, Machine Learning.
Abstract:
Today, the cost associated to the significant growth in the transportation field is air and noise pollution. Ac-
cording to the World Health Organization (WHO), an estimate of seven million people worldwide die every
year due to breathing bad quality air, in addition, morbidities such as high blood pressure, heart disease, sleep
disturbances and stress might be linked to noise pollution. In this context, many researchers have done efforts
in measuring air and noise pollution to be fully aware of the areas that have a negative impact on human health.
In this paper an intelligent transportation system is proposed which uses a low-cost sensor device and a mobile
application to monitor air pollution and noise pollution in Cairo, Egypt successively.
1 INTRODUCTION
The increase of vehicles with the existence of other
factors that cause a significant increase in the pol-
lution level has become a serious issue. Due to
the deficient urban planning of the city in the past,
homes, universities, schools, offices, hospitals, and
other community buildings were routinely built close
to the main roads to be easily accessed without giv-
ing attention to whether this zone is a safe or an un-
safe area for these sites. With the wide use of the
internet of things (IoT) technology nowadays, intelli-
gent transportation system (ITS) is developed to make
positive changes in the transportation system by pro-
viding the user a safer and healthier environment. In
our project, we are examining the potential of ITS
towards the pollution issue by pointing out the mea-
surement of noise and air pollution to inform the user
about the pollution levels in any chosen area. Our
aim is to develop a way to monitor a real-time air and
noise pollution measurement using low cost sensors
in order to detect the areas that have the most nega-
tive impact on human health, and to generate a data-
set documentation for each pollution type. An IoT
device is developed consisting of an MQ135 sensor,
which is responsible for measuring the air quality, and
a GP2Y1010AU0F dust sensor, to measure the PM10
in the air.
A mobile application is developed to record sound
levels using the built-in microphone sensor and calcu-
a
https://orcid.org/0000-0002-8151-7006
b
https://orcid.org/0000-0002-3679-2076
late noise pollution in decibels (dB). The application
accesses the location to spread awareness for the in-
dividuals. Based on the results that are collected and
using machine learning, a predictor model was used
to predict the level of noise and air pollution whether
it was in general or specific areas and chosen time-
frame. This project is a part of a bigger project which
aims to reduce traffic air and noise pollution inside ur-
ban cities. To fulfill this, pollution produced by cars
as well as the desired city pollution levels are mea-
sured, and accordingly cars are being routed inside
the city; If either the city’s noise or air pollution level
is more that the set threshold, or if the car itself is pol-
luting enough to make the pollution level exceeds the
set threshold, so this particular car will be routed in a
way to minimize its traveling distance inside the city
(Zaky and Soubra, 2021).
2 LITERATURE REVIEW
Air and noise pollution measurement is considered a
serious concern covered by several studies, in this sec-
tion previous studies done in measuring air and noise
pollution will be discussed. (Gryech et al., 2020) in
Morocco have used an approach to identify areas with
poor air quality. PM10 concentrations exceeded the
limit only in the presence of some vehicles otherwise
PM2.5 remained low and stable. The results of this
paper show how efficient their strategy to identify ar-
eas with low air quality. In (Chiang et al., 2020), They
carried a device for monitoring air quality on a mo-
torcycle and moved through a chosen route inside the
222
Khalil, Y., Zaky, M., ElHayani, M. and Soubra, H.
Real Life Pollution Measurement of Cairo.
DOI: 10.5220/0010896000003117
In Proceedings of the 11th International Conference on Operations Research and Enterprise Systems (ICORES 2022), pages 222-230
ISBN: 978-989-758-548-7; ISSN: 2184-4372
Copyright
c
2022 by SCITEPRESS – Science and Technology Publications, Lda. All rights reserved

city on six main roads, the results shows that their pro-
posed system can effectively monitor PM2.5 concen-
trations while moving. In Zagreb, (Marjanovi
´
c et al.,
2017) conducted a study using the carry of air mon-
itor wearable devices following a predefined route.
The predefined route was chosen to include 2 major
roads with heavy traffic, a park, a residential area, and
a business area. it was concluded that air pollution
is strongly depending on the traffic exposure. Some
studies have done the experiment on one road to mea-
sure and evaluate the pollution produced by traffic.
In (Moutinho et al., 2020), measurements were taken
along a highway in Atlanta.The results obtained were
compared to measurements that were taken in an ur-
ban area around Atlanta, observing that the concen-
trations of CO and NO2 in the highway were 35%
and 57% higher than the urban background concentra-
tions, respectively. In Pakistan, (Aamer et al., 2018)
conducted a data-set containing around 25000 sam-
ples during a month in a road segment between 2
cities. It was observed that humidity and temper-
ature are negatively correlated against NO2 and in-
herently affect the NO2 balance in air. Other stud-
ies have taken their measurements from fixed loca-
tions either on long or short term. (Gunawan et al.,
2018) developed a portable device placed in three dif-
ferent locations, a hostel, a university, and a roadside.
The obtained results were compared to a dataset gen-
erated by air quality monitoring station at the same
time of the experiment, showing that different places
can have different AQI value even though they are
nearby to each other. (Spandana and Shanmughasun-
dram, 2018) took place in Amrita University, India, to
determine the pollution level inside the campus and
also in a metro city (Bengaluru). The results indi-
cated that the university atmosphere is less polluted
than Bengaluru. (Duangsuwan et al., 2018) measured
the AQI in just 2 points (Bangkok Yai district, and
Pathumwan district, Bangkok.) from Oct. 7 to Oct.
13, 2017. The results showed that the AQI level has
not exceeded 100, making it a safe zone for people.
An Android-based application was implemented by
(Ghosh et al., 2019) that uses the built-in microphone
sensor to capture ambient noise levels and the GPS
sensor for identifying the location, and for validation
they compared the data collected by the application
with sound level meter (Meco-970P 3). The outcome
of this test was illustrated, and the variation of the
application results compared to the sound meter was
in the range of ±3 dB, which clarify the efficient of
the mobiles’ microphone sensors for detecting noise
pollution. (Marjanovi
´
c et al., 2017) proposed a real-
time system to monitor air and noise pollution. They
implemented a mobile application which uses mobile
phone’s microphone to collect noise data and con-
verts the recorded sound pressure to dB and shows
the equivalent sound pressure level for each second in
dB. The results showed that the average noise level
is higher 3dB at the rush hours due to the increas-
ing numbers of vehicles. AQI is the unit or the way
of communication between the institutes responsible
for calculating air pollution level and the public. AQI
is targeting many gasses and sources of air pollu-
tion like (Carbon Monoxide, Lead, Nitrogen Oxides,
Ozone, Particulate matter including PM2.5 and PM10
and Sulfur dioxide). Air quality standards were set
by the US Environmental Protection Agency (EPA)
and were divided into two parts (epa, ); Primary stan-
dards, which were set for the public health protection,
as protecting the health of “sensitive” groups such as
asthmatics, children, and the elderly people, and the
secondary standards, which provide protection to the
public welfare, this includes preventing reduced vis-
ibility and damage to animals, crops, vegetation, and
buildings. Parts per million by volume (PPM), parts
per billion by volume (PPB), and micro-grams per cu-
bic meter of air µg/m3 are the units of AQI measure-
ment. For noise levels, the WHO set guideline val-
ues based on specific environment and large health
impacts (Berglund et al., 2000). The guideline val-
ues are presented taking into consideration all harmful
health effects identified in a particular environment.
The negative effects of noise exposure refer to tempo-
rary or long-term impairment of physical, psycholog-
ical, or social functioning. Decibels (dB) is the unit of
measuring sound or noise level. No study was found
to monitor air or noise pollution in Cairo, Egypt. All
the devices located in Cairo are stationary with a high
cost and only one that is a real-time device, but it only
monitors and measures Pm2.5 concentration in the air
from Katameya Heights in New Cairo city(cit, ). Only
one study took place in Egypt for monitoring noise
pollution, particularly in Alexandria in 2009, (Ghat-
tas, 2009). The literature has proven that no data was
collected in a city-scale. It’s either collected indoors
or in specifically selected regions inside the cities. In
this paper, we aim to generate a dataset for both air
and noise pollution, as it will be the first dataset doc-
umentation for these types of pollution inside Cairo.
Our approach will be as follows; regarding air pol-
lution measurement we are measuring the concentra-
tion of Carbon Dioxide and Nitrogen Oxide as they
are the common gasses that are emitted from vehicles
on the road. In addition of the concentration of PM10
in air, this will be done inside New Cairo City in 2
locations. For noise pollution measurement, a mobile
application was developed and distributed among the
public. The application will have access to the mo-
Real Life Pollution Measurement of Cairo
223
bile microphone sensor and the GPS sensor. It will
help the user to be informed by the amount of noise
pollution in their area by calculating a real-time noise
intensity value. A noise pollution dataset will be col-
lected from selected main roads and a comparison of
the values in peak-hours and off-hours as well as on
working days and weekends will be made.
3 METHODOLOGY
The data is received by NodeMCU which is pro-
grammed to transfer the data and send it to ThingS-
peak using its built-in Wifi Chip. Every data received
consists of 7 fields; a unique ID to the record, the time
and the date of the reading, the location, current AQI
value, temperature, humidity, and the PM10 value.
Arduino MEGA is added to the device connecting
to it the 3 sensors, and serial communication is es-
tablished between the Arduino Mega and nodeMCU.
The user should press on button ”Start” to begin the
recording, once the user clicks it, the application mea-
sures the noise level in dB and starts recording for
10 seconds. Unless the user clicks the stop button,
the application will keep saving data in Firebase ev-
ery 1 minute. If the dB value exceeded 80dB the
record is saved in Firebase. The data collected con-
sists of sound level in decibels, the date of the read-
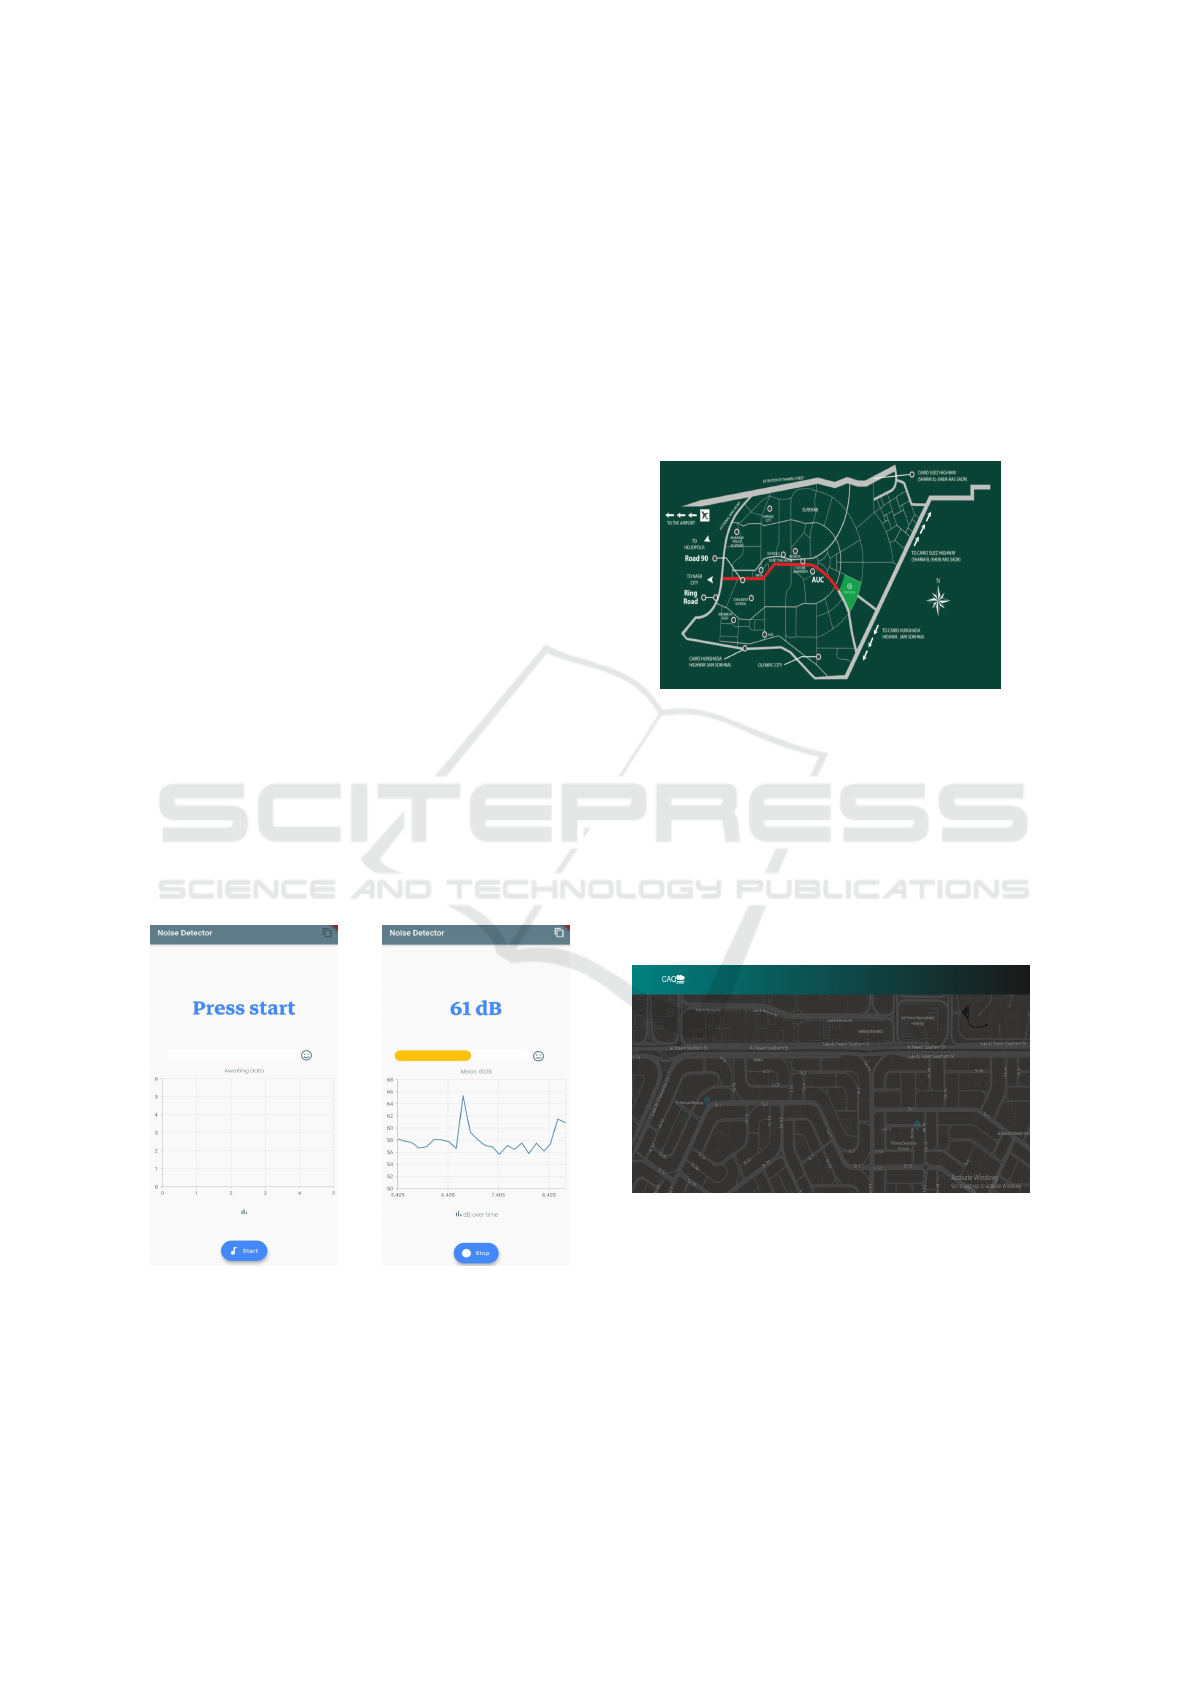
ing, and the phone’s location. Figure 1 shows screen-
shots from the application before and after the record-
ing starts.
(a) Before clicking Start (b) During recording
Figure 1: Screenshot of the Mobile Application.
Regarding the air pollution monitoring, complica-
tions were found with being able to station the device
for days, which made it difficult to measure the air
quality all over Cairo. Hence, we down-scaled the
region of measuring air pollution to be done in New
Cairo city, It is one of the cities that were built in re-
cent years, it lies east of Cairo and has 3 main areas;
the first, third, and fifth settlements. The city has a
good transportation network of buses and micro-buses
that makes it easy to be reached from any other city in
Cairo. The most famous and most populated district
in New Cairo is the 5
th
district, 90
th
Road is consid-
ered as the main entrance to the 5
th
district. Heavy
traffic can be observed on the 90
th
road and it is one
of its major issues due to the huge amount of services
located around it.
Figure 2: 90
th
Road on the map.
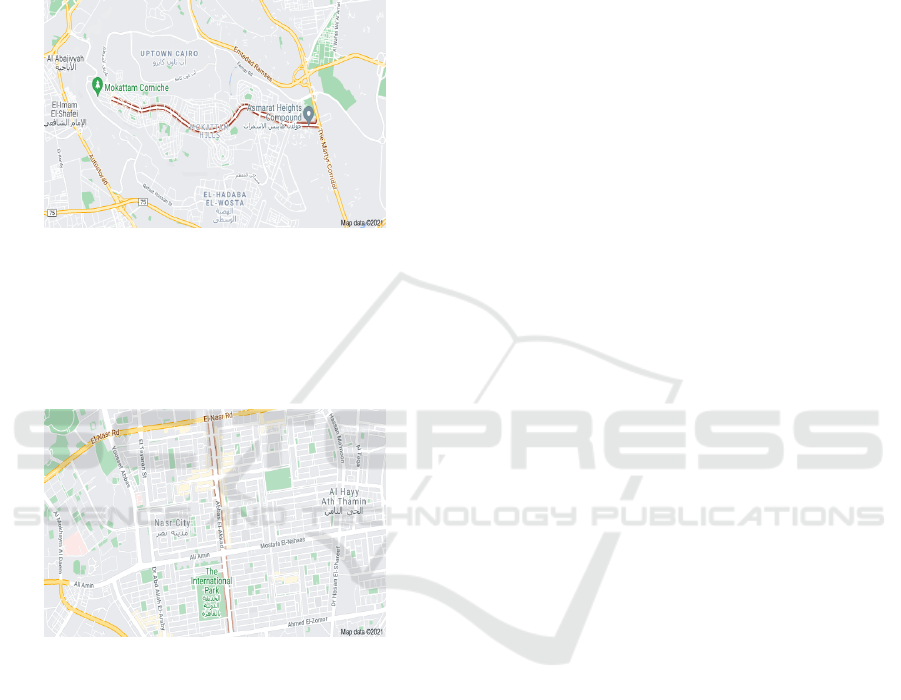
The device has been stationed in 2 locations
around the 90
th
St. in New Cairo as shown in Fig-
ure 3, the first location is a building that is located ap-
proximately 250 meters far away from the 90
th
street.
The device is set to be 8 meters above the ground and
placed in a terrace of the building facing the street.
The other location is about 100 meters away from the
90
th
street. The device also placed in the terrace of the
building as well at height 4 meters above the street.
Figure 3: Both locations on the map.
3.1 Noise Pollution
The application is distributed among volunteers to
measure noise levels all over Cairo to help in obtain-
ing the most number of records and to be able to mea-
sure noise pollution in many areas. Besides that, 3
main streets were chosen in different regions in Cairo
that are popular of being crowded in the peak hours.
ICORES 2022 - 11th International Conference on Operations Research and Enterprise Systems
224
The 3 streets that have been chosen are 90
th
Street
in New Cairo, Abbas Al-Akkad in Nasr city, and 9
th
street in Al-Mokkatam. Al-Mokkatam district is a fa-
mous neighborhood in Cairo. 9
th
Street is the most
famous and exclusive street in Al-Mokkatam city, as
it is the main and the only entrance for this area and
goes through the neighborhood.
Figure 4: 9
th
street on Google maps.
Nasr City is another one of the famous districts in
Cairo. It’s also known for various landmarks and is
mostly crowded. Abbas Al Akkad street, shown in
Figure 5, is considered as the backbone of Nasr City,
it’s one of busiest shopping streets in Cairo.
Figure 5: Abbas Al Akkad street on Google maps.
4 RESULTS
Air Pollution. Air pollution measurement has been
done in 2 locations in exact locations ”Building 130,
St. No.54, First New Cairo, Cairo Governorate” and
”Building 241, St. No.55, First New Cairo, Cairo
Governorate” gathering around 3307 samples from
both locations. The data-set obtained contains 6
fields, AQI value, Pm10 concentration, Temperature,
humidity , the ID of the location (Latitude , Longi-
tude) that generated automatically by MongoDB, and
the date of the record. All the data represented in this
section is just a subset of the full dataset. The experi-
mental setup of the project is as follows.
Computing Unit. A NodeMCU ESP8266 module is
used along with its ESP-12E module containing an
ESP8266 chip having Tensilica Xtensa 32-bit LX106
microprocessor. The data and programs are stored
in 4MB of Flash memory. We also used an Arduino
Mega 2560 board.
Sensors Unit. The sensors used for data acquisition
are as follows:
1. MQ135: used in measuring AQI and to detect and
measure the concentrates of NH3, NOx, Alcohol,
Benzene, Smoke, CO2 in air.
2. DHT11: it is an ultra-low-cost digital temperature
and humidity sensor.
3. GP2Y1010AU0F: especially effective in detect-
ing very fine particles like cigarette smoke and
dust, and is commonly used in air purifier sys-
tems.
First Location. As this location is in front of a fa-
mous PlayStation & Cafe and a big mall, the week-
end days are the peak days in which the cafe receives
the most number of customers, and the peak hours
of these days would be at night; the time that the
cafe is in full capacity, and the off hours would be
at any other time in the day. However, in the work-
ing days peak hours would be in the morning and af-
ternoon and the off-hours would be at night as regu-
lar, as the cafe and the mall are almost empty in the
working days. At this location, samples were taken
within a period of 8 days from 09 − 07 − 2021 to
16 − 07 − 2021. A total of 1784 samples were taken
at different times in all the days monitoring the AQI
in PPM, temperature in Celsius, humidity as a per-
centage and the concentration of PM
10
in µg/m
3
. We
discuss the results for the following 3 scenarios:
• A scenario is represented within the peak hours
on the weekends which is consider the worst-case
scenarios.
• A scenario within an off-hour in a weekend.
• An exceptional case occurred during a working
day due to being the same day as the EURO 2020
final game that played on 11 − 07 −2021.
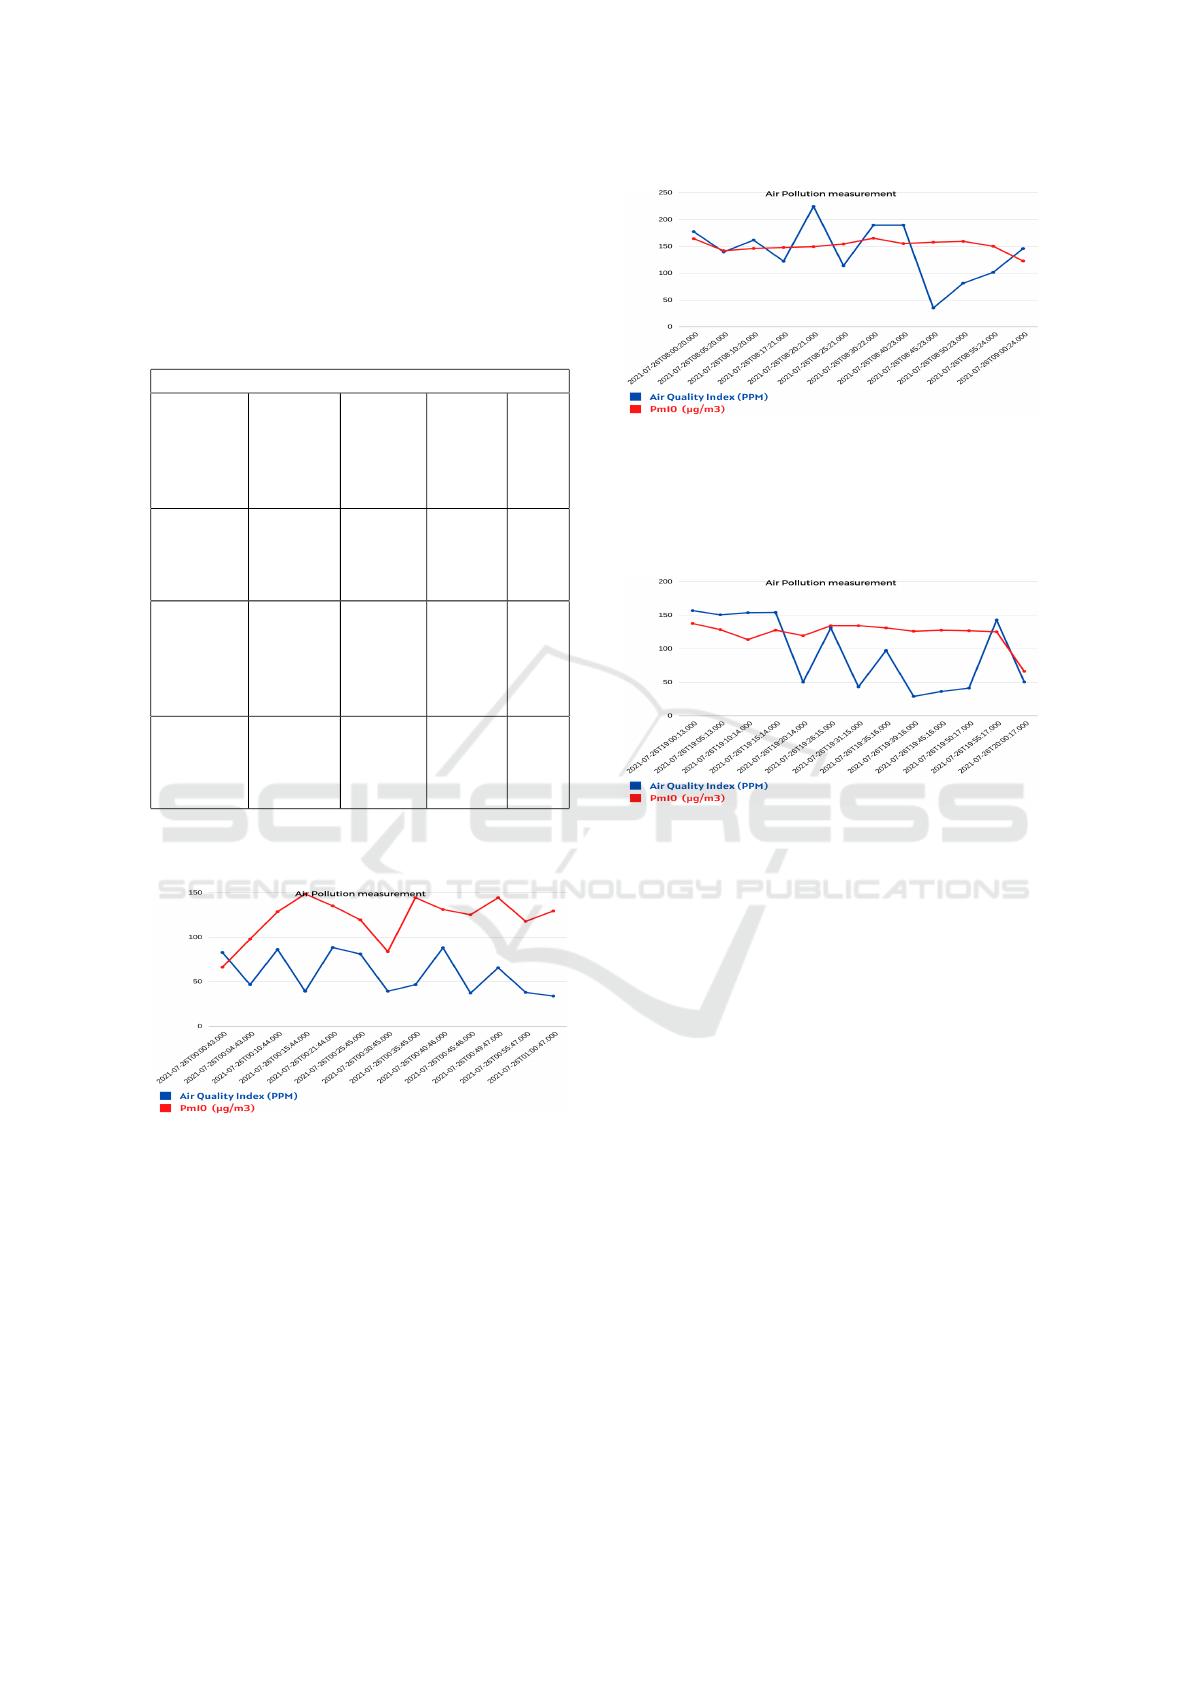
Results
• Peak hour on a weekend.
Figure 6 shows 12 out of 56 total readings taken
for both PM
10
and AQI on a weekend. A max-
imum AQI value 214.096 PPM and minimum
value 33.00 PPM, and a maximum concentration
of PM
10
159.27 µg/m
3
and minimum 23.97 µg/m
3
were measured.
Real Life Pollution Measurement of Cairo
225
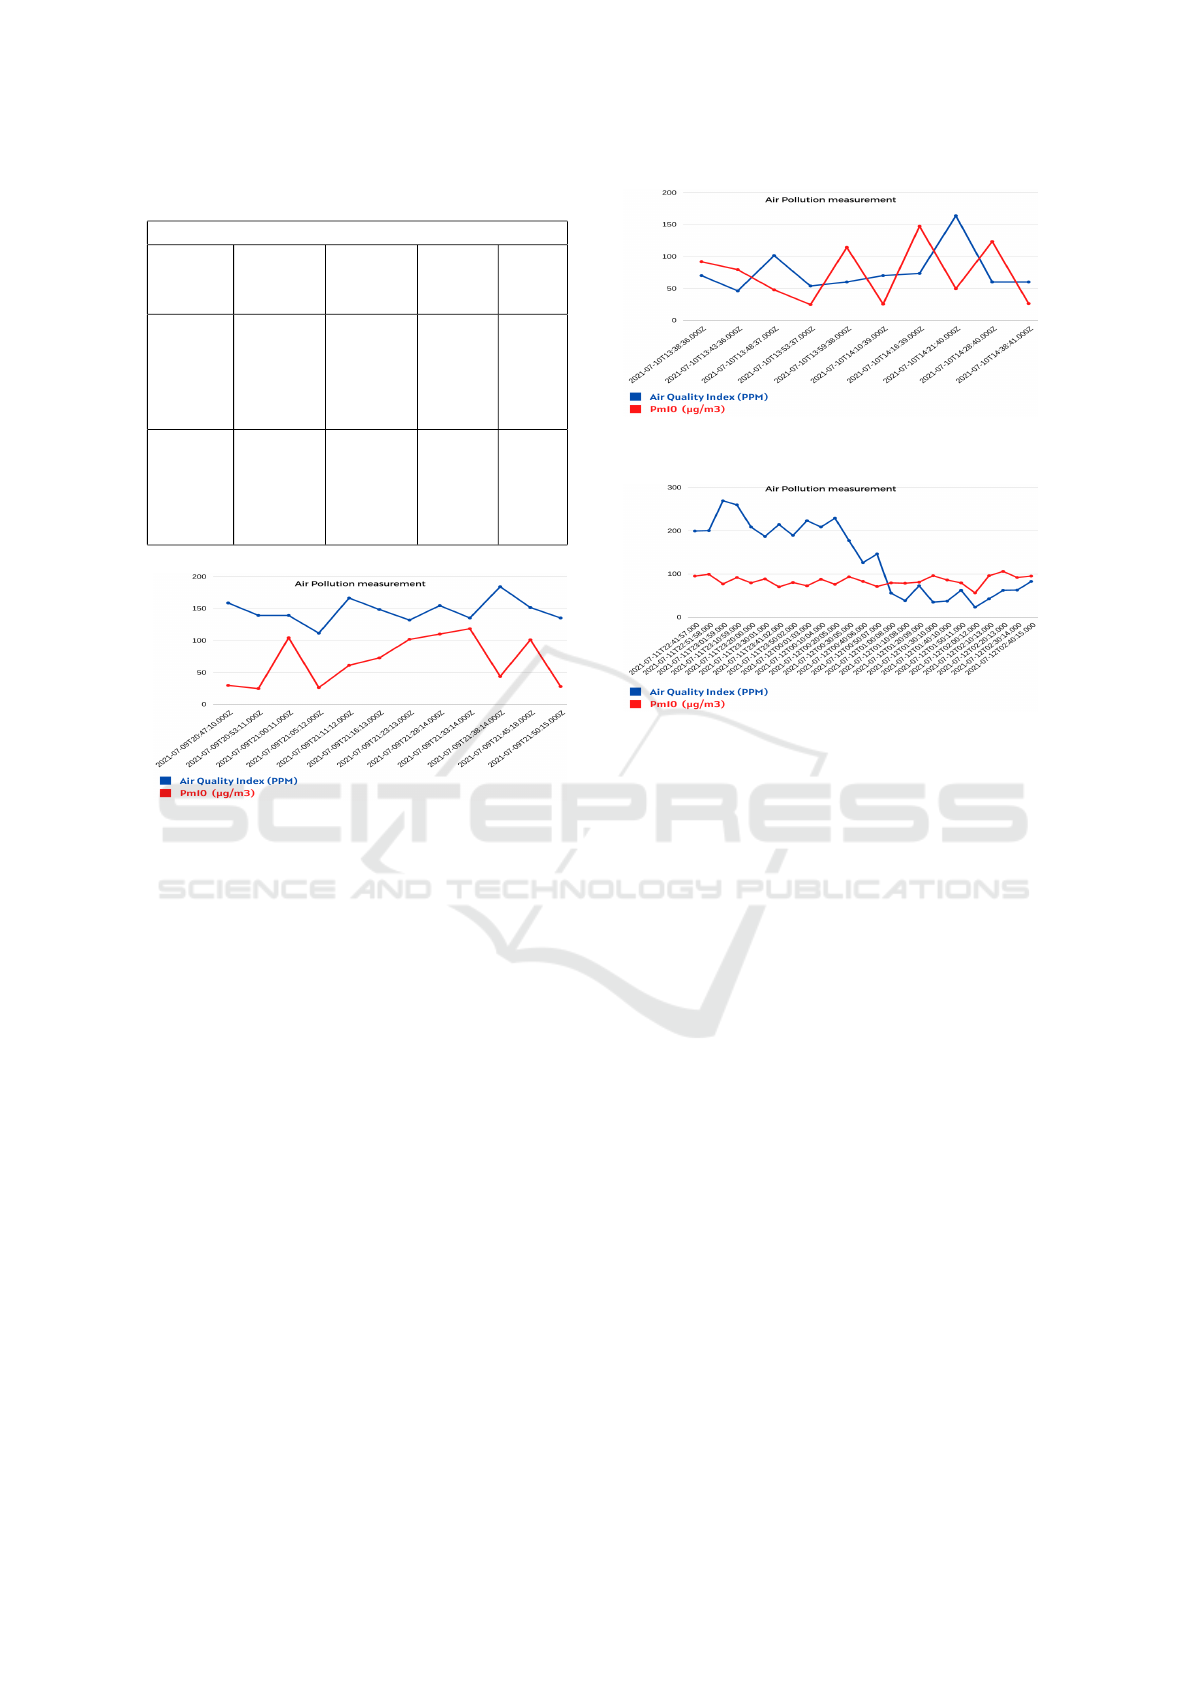
Table 1: First location Air pollution measurement Table.
Air Pollution measurements
Scenario Time Average
AQI
value
Average
PM10
Figure
Peak
hour
in the
week-
end
08:47PM
-
09:50PM
136.88
PPM
70.07
µg/m
3
6
Peak
hour
in the
week-
end
10:20PM
-
11:20PM
145.19
PPM
44.91
µg/m
3
7
Figure 6: Graph of Air pollution measurement on 09-07-
2021.
• Off-hour on a weekend.
Figure 7 shows 10 out of total 45 readings of PM
10
and AQI taken on an off-hour on a weekend. A
maximum AQI value 171.568 PPM and minimum
value 45 PPM, and a maximum concentration of
PM
10
147.65 µg/m
3
and minimum 23.97 µg/m
3
were found.
Figure 8 shows 25 readings out of total 218 sam-
ples of both PM
10
and AQI taken within 4 hours
at the same time as the EURO 2020 final game
between England and Italy and as stated above,
the device is located in front of a famous cafe,
which lead to a traffic increase in front of the
building. The game started at 9:00 PM (GMT+2),
extra 45 minutes were added; so the whole game
took around 3 hours. So the 4-hour period of the
graph can be divided into 3 parts. First part dur-
ing the game (10:40 PM - 12:00 AM), and after
the game (12:00 AM - 1:00 AM) in which peo-
ple started leaving, last part after the ceremony
(01:00 AM - 2:40 AM) in which the rest of the
people left. During the game, 68 samples were
taken with an average AQI equals to 217.898 PPM
with maximum value 299.775 PPM and minimum
value 153.724 PPM, and an average concentra-
Figure 7: Graph of Air pollution measurement on 10-07-
2021.
Figure 8: Graph of Air pollution measurement on 11-07-
2021 / 12-07-2021.
tion of PM
10
equals to 85.888 µg/m
3
with max-
imum value 113.62 µg/m
3
and minimum value
62.16 µg/m
3
. In time right after the game fin-
ished and during the ceremony, 54 samples were
taken with an average AQI equals to 153.91 PPM
with maximum value 229.328 PPM and mini-
mum value 53.86 PPM, and an average concentra-
tion of PM
10
equals to 83.1559 µg/m
3
with max-
imum value 115.28 µg/m
3
and minimum value
53.86 µg/m
3
, in the last part, 78 samples were
taken with an average AQI equals to 51.157 PPM
with maximum value 96.34 PPM and minimum
value 18.005 PPM, and an average concentration
of PM
10
equals to 82.143 µg/m
3
with maximum
value 126.07 µg/m
3
and minimum value 48.87
µg/m
3
.
Second Location. Being a regular location with no
popular places around, peak hours will be as usual in
which traffic exists; from 7:00 am to 10:00 am and
from 3:00 PM to 6:00 PM as people going or coming
from their daily destinations (work,universities,etc.)
in the working days from Sunday to Thursday, as Fri-
days and Saturdays are the weekend in Egypt. Sam-
ples were taken within a period of 5 days from 25-
07-2021 to 29-07-2021, in the meanwhile a total of
1523 samples were taken at different times in all the
days monitoring the AQI in PPM, temperature in Cel-
sius, humidity as a percentage and the concentration
ICORES 2022 - 11th International Conference on Operations Research and Enterprise Systems
226
of PM
10
in µg/m
3
. Below we are representing 3 sce-
narios in a working day:
• After midnight of a working day.
• Within a peak hour of the same working day.
• Within an off hour of the same working day.
Air Pollution measurements
Scenario Time Average
AQI
value
Average
Pm10
Con-
centra-
tion
Graph
After
midnight
(working
day)
12:00AM
-
01:00AM
62.79
PPM
120.83
µg/m
3
Fig
9
Peak
hour
(same
working
day)
09:49AM
-
10:59AM
142.26
PPM
148.26
µg/m
3
Fig
10
Off hour
(same
working
day)
07:00PM
-
08:00PM
101.71
PPM
127.979
µg/m
3
Fig
11
• After midnight of a working day.
Figure 9: Graph of Air pollution measurement on 26-07-
2021.
In figure 9, 12 out of total 48 samples are shown of
both PM
10
and AQI during midnight of a working
day. A maximum AQI value 169.672 PPM and
minimum value 20.86 PPM were measured, and
a maximum PM
10
value 148.48 µg/m
3
and mini-
mum value 63.82 µg/m
3
were found.
• Peak hour of a working day.
Figure 10 shows 12 out of 57 total samples of
both PM
10
and AQI measured during a working
day. 231.728 PPM and 33.7 PPM were the maxi-
mum and minimum values found for the AQI. For
Figure 10: Graph of Air pollution measurement on 26-07-
2021.
the PM
10
concentration. 181.69 µg/m
3
and 87.89
µg/m
3
were its maximum and minimum values.
• Off hour of a working day.
Figure 11: Graph of Air pollution measurement on 26-07-
2021.
Figure 11 shows 13 out of 50 total samples taken
during a working day evening. A maximum AQI
value equals to 193.289 PPM and minimum value
equals to 26.731 PPM were found, and maximum
PM
10
concentration 156.78 µg/m
3
and minimum
66.31 µg/m
3
were found.
4.1 Noise Pollution
Noise Pollution measurement has been done by 2
methods, getting readings from particular main streets
in different areas in Cairo, each street of them has its
own features that make it differs from the others as
stated in section 3.1 taking into consideration to take
readings in the peak and off-hours in each street, the
second method is done by distributing on the public to
get readings in random places with different time in-
side Cairo city. All the readings are combined in one
data-set consists of 5 fields; location address name,
location coordinates, DB value, the date and time of
the sample, Running on ( the device in which the ap-
plication is running on). Below we are introducing a
heat map for each street of the following streets (90
th
St, Abbas Al-Akkad St.) in addition to a heat map for
all the readings that are taken inside Cairo. All the
Real Life Pollution Measurement of Cairo
227
data represented in this section is just a sub data from
the full data set.
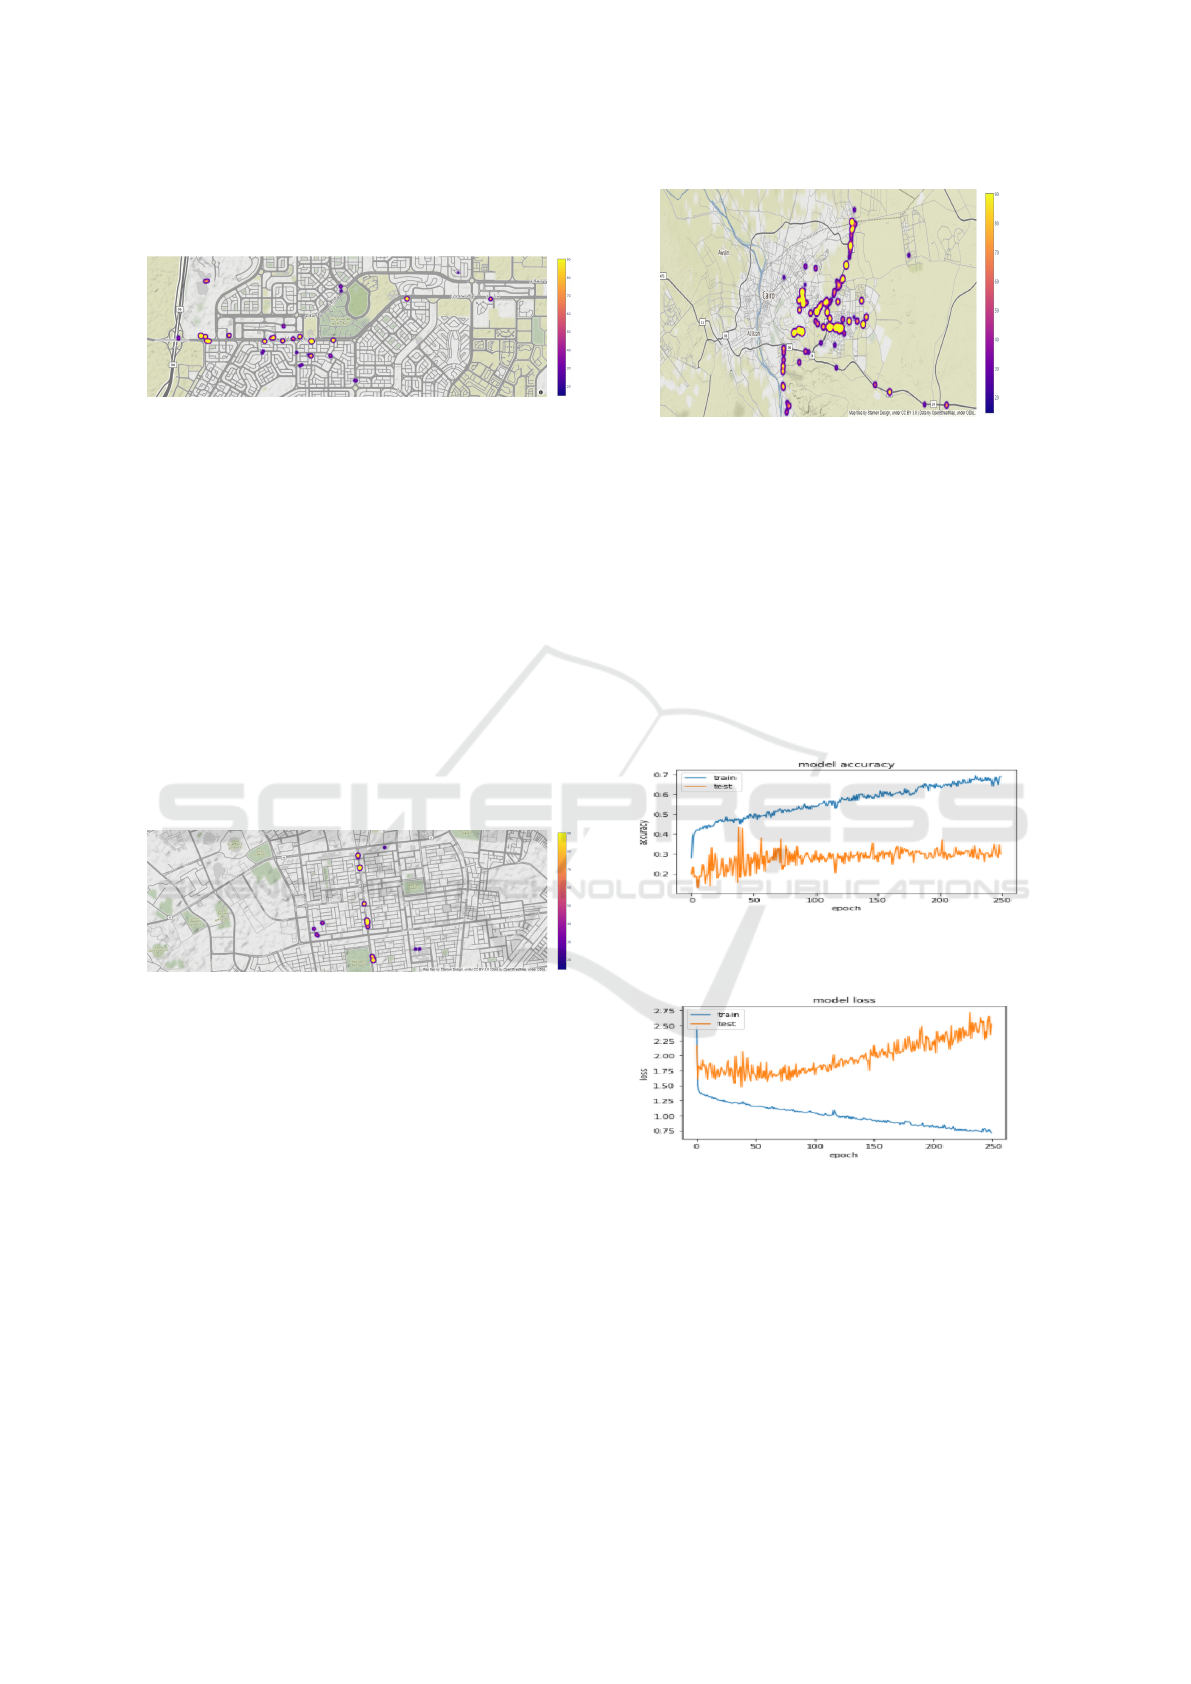
Figure 12: Heat map for 90
th
St.
As the 90
th
road is a very busy road almost all the
time of the day, so comparing the peak hours with the
off hours will be in this case not convenient enough
to show the difference between them, definitely, there
will be a difference between the average dBs taken
under a certain period (1 hour for example) in the
peak hours comparing with the average dBs taken un-
der the same period in the off-hours, however, it will
be a slight difference that will not show the huge ef-
fect of vehicles on raising the noise level, however, by
representing the heat map shown in Figure 12, we can
observe that as we got closer to the 90
th
street the plots
are getting more yellowish as the most yellowish ones
that indicate higher noise levels are located on the 90
th
street and as we go further the plots are heading to be
more blueish as the noise levels decrease.
Figure 13: Heat map for Abbas Al-Akkad St.
The heat map of Abbas Al-Akkad street as shown
in Figure 13 clarify more how main roads can raise the
noise level due to the traffic on them, we can observe
that all the yellow plots are located on the street it-
self showing the increase in noise level there, and the
same as 90
th
street, as we go further from the street
the noise level decreases as the plots trends to be more
blueish.
Figure 14 represents all the readings were taken
either by taking it in particular streets or by distribut-
ing the app to take readings from random locations in
Cairo, a total of 558 samples were taken inside Cairo,
divided into 106 samples on the 90
th
street, 71 sam-
ples on Abbas Al-Akkad street, 77 samples on 90
th
street, and 304 samples were taken in random loca-
tions at a different time inside Cairo.
Figure 14: Noise Pollution readings in Cairo.
Predictor Model. The predictor model is a created
model to predict whether pollution levels are more
than the required threshold or not. For such, a ba-
sic model with two fully connected hidden layers is
implemented. For both networks a train-test-split of
0.2 is used, with Adam optimizer and trained for 100
epochs. The results of the models is as follows. The
air pollution network takes as input a feature vector of
Time, Date, Temperature, and Humidity, and classi-
fies the pollution in three categories (good, moderate
or unhealthy). The model achieved 69% accuracy and
an crossentropy loss of 0.7058 on the test set.
Figure 15: Graph of model accuracy and the validation ac-
curacy against Epoch.
Figure 16: Graph of model loss and the validation loss
against Epoch.
The noise pollution network takes in a location
and time as input and predicts whether the db value
would exceed 80dB or not. The model achieved an
accuracy of 87% with a crossentropy loss of 0.2782.
ICORES 2022 - 11th International Conference on Operations Research and Enterprise Systems
228

Figure 17: Graph of model accuracy and the validation ac-
curacy against Epoch.
Figure 18: Graph of model loss and the validation loss
against Epoch.
5 CONCLUSION
In conclusion based on the above results, regarding
the air pollution measurement we could gather a total
samples of 3307 samples in 2 different locations in-
side New Cairo district. Air pollution monitoring was
done by measuring the concentration of PM
10
in the
air using GP2Y1010AU0F dust sensor and measuring
the AQI using MQ135 sensor. The results obtained by
the air pollution measurement shows how the AQI and
PM
10
behave within the peak and off hours, as shown
in the EURO final game example. Also, it shows how
the PM
10
concentration was relatively high in the sec-
ond location as it is located in front of an empty land
full of dust and smog. Regarding the noise pollution
measurement we have introduced a mobile applica-
tion that measures a real time noise level in dB, we
have concluded from the results that as we get closer
to main roads the noise level increases due to the ve-
hicles passing through the main roads as they are a
main source of noise pollution. The monitoring of ac-
cumulated data in the cloud storage helps to analyze
the various patterns in the environmental parameters
and accordingly implementing a predictor model us-
ing machine learning to be able to early notifying the
public about the changes in the pollution in different
areas.
Limitations: Setting up the air pollution measure-
ment device in main roads is not easy in Egypt, fac-
ing this limitation lead to setting the device up inside
balconies of buildings near the main road. For the
noise pollution measurement, the application doesn’t
get readings above 90.30dB which is a very high value
that we can barely reach.
Future Work: It is planned to locate the air pol-
lution measurement device in more locations inside
Cairo, with the addition of measuring PM
2.5
for more
efficiency. More data of noise levels is planned to
be taken as well, for more accuracy to the predictor
model.
REFERENCES
Empowering the World to Breathe Cleaner Air. Availabble
online : https://www.iqair.com. (accessed on 20 July
2021).
NAAQS Table. Availabble online https://www.epa.gov/
criteria-air-pollutants/naaqs-table. (accessed on 20
July 2021).
Aamer, H., Mumtaz, R., Anwar, H., and Poslad, S. (2018).
A very low cost, open, wireless, internet of things (iot)
air quality monitoring platform. pages 102–106.
Berglund, B., Lindvall, T., and Schwela, D. H. (2000). New
who guidelines for community noise. Noise &
Vibration Worldwide, 31(4):24–29.
Chiang, Y.-L., Wang, J.-C., Sun, C.-H., Wen, T.-H., Juang,
J.-Y., and Jiang, J.-A. (2020). Mobile measurement
of particulate matter concentrations on urban streets:
System development and field verification. IEEE Ac-
cess, 8:197617–197629.
Duangsuwan, S., Takarn, A., Nujankaew, R., and Jamja-
reegulgarn, P. (2018). A study of air pollution smart
sensors lpwan via nb-iot for thailand smart cities 4.0.
pages 206–209.
Ghattas, F. Z. (2009). Assessment and analysis of traffic
noise pollution in alexandria city, egypt. National Am-
bient Air Quality Series, 6:433–441.
Ghosh, A., Kumari, K., Kumar, S., Saha, M., Nandi, S., and
Saha, S. (2019). Noiseprobe: Assessing the dynamics
of urban noise pollution through participatory sensing.
pages 451–453.
Gryech, I., Ben-Aboud, Y., Guermah, B., Sbihi, N.,
Ghogho, M., and Kobbane, A. (2020). Moreair: A
low-cost urban air pollution monitoring system. Sen-
sors, 20(4).
Gunawan, T., Munir, Y., Kartiwi, M., and Mansor, H.
(2018). Design and implementation of portable out-
door air quality measurement system using arduino.
International Journal of Electrical and Computer En-
gineering, 8:280–290.
Marjanovi
´
c, M., Grube
ˇ
sa, S., and
ˇ
Zarko, I. P. (2017). Air
and noise pollution monitoring in the city of zagreb by
using mobile crowdsensing. pages 1–5.
Moutinho, J. L., Liang, D., Golan, R., Sarnat, S. E., Weber,
R., Sarnat, J. A., and Russell, A. G. (2020). Near-road
vehicle emissions air quality monitoring for exposure
modeling. Atmospheric Environment, 224:117318.
Real Life Pollution Measurement of Cairo
229

Spandana, G. and Shanmughasundram, R. (2018). Design
and development of air pollution monitoring system
for smart cities. pages 1640–1643.
Zaky, M. and Soubra, H. (2021). An intelligent transporta-
tion system for air and noise pollution management in
cities.
ICORES 2022 - 11th International Conference on Operations Research and Enterprise Systems
230
