From Explanations to Segmentation: Using Explainable AI for Image
Segmentation
Clemens Seibold
∗,1 a
, Johannes K
¨
unzel
∗,1 b
, Anna Hilsmann
1 c
and Peter Eisert
1,2 d
1
Fraunhofer Institute for Telecommunications, Heinrich Hertz Institute, HHI, Einsteinufer 37, 10587 Berlin, Germany
2
Visual Computing Group, Humboldt University Berlin, Unter den Linden 6, 10099 Berlin, Germany
Keywords:
Segmentation, Classification, LRP, Relevance, Annotation.
Abstract:
The new era of image segmentation leveraging the power of Deep Neural Nets (DNNs) comes with a price tag:
to train a neural network for pixel-wise segmentation, a large amount of training samples has to be manually
labeled on pixel-precision. In this work, we address this by following an indirect solution. We build upon
the advances of the Explainable AI (XAI) community and extract a pixel-wise binary segmentation from the
output of the Layer-wise Relevance Propagation (LRP) explaining the decision of a classification network. We
show that we achieve similar results compared to an established U-Net segmentation architecture, while the
generation of the training data is significantly simplified. The proposed method can be trained in a weakly
supervised fashion, as the training samples must be only labeled on image-level, at the same time enabling the
output of a segmentation mask. This makes it especially applicable to a wider range of real applications where
tedious pixel-level labelling is often not possible.
1 INTRODUCTION
Image segmentation describes the demanding task
of simultaneously performing object recognition and
boundary segmentation and is one of the oldest prob-
lems in computer vision (Szeliski, 2011, Ch. 5). It is
also often a crucial part of many visual understanding
systems.
Recent advances of deep learning models resulted
in a fundamental change in conjunction with remark-
able performance improvements. However, to train
these models, highly accurate labeled data in suffi-
cient large numbers is mandatory. The goal of our
method, depicted in Figure 1, is to circumvent this
cumbersome task, by going some extra miles during
inference. To do so, we got inspiration from the field
of Explainable AI (XAI) by Layer-wise Relevance
Propagation (LRP), presented first by (Bach et al.,
2015). LRP is usually used to highlight pixels con-
tributing to the decision of a classification network
and to get further insights into the decision making
a
https://orcid.org/0000-0002-9318-5934
b
https://orcid.org/0000-0002-3561-2758
c
https://orcid.org/0000-0002-2086-0951
d
https://orcid.org/0000-0001-8378-4805
∗
Clemens Seibold and Johannes K
¨
unzel have con-
tributed equally.
Classification
Network
Forward Pass
Classification
Output
Thresholding
Layer-wise Relevance Propagation
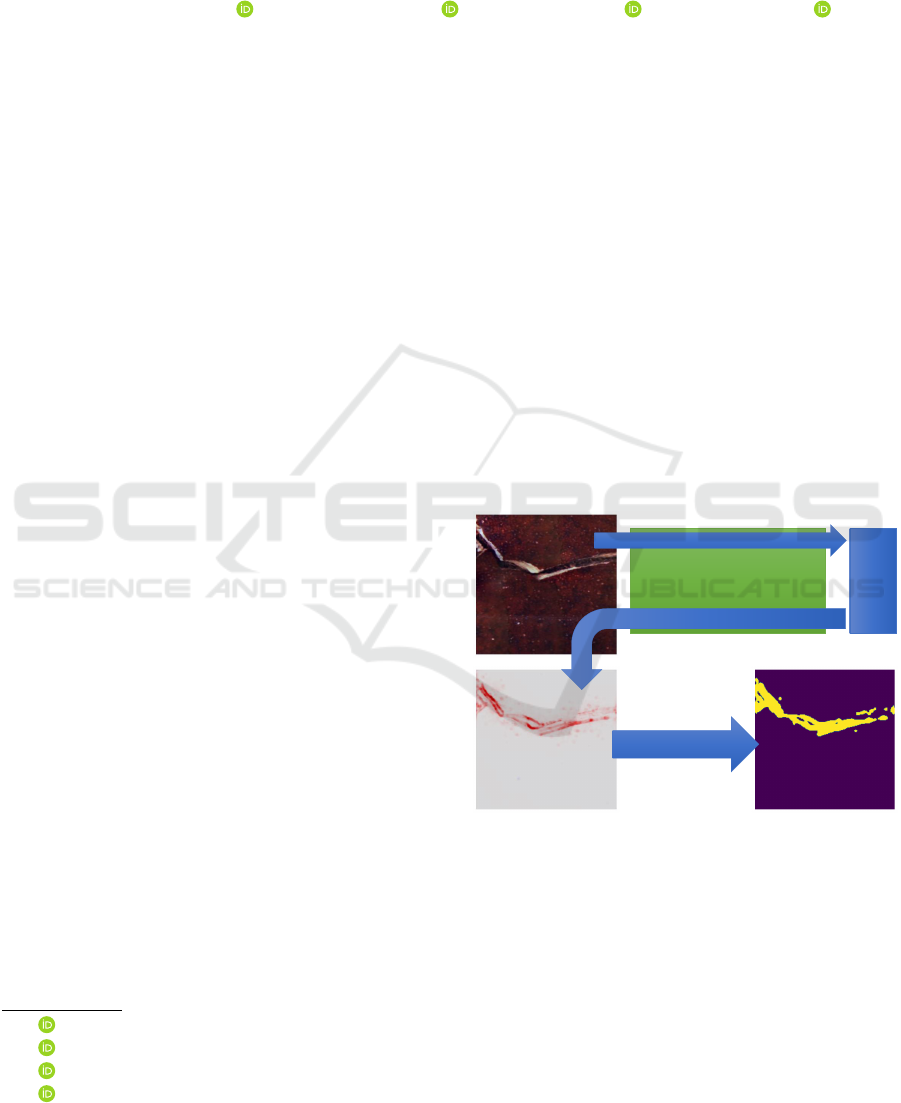
Figure 1: Overview of the proposed system. An image con-
taining a crack is passed into a classification network, which
learned to separate images with and without cracks. Pixel
contributing to the class “with crack” get highlighted using
Layer-wise Relevance Propagation (LRP). In consequence,
a pixel-wise segmentation is generated without the require-
ment of pixel-wise labeled training data.
process. In this initial work, we focus on binary se-
mantic segmentation. We train a VGG-A network
architecture to assign an input image to one of two
classes. Afterwards, we use LRP to highlight the pixel
contributing to the decision of the network and inves-
tigate three segmentation techniques to generate the
final segmentation mask. This idea enables a weakly
616
Seibold, C., Künzel, J., Hilsmann, A. and Eisert, P.
From Explanations to Segmentation: Using Explainable AI for Image Segmentation.
DOI: 10.5220/0010893600003124
In Proceedings of the 17th International Joint Conference on Computer Vision, Imaging and Computer Graphics Theory and Applications (VISIGRAPP 2022) - Volume 4: VISAPP, pages
616-626
ISBN: 978-989-758-555-5; ISSN: 2184-4321
Copyright
c
2022 by SCITEPRESS – Science and Technology Publications, Lda. All rights reserved

supervised training of a segmentation method, which
needs only image-wise labeled data to train a classifi-
cation network, but outputs a pixel-wise segmentation
mask. Further, we show that our approach yields com-
parable results to dedicated segmentation networks,
but without the cumbersome requirement of pixel-
wise labeled ground-truth data for training. We put
our approach to test on two different datasets - exam-
ple images can be found in Figure 2 and Figure 3.
In the remaining paper, we will summarize related
publications in section 2, followed by an explanation
of our system in section 3. In section 4 we evalu-
ate against a classical semantic segmentation network
and discuss several design options and their perfor-
mance impacts.
2 RELATED WORK
In the past decades, generations of researchers have
developed image segmentation algorithms and the lit-
erature divides them into three related problems. Se-
mantic segmentation describes the task of assigning
a class label to every pixel in the image. With in-
stance segmentation, every pixel gets assigned to a
class, along with an object identification. Thus, it sep-
arates different instances of the same class. Panoptic
segmentation performs both tasks concurrently, pro-
ducing a semantic segmentation for “stuff” (e.g. back-
ground, sky) and “things” (objects like house, cars,
persons).
There are classical approaches like active contours
(Kass et al., 1988), watershed methods (Vincent and
Soille, 1991) and graph-based segmentation (Felzen-
szwalb and Huttenlocher, 2004), to only name a few.
A good overview for these classical approaches can
be found in (Szeliski, 2011, Ch. 5). With the advance
of deep learning techniques in the area of image seg-
mentation, new regions in terms of robustness and ac-
curacy can be reached. One can find a comprehensive
recent review of deep learning techniques for image
segmentation in (Minaee et al., 2021). This review in-
cludes an overview over different architectures, train-
ing strategies and loss functions, so we refer the inter-
ested reader there, to get a current overview. All these
approaches share one drawback: they need pixel-wise
annotated images for training.
In the field of Explainable AI (XAI), several algo-
rithms for the explanation of network decisions have
been proposed. The authors of (Sundararajan et al.,
2017) proposed a method called Integrated Gradi-
ents, where gradients are calculated for linear inter-
polations between the baseline (for example, a black
image) and the actual input image. By averaging
over these gradients pixel with the strongest effect on
the model’s decision are highlighted. SmoothGrad
(Smilkov et al., 2017) generates a sensitivity map
by averaging over several instances of one input im-
age, each one augmented by added noise. This way,
smoother sensitivity maps can be generated. There
are many more methods and a comprehensive review
would be out of scope for this paper, but we refer the
interested reader to (Linardatos et al., 2021; Barredo
Arrieta et al., 2020; Samek et al., 2019). From this
bunch of methods, we selected LRP as it results in
comparatively sharp heatmaps and is therefore the
best starting point for the generation of segmentation
maps. Furthermore, the authors of (Seibold et al.,
2021) showed that with a simple extension LRP can
be utilized to localize traces of forgery in morphed
face images.
3 METHODS
3.1 Overview
Massive amounts of pixel-wise labeled segmentation
masks are usually the training foundation of deep neu-
ral networks for image segmentation tasks. Obtaining
them is usually a tedious manual process, introduc-
ing intrinsic problems by itself, because of the vari-
ance in the annotations and the often fuzzy definitions
of object boundaries. Therefore, we come up with
an indirect way. In our approach, we train a classi-
fication network instead of a segmentation network,
consequently reducing the annotation work by a great
margin and removing the requirement of an exact def-
inition of object boundaries. To segment an image,
we first pass it through the classification network, see
subsubsection 3.2.1, which outputs if the object we
want to segment is in the image or not. If the first
is true we pass the classification network a second
time, but this time from the back to the front, using
the LRP technique described in subsection 3.3 (Bach
et al., 2015), which is an XAI technique, highlight-
ing the pixel contributing to the DNN’s decision in a
heatmap. We use this heatmap in order to generate a
segmentation mask without the cumbersome task of
manual pixel-wise labeling.
3.2 Network Architectures
3.2.1 Classification
For binary classification, we resort to the classical
VGG-11 architecture without batch normalization, as
described in (Simonyan and Zisserman, 2015), but
From Explanations to Segmentation: Using Explainable AI for Image Segmentation
617
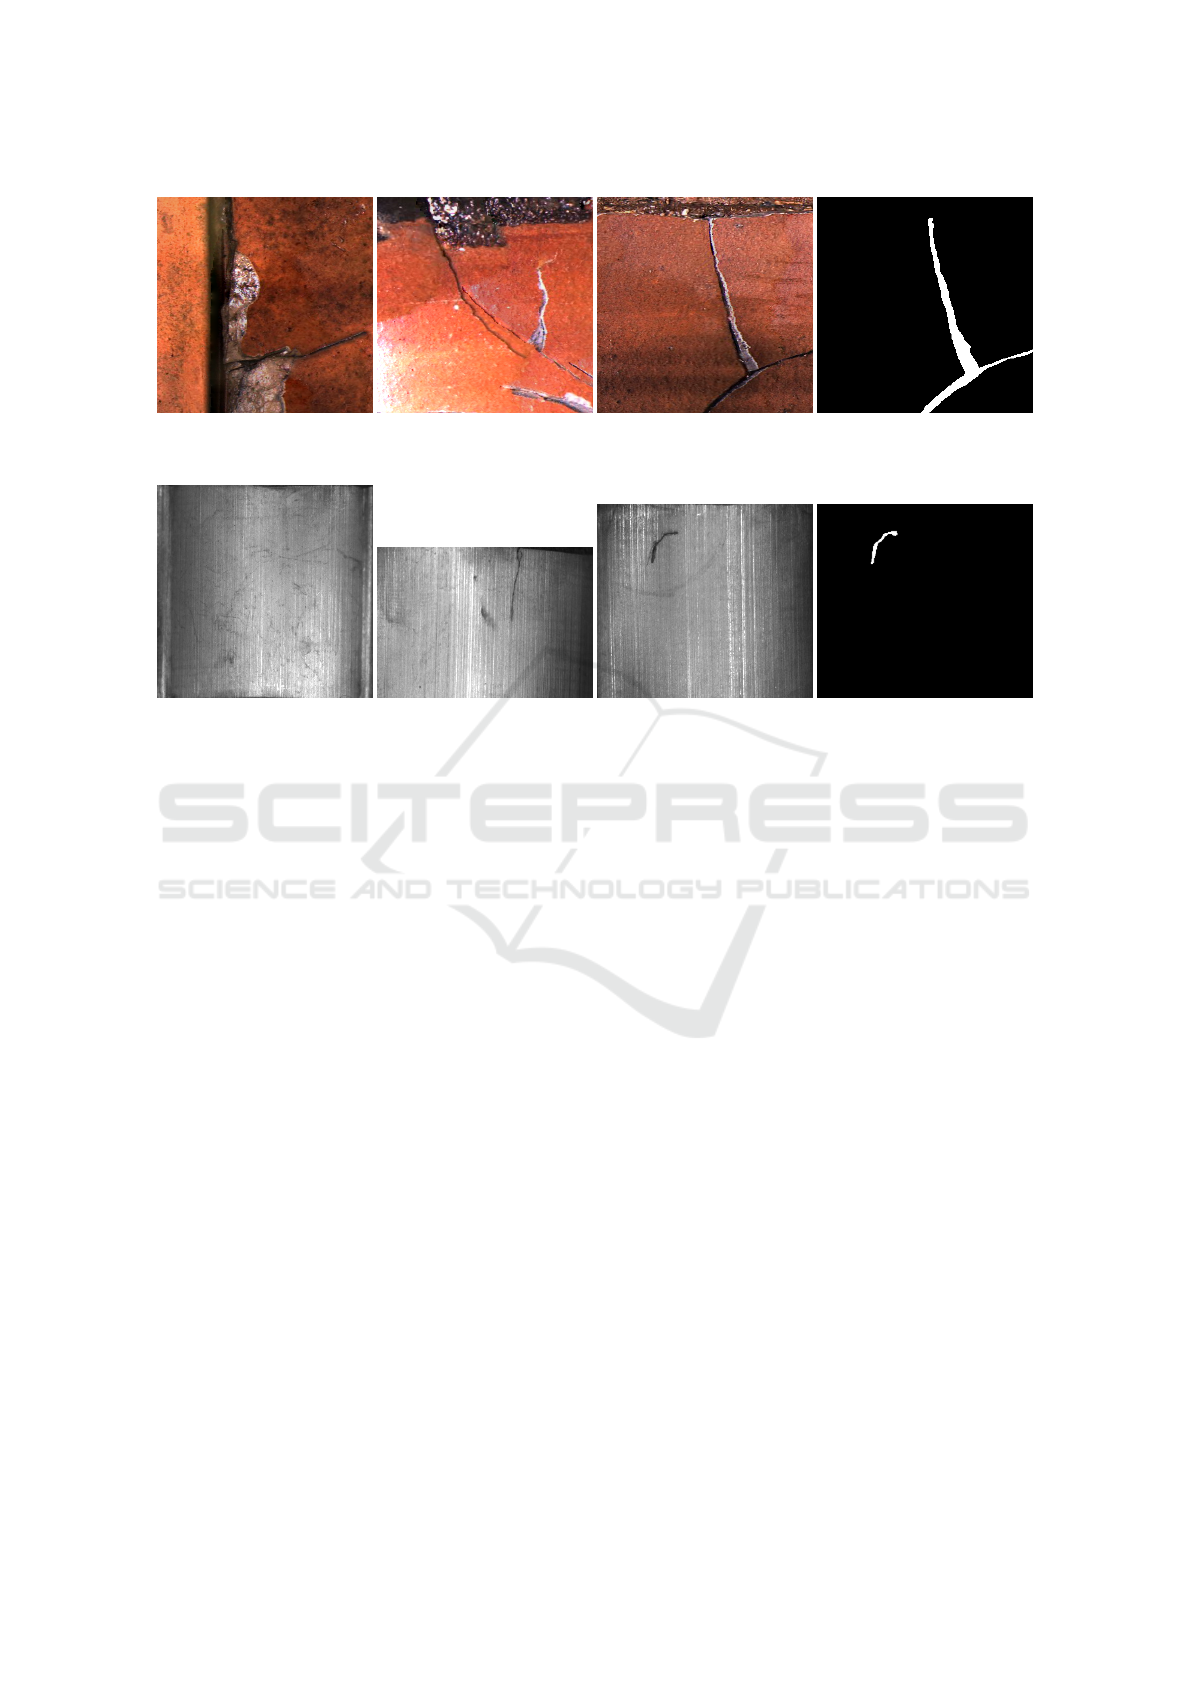
Figure 2: Examples of images depicting the various appearances of cracks in sewer pipes. The rightmost image shows the
segmentation mask of the neighboring image.
Figure 3: Examples of images depicting damaged and damage-free magnetic tile surfaces. The left image shows a damage-
free magnetic tile and the second image from the left a damaged magnetic tile. The two images on the right show a damaged
magnetic tile and its segmentation mask.
with only 128 neurons in each of the fully connected
layers. We use this architecture, as it is readily avail-
able, well understood and a good starting point for
the use of the LRP framework (Bach et al., 2015). For
further improvements of the segmentation results gen-
erated with LRP, we also adapt the VGG-11 architec-
ture, connecting the outputs of the last max-pooling
layer directly to the two output neurons. This facil-
itates the classification accuracy, as well as the indi-
rect segmentation (see section 4). For both configura-
tions, we start the training with pretrained weights for
the convolutional and randomly initialized weights
for the fully connected layers. We use a learning rate
of 0.001 and 0.0001 for the fully connected layers and
the refined convolutional layers, respectively.
3.2.2 Native Segmentation
For a comparison of our proposed method against an
established network architecture for image segmen-
tation, we have chosen the U-Net architecture as de-
scribed in (Ronneberger et al., 2015), as it was devel-
oped especially for very small datasets (the authors of
the original work used only 30 training samples). We
train the network, as described in the original work,
in a classical supervised way using data augmenta-
tion techniques like affine transformations and ran-
dom elastic deformations to cope with the small train-
ing datasets of 60 and 119 for the sewer pipes and the
magnetic tiles, respectively.
3.3 LRP
3.3.1 Principles
Layer-wise Relevance Propagation (LRP) (Bach
et al., 2015) is an interpretability method for DNNs.
It was designed to highlight on a pixel-level the struc-
tures in an image that are relevant for the DNN’s de-
cision. To this end, it assigns to each input neuron of
a DNN, e.g. each pixel of an image, a relevance score
that reflects its impact on the activation of a class of
interest. A positive relevance score denotes a con-
tribution to the activation, while a negative relevance
score denotes an inhibition.
In a first step, LRP assigns a relevance value to
a starting neuron that represents the class of interest.
Given this initialization, LRP propagates this starting
relevance backwards through the DNN into the input
image. To this end, it iterates from the last layer to
the input image through all layers. In each iteration
step, it assigns relevance scores to neurons in the cur-
rent layer based on their activations and weights to
neurons in the subsequent layer and the neurons’ rele-
vance scores in the subsequent layer. If a neuron con-
tributes to an activation of a neuron in the subsequent
VISAPP 2022 - 17th International Conference on Computer Vision Theory and Applications
618

layer, it receives a percentage of its relevance. If it in-
hibits the activation, it gets a negative relevance per-
centage. LRP can make use of different rules for the
propagation of relevance from neurons in one layer
to the neurons in its predecessor. The rules define
how LRP propagates the relevance in every single step
and consider various properties of the activations and
connections in different parts of the DNN. (Montavon
et al., 2019) shows that the most accurate and under-
standable relevance distributions can be achieved by
used different rules for different parts of a DNN.
Table 1: Overview of the two different LRP rule sets, which
are compared. Each row contains a specific LRP rule and
the layers in the VGG-A architecture where they are used.
Rule names LRP Ours LRP Montavon
z
B
conv1 1 conv1 1
α-β
conv2 1
conv3 1
γ
conv3 2
conv4 1
conv4 2
conv5 1
conv5 2
conv2 1
conv3 1
conv3 2
ε FC
conv4 1
conv4 2
conv5 1
conv5 2
0 FC
In our experiments, we use two different sets of
LRP rules. An overview is given in Table 1. The pa-
rameters for the rules are ε = 0.25std and γ = 0.25. In
both cases, we use the LRP-z
B
rule for the first layer,
which maps the relevance into the image. The LRP-
z
B
rule considers that it has to propagate the relevance
to pixels that contain real values and not ReLU acti-
vations like the neurons in the DNN. The first combi-
nation of rules and parameters has been shown to be
suitable for VGG-like architectures (Montavon et al.,
2019). While the LRP-0 rule is close to the activa-
tion function of the network, the LRP-ε rule focuses
on more salient features and the LRP-γ rule is most
suitable to spread the relevance to the whole feature.
Empirically, we found a suitable second combination
of rules, which we included in our experiments. It
uses the LRP-ε rule for the fully connected layers to
focus already here on more salient features. The use
of the LRP-γ rule for the middle layers enforces an
early spread of the relevance to the whole feature.
The LRP-α-β rule with α = 2 in the lower layers con-
siders inhibiting and contributing features differently
and puts a strong focus on contributing activations.
This rule leads to more balanced relevance maps with
strong focus on inhibiting regions. For further de-
tails on LRP and the characteristics of its different
relevance propagation rules, we refer to (Kohlbrenner
et al., 2020).
3.3.2 Segmentation from LRP
LRP assigns to each pixel a relevance score with val-
ues within an arbitrary interval. In order to transfer
these relevance distributions to a segmentation map,
we developed three different approaches. The first
one Simple is based on the simple automatic thresh-
olding algorithm described in (Umbaugh, 2017). The
other two approaches, GMM and BMM, are based on
Mixture Models and optimized using an Expectation-
Maximization algorithm.
Simple. To calculate the segmentation of fore-
ground and background, the LRP activations are nor-
malized first and the mean defines the initial threshold
over all the activations. Based on the initial threshold,
the image can be separated into foreground and back-
ground and the mean over all values in both classes is
calculated. The new threshold then arises from the av-
erage of both mean values. This iterative refinement
stops if the threshold value converges.
GMM. This segmentation method is based on a
Gaussian Mixture Model (GMM) to distinguish be-
tween relevant regions (damages) and background.
In a first step, we apply a 2D mean filter with a di-
mension of five by five on the relevance map. This
smooths out extreme relevance peaks for single pix-
els and makes the relevance distribution in the inner
part of a damage smoother. Our GMM has three com-
ponents and is fit to the relevance distribution con-
sidering only the 1-D relevance scores and no spatial
information. We used python’s scikit-learn package
(Pedregosa et al., 2011) to fit the GMM to the data.
We initialize the GMM using the k-Means algorithm
to find first belongings of the samples to the distribu-
tions and thus to initialize the parameters. In order to
identify the component of the GMM that describes the
relevance values covering the damages, we selected
the component with the largest likelihood for the max-
imal relevance value. The final segmentation map is
calculated by selecting all pixels that belong to this
component with a likelihood of more than 50%.
BMM. Our Beta Mixture Model for segmentation
consists of two Beta-distributions. See (1) for the def-
From Explanations to Segmentation: Using Explainable AI for Image Segmentation
619

inition of the probability density function of the Beta-
distribution.
f (x;α, β) =
1
B(α, β)
x
α−1
(1 − x)
β−1
, (1)
with B(·) being the normalization factor as defined in
(2)
B(α, β) =
Γ(α)Γ(β)
Γ(α + β)
(2)
and Γ(·) is the Gamma function. The idea of this
model is to use two skewed distributions to describe
the relevance scores. One distribution characterizes
the large amount of background pixels with low posi-
tive relevance values and the other one the areas con-
taining damages with large relevance values. The dis-
tributions are fit using an EM-algorithm with outlier
removal and weights for the relevance distributions.
The details are described in the following.
First, the relevance maps are filtered as in our
GMM segmentation approach. In a next step, we
set all negative relevance values to zero and remove
50% of the smallest relevance values, since the dam-
ages cover in all cases significantly less pixels than
50% of the image. Subsequently, the relevance scores
are normalized to the interval [0,1], since the Beta-
distribution is defined only on this interval. To this
end, we map the smallest value to zero and the largest
to one using an affine transformation. The BMM is fit
to these processed data using an EM-algorithm with
the following modifications in the expectation step.
Pixels with a larger relevance value than the prob-
ability density function’s mean of the component that
represents the damages are assigned with a proba-
bility of 100% to this component. Pixels that are
within the 90% of the lower sided confidence inter-
val of the component that represents the background
are assigned with a probability of 100% to this com-
ponent. Finally, we weight the probabilities of each
component by the sum of the component’s probabil-
ities. These modifications in the maximization step
avoid that the large number of small relevance val-
ues from the background pixels affects the component
that describes the relevance values of the damaged ar-
eas and compensates the big differences in the number
of relevant (damage) and non-relevant (background)
pixels.
3.4 Datasets
To showcase the applicability of our proposed
method, we work with two different datasets in our
experiments, which we describe in detail below.
Cracks in Sewer Pipes. Sewer pipe assessment is
usually done with the help of mobile robots equipped
with cameras. In our case, the robot was equipped
with a fisheye lens, resulting in severe image distor-
tions. Therefore, we performed a preprocessing of the
original footage, as described in (K
¨
unzel et al., 2018),
consisting of camera tracking, image reprojection and
enhancement. For the classification of damaged and
undamaged pipe surfaces, we manually cropped 628
and 754 images respectively, with a size of 224 by
224 pixels. The damages show a huge variety in size,
color and shape, as can be seen in Figure 2. Dur-
ing the training of the classification network, we per-
formed no further data augmentation. For the training
of a classical segmentation network, we cropped an-
other set of images containing pipe cracks and man-
ually created the segmentation masks. We divided
the dataset into a testing and validation dataset, each
with 20% of all images, and a training set with the
remaining 60% of all images. During the training of
the segmentation network, we used elastic deforma-
tions and affine transformations for data augmenta-
tion (Ronneberger et al., 2015). The testing and vali-
dation data are augmented by adding the horizontally
and vertically flipped version of each image to the cor-
responding set.
Cracks in Magnetic Tiles. As a second dataset, we
use the magnetic tile defect datasets provided by the
authors of (Huang et al., 2018). This set contains 894
images of magnetic tiles without any damage and 190
images of magnetic tiles with either a crack or a blow-
hole. These damages are very small and cover only a
few percent of an image. The images in this dataset
are of different sizes with widths between 103 and
618 pixels and heights between 222 and 403 pixels.
We manually cropped all images with damaged mag-
netic tiles, such that each random crop of a 224 by
224 pixels large region contains the damage. During
training, the images are randomly cropped to a size of
224 by 224 pixels, while during testing and validation
we cropped the center of the images. Images with a
height or width smaller than 224 have been rescaled
to reach the minimal size of 224 pixels. We divided
the dataset into a testing and validation dataset, each
with 20% of all images, and a training set with the re-
maining 60% of all images. We ensured that this dis-
tribution holds also for all damage types and damage
free images. When splitting the images into these sets,
we considered that the authors of the dataset captured
each damage and damage-free region up to six differ-
ent times and split the images such that each damage
or damage-free region area is in one set only. We aug-
mented the data during training using random crop-
VISAPP 2022 - 17th International Conference on Computer Vision Theory and Applications
620
ping and random horizontal and vertical flipping. The
testing and validation data are augmented by adding
the horizontally and vertically flipped version of each
image to the corresponding set. Example images can
be found in Figure 3.
4 EXPERIMENTS
We tested the proposed LRP-based segmentation
methods on the Sewer Pipe Cracks and the Magnetic
Tile Cracks dataset and compared their performance
with the segmentation results from a U-Net. We eval-
uated all combinations of our three proposed thresh-
old estimation methods, LRP rules and VGG-based
networks to study their suitability for image segmen-
tation. The used evaluation metrics are Intersection
over Union (IoU) and the two for binary classification
tasks common metrics, precision and recall. Since
this is a binary problem, we calculated all metrics
only for the pixels segmented as damage. Further-
more, we analyzed the Precision-Recall (PR) Curves
of the different segmentation approaches. Whereas
the U-Net, the BMM approach and the GMM ap-
proach output a value for the likelihood that a pixel
shows a damaged area, the simple approach outputs
only a binary decision and no PR curve can be cal-
culated for this approach. In exchange for the simple
approach, we calculated the PR curve on the LRP-
output after mapping it into the interval [0,1] using an
affine transformation.
The PR curves contain striking horizontal lines,
which origin is explained in the following. The GMM
approach assigns to a large number of pixels a likeli-
hood of one for being a damage. Two components of
the GMM have a mean around zero and very small
variances. The third component, which describes
the damage, has a significantly larger variance and
mean. Due to the narrow peak of the first two com-
ponents that describe non-damage pixels, their prob-
ability density functions are already zero for moder-
ate relevance scores, when using 64 bit floating point
numbers as defined in IEEE 754-2008. Especially,
for the Magnetic Tile dataset, the contrast of the large
amount of background pixels with relevance scores
close to zero and the small amount of pixels showing
damaged areas with large relevance scores causes this
behavior. It can also be observed for the Sewer Pipes
dataset, but to a smaller extent. Increasing the thresh-
old can thus not improve the precision or change the
recall. We depicted this point of saturation with a hor-
izontal line.
4.1 Magnetic Tiles
Both VGG-A-based networks achieve in all cases a
good performance in detecting damages and yield a
balanced accuracy of more than 95%, see Table 2.
Table 2: Magnetic Tile Damage Detection Metrics.
Balanced
Accuracy
TPR TNR
VGG-A 128 96.1% 95.7% 96.5%
VGG-A one FC 98.5% 97.1% 99.9%
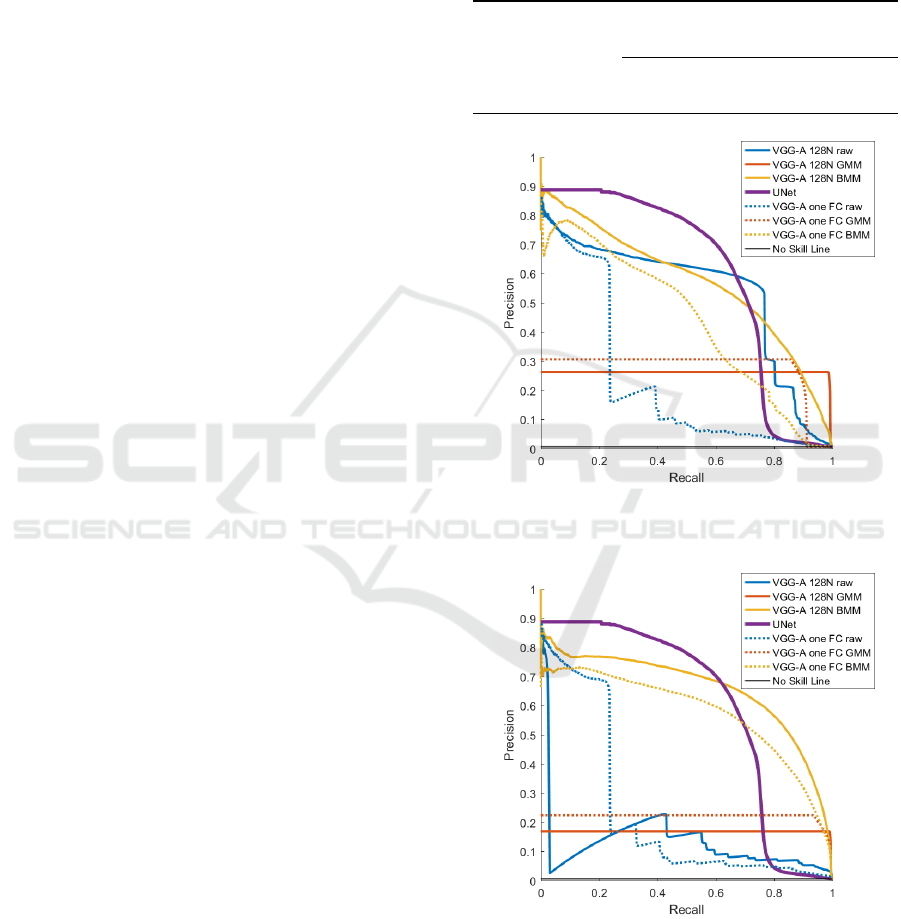
Figure 4: Precision Recall Curves for Damage Segmenta-
tion in Magnetic Tile Images with the LRP ruleset from
Montavon.
Figure 5: Precision Recall Curves for Damage Segmenta-
tion in Magnetic Tile Images with our LRP ruleset.
Table 3 shows that some of our LRP-based seg-
mentation approaches perform as well as the U-Net
segmentation, which requires a pixel-wise segmenta-
tion for training. The performance of our proposed
From Explanations to Segmentation: Using Explainable AI for Image Segmentation
621
approaches differs strongly in terms of IoU, precision
and recall. The GMM approach has the worst IoU
and precision but by far the best recall. The recall
of the simple approach is in general better than for
the BMM approach, but the BMM provides a better
precision. There is no model that outperforms all oth-
ers in all metrics. Which approach to choose depends
on whether the detector should focus on sensitivity or
specificity.
The precision-recall curves in Figure 4 and Fig-
ure 5 show that the different results for the metrics in
Table 3 for U-Net, BMM and GMM are not only a
matter of threshold, but the approaches perform dif-
ferently depending on the selected theshold. All our
approaches can achieve better results than a no-skill
segmentation system with a precision of 0.006. The
BMM approach performs in nearly all, except for a
very high recall rates, better than the GMM approach.
It outperforms the U-Net based segmentation in the
recall interval of roughly 0.7 to 1 in the best setting
with the VGG-A 128N DNN and our proposed LRP-
ruleset. In the remaining range of 0 to 0.7 its preci-
sion is on average only 0.1 worse than the U-Net seg-
mentation. In all cases, the GMM model reaches very
fast a point of saturation with final precision scores
between about 0.15 and 0.3, depending on the used
LRP-ruleset and DNN model. An explanation for this
saturation can be found in the beginning of section 4.
Whether our proposed LRP-ruleset or the ruleset
proposed in (Montavon et al., 2019) is more suitable
for a LRP-based segmentation depends on the ap-
proach used for the final segmentation step. While a
raw relevance intensity based and GMM-based seg-
mentation approach yields in general better results
with the ruleset proposed in (Montavon et al., 2019),
the best results are achieved using our proposed rule-
set and the BMM approach using the VGG-A 128N
model.
Figure 9 depicts examples for the damage segmen-
tation of magnetic tile images using U-Net as well as
our proposed approach. The LRP-results in the first
two rows show a typical weakness of LRP-based seg-
mentations. The relevance scores at the borders of
small damages are very large, but inside the defect,
they are small and close to zero. Thus, a non-sensitive
approach does not segment the inner part of a dam-
aged area as such. The LRP-based segmentation in
the first row does not contain the complete contour of
the damage, which is caused by smaller relevance val-
ues at one part of the damage’s border. This problem
can be solved by adjusting the threshold for the seg-
mentation to make the approach more sensitive. The
example in the bottom row shows that our LRP-based
approach is also suitable to segment more complex
structures than the ellipsoids showed in the other three
examples. In general, the LRP-based and U-Net Seg-
mentation results can describe the position as well as
the shape of the damage with a visually comprehensi-
ble precision.
4.2 Sewer Pipes
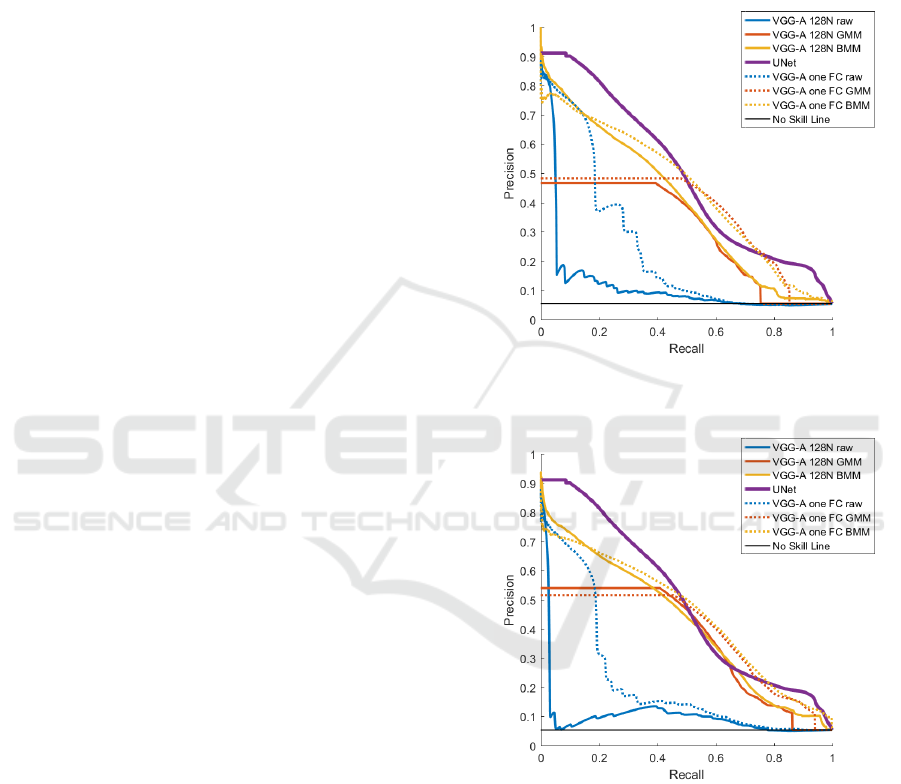
Figure 6: Precision Recall Curves for Damage Segmenta-
tion in Sewer Pipe Images with the LRP rule set from Mon-
tavon.
Figure 7: Precision Recall Curves for Damage Segmenta-
tion in Sewer Pipe Images with our LRP rule set.
The VGG-A-based classification networks yield more
than 95% balanced accuracy for both network con-
figurations. By directly connecting the convolutional
layers to only two output neurons, a slight perfor-
mance increase could be achieved, as can be seen in
Table 4.
Table 5 contains the segmentation metrics for the
Sewer Pipe Cracks dataset. From our approaches, the
BMM-based segmentation has the highest IoU values
and also outperforms U-Net, when used in conjunc-
VISAPP 2022 - 17th International Conference on Computer Vision Theory and Applications
622
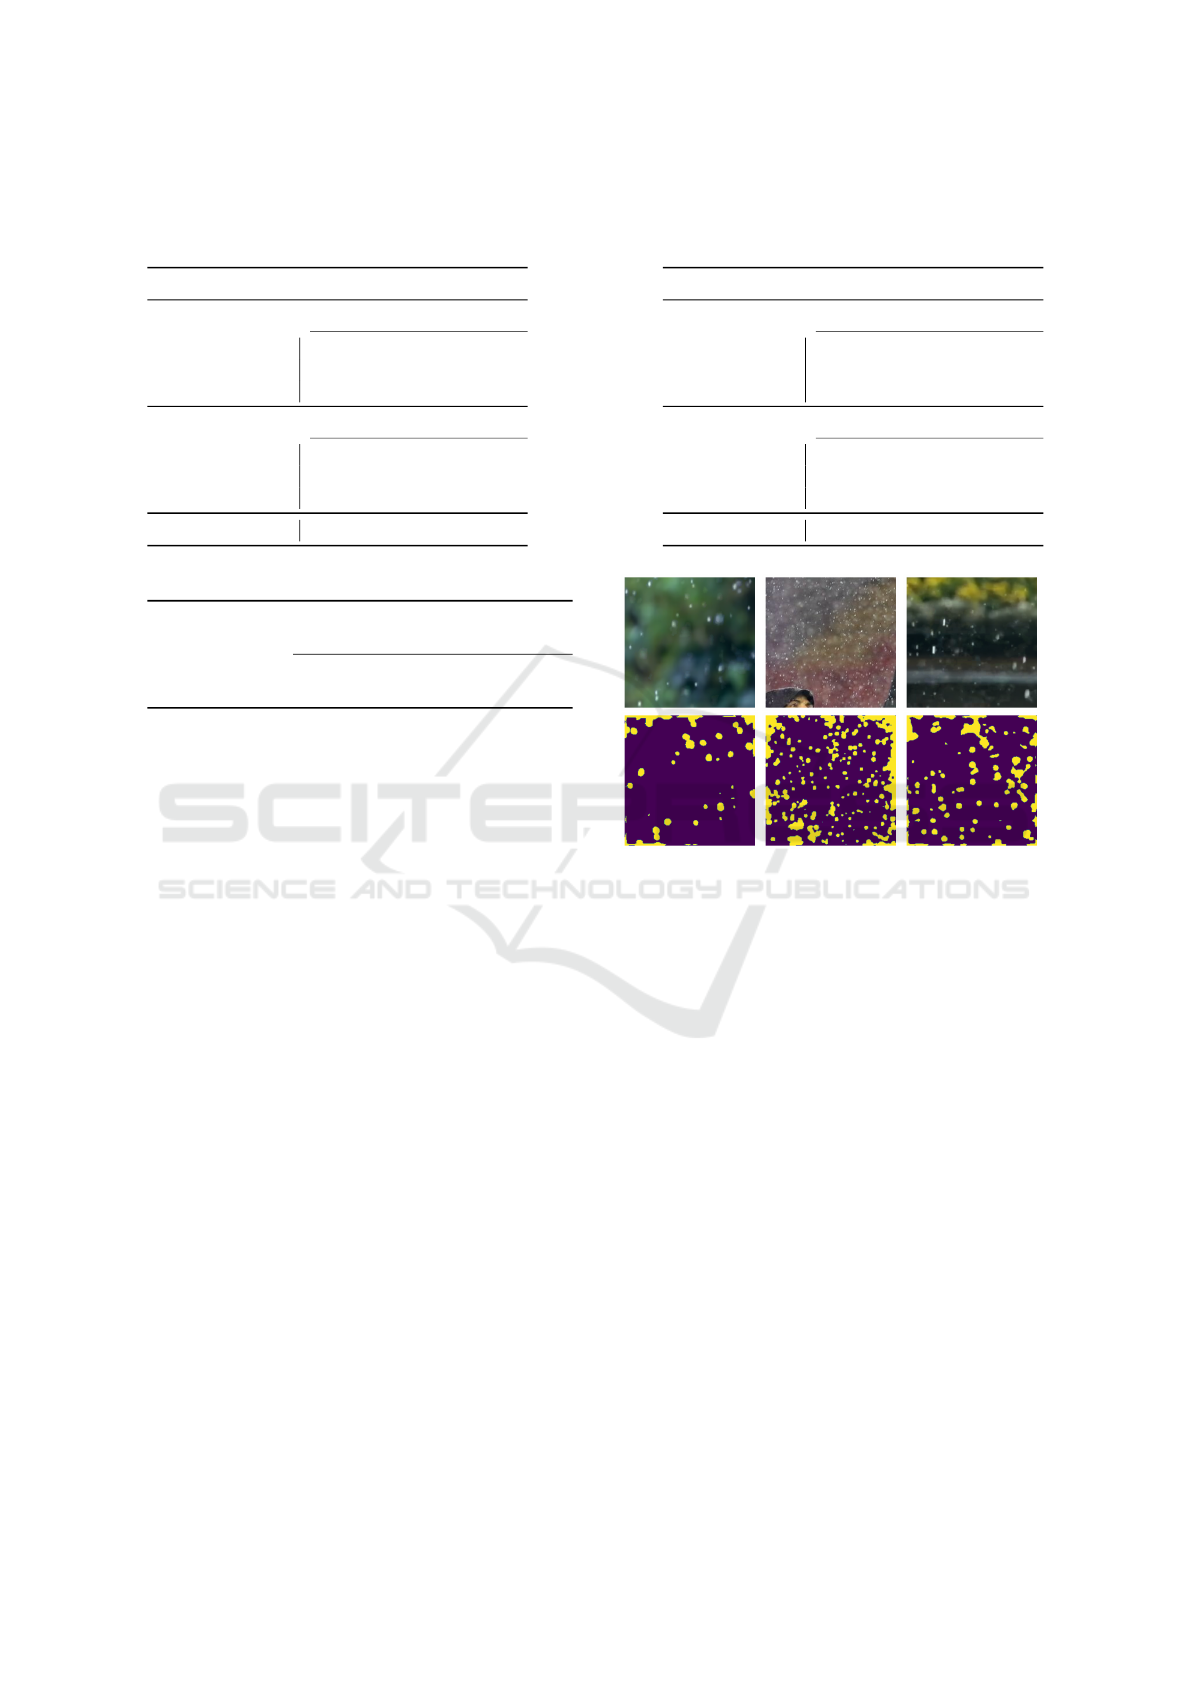
Table 3: Overview of the metrics for the magnetic tile damage segmentation. On the left is our proposed LRP rule set and on
the right is the one proposed by (Montavon et al., 2019). On each side, the default VGG-A architecture and the architecture
with only one fully connected layer are compared. For easier comparison, the U-Net results are listed on both sides.
LRP Ours LRP Montavon
VGG-A 128N IoU Precision Recall VGG-A 128N IoU Precision Recall
Simple 0.349 0.352 0.976 Simple 0.466 0.497 0.897
GMM 0.129 0.129 0.993 GMM 0.216 0.216 0.996
BMM 0.462 0.638 0.679 BMM 0.332 0.703 0.448
VGG-A one FC IoU Precision Recall VGG-A one FC IoU Precision Recall
Simple 0.386 0.404 0.944 Simple 0.425 0.491 0.808
GMM 0.168 0.169 0.991 GMM 0.238 0.246 0.947
BMM 0.402 0.669 0.614 BMM 0.317 0.686 0.470
U-Net 0.461 0.578 0.699 U-Net 0.461 0.578 0.699
Table 4: Sewer Pipe Cracks Detection Metrics.
Balanced
Accuracy
TPR TNR
VGG-A 128 95.3% 92.8% 97.5%
VGG-A one FC 97.4% 98.5% 96.2%
tion with VGG-A one FC. This configuration also has
the highest precision, but lower recall values. The us-
age of the GMM-based approach shows similar re-
sults compared to simple thresholding algorithm.
The precision-recall curves for our LRP configu-
ration and the one from (Montavon et al., 2019) are
plotted in Figure 7 and Figure 6. As can be seen from
the figures, the utilization of the raw LRP output is
not practicable, since the segmentation is barely bet-
ter than a no-skill segmentation system with a preci-
sion of 0.05379, which is just the proportion of pixel
labeled as cracks (represented by the black horizontal
line).
The utilization of the proposed GMM and BMM
based segmentations improves the results by a great
margin. However, the GMM based approaches ex-
hibit a straight horizontal line, for which an explana-
tion can be found in the beginning of section 4. In
the interval between a recall of roughly 0.5 and 0.7
our approach outperforms U-Net, but falls behind for
lower recall values. For recall values greater than
0.7, VGG-A one FC and U-Net show a similar per-
formance when utilizing our LRP ruleset. The us-
age of LRP Montavon results in a wider margin and
also causes a worse performance for the VGG-A 128N
configurations, which therefore never exceed the per-
formance of U-Net.
For a visual comparison between U-Net and our
configuration with VGG-A one FC and BMM, we re-
fer to Figure 10. As can be seen in Figure 10c, U-Net
generates many true positive crack segmentations, but
Figure 8: Some early results of rain streak segmentation on
natural images.
gets distracted with strong brightness differences, for
instance in the uppermost and lowest image. Deposits
depicted in the image are sometimes also mistakenly
segmented as cracks, as can be seen in the second im-
age from the bottom. The LRP configuration is more
robust against these issues, but the segmentations tend
to be wider than the actual cracks, especially for nar-
row ones.
5 CONCLUSION
We presented a method to circumvent the require-
ment of a pixel-wise labeling in order to train a neural
network to accomplish this demanding task. In or-
der to demonstrate the applicability of our approach,
we compare different configurations against the estab-
lished U-Net architecture and achieve comparable re-
sults using two different datasets. Thereby, we show
that the output of the Layer-wise Relevance Propa-
gation (LRP) can be exploited to generate pixel-wise
segmentation masks.
From Explanations to Segmentation: Using Explainable AI for Image Segmentation
623
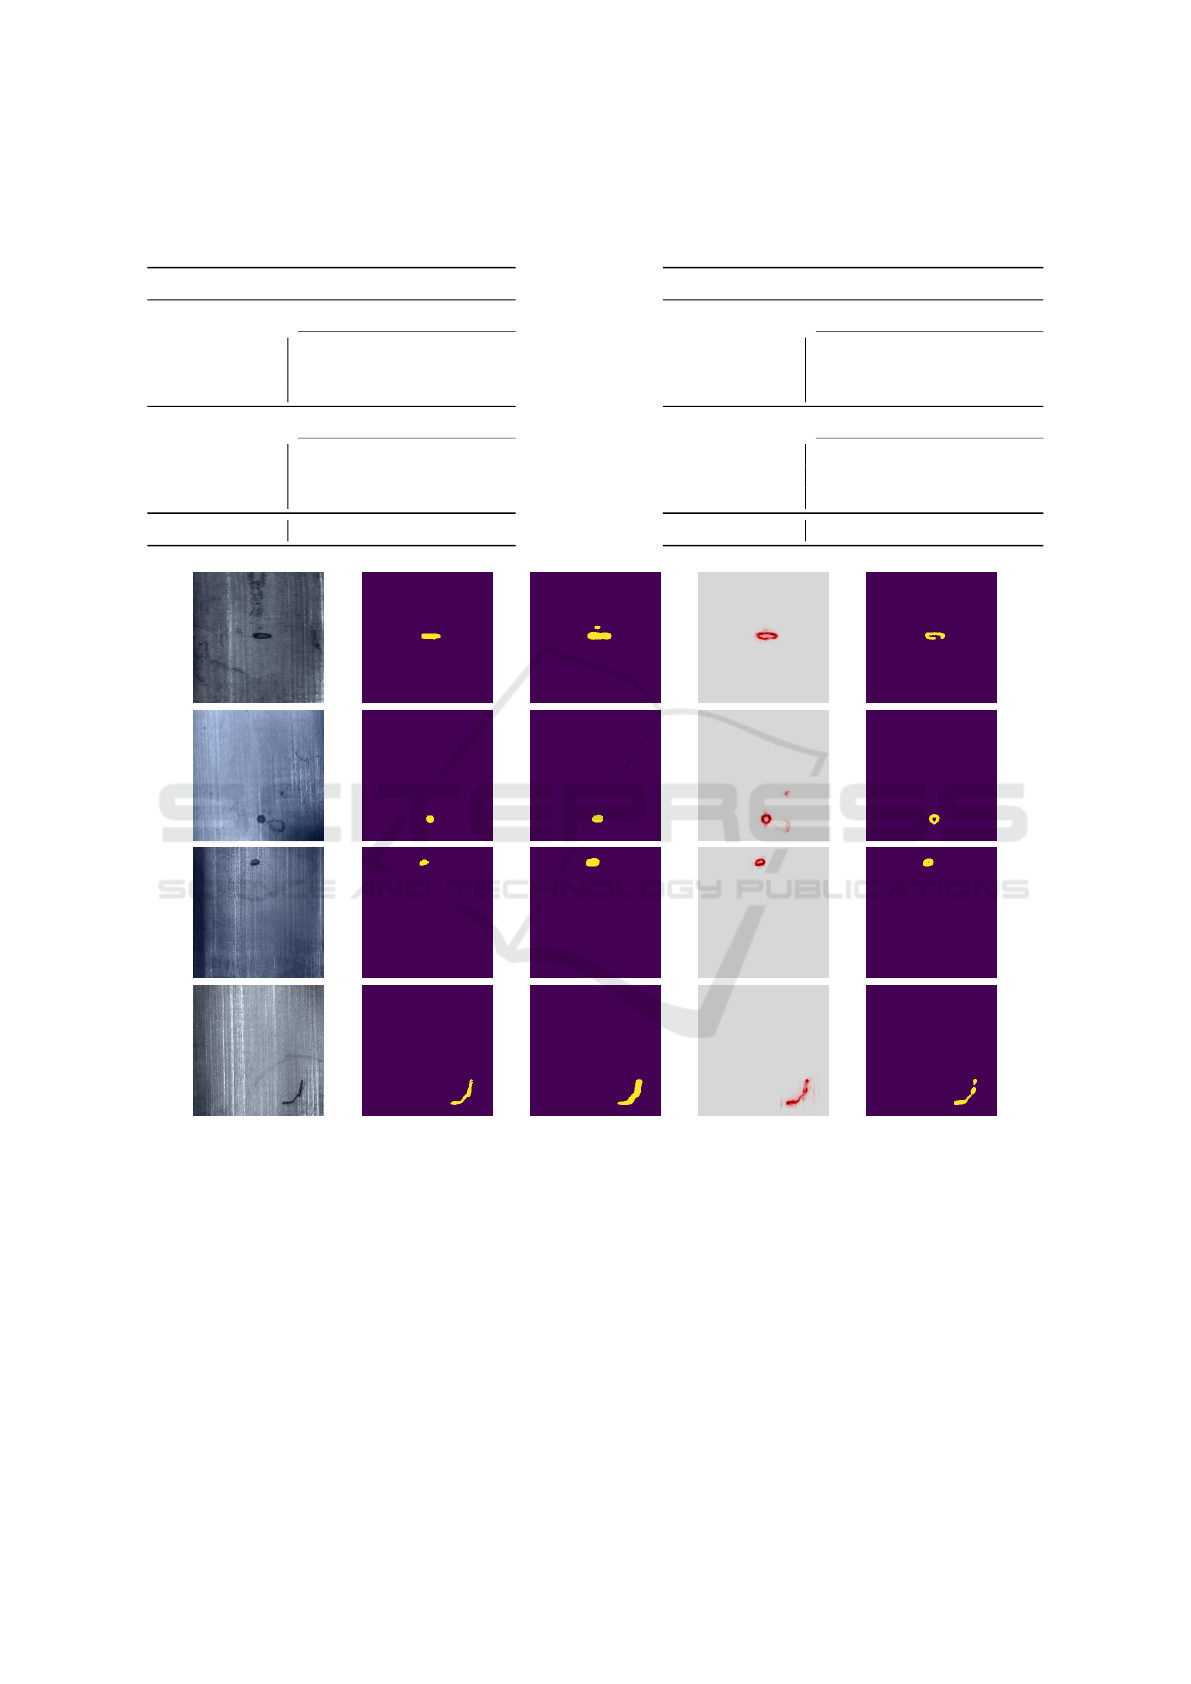
Table 5: Overview of the metrics for the sewer pipe cracks segmentation with our proposed LRP rule set (left) and the one
proposed by (Montavon et al., 2019) (right). On each side, the default VGG-A architecture and the architecture with only one
fully connected layer are compared. For easier comparison, the U-Net results are listed on both sides.
LRP Ours LRP Montavon
VGG-A 128N IoU Precision Recall VGG-A 128N IoU Precision Recall
Simple 0.282 0.381 0.671 Simple 0.292 0.418 0.614
GMM 0.272 0.331 0.718 GMM 0.249 0.316 0.689
BMM 0.314 0.469 0.578 BMM 0.303 0.525 0.483
VGG-A one FC IoU Precision Recall VGG-A one FC IoU Precision Recall
Simple 0.297 0.381 0.727 Simple 0.340 0.464 0.669
GMM 0.270 0.169 0.782 GMM 0.281 0.332 0.785
BMM 0.337 0.318 0.647 BMM 0.321 0.686 0.488
U-Net 0.321 0.450 0.797 U-Net 0.321 0.565 0.797
(a) Input images. (b) Groundtruth. (c) U-Net Seg.. (d) LRP heatmap. (e) LRP Seg..
Figure 9: Example results for segmentations of damages in magnetic tiles generated with U-Net and our proposed LRP-ruleset
and the VGG-A 128N architecture.
An interesting further research direction could be
the extension to multi-label segmentation. Currently,
we also try to apply the proposed solution to the chal-
lenging problem of rain streak segmentation in natu-
ral images, as it is a very demanding task to generate
a sufficient amount of training data and therefore is an
ideal application area for our proposed method. Some
early results of our work can be seen in Figure 8.
ACKNOWLEDGEMENTS
This work has partly been funded by the German Fed-
eral Ministry of Economic Affairs and Energy under
grant number 01MT20001D (Gemimeg), the Berlin
state ProFIT program under grant number 10174498
(BerDiBa), and the German Federal Ministry of Ed-
ucation and Research under grant number 13N13891
(AuZuKa).
VISAPP 2022 - 17th International Conference on Computer Vision Theory and Applications
624
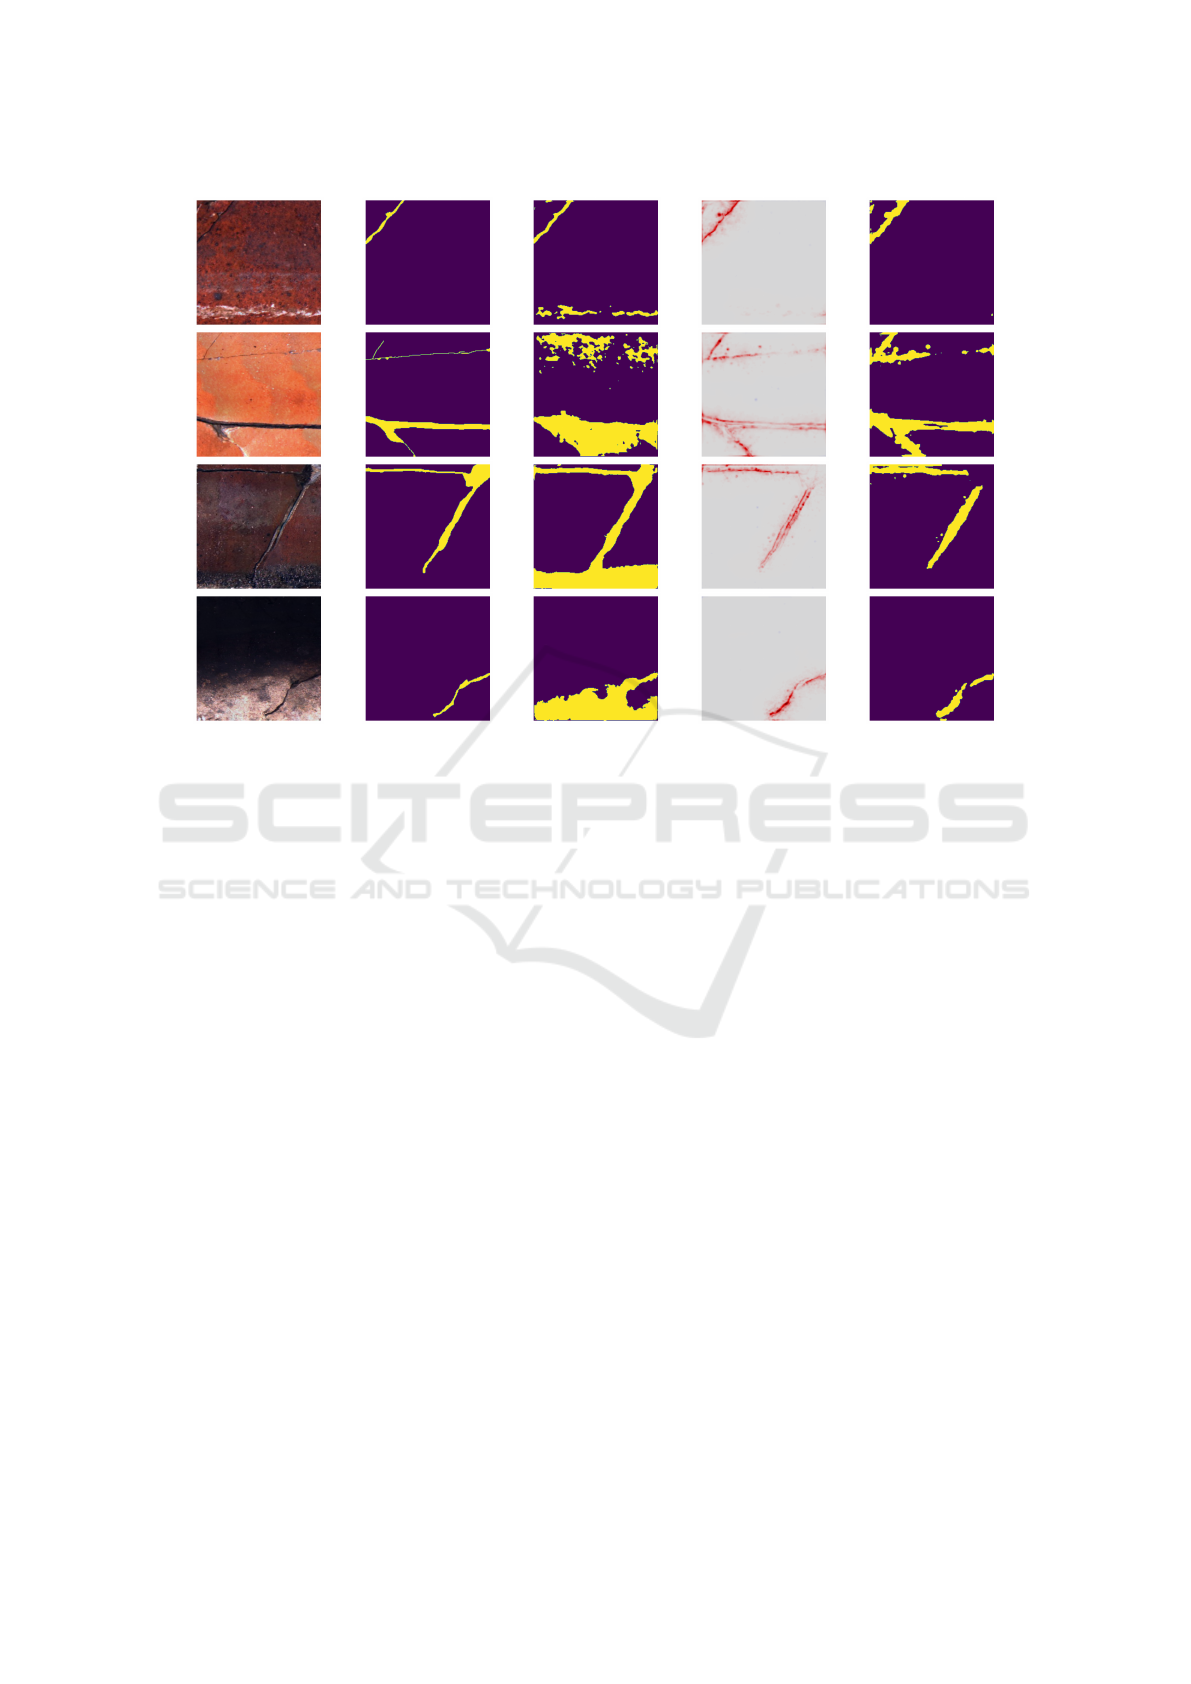
(a) Input images. (b) Groundtruth. (c) U-Net Seg.. (d) LRP heatmap. (e) LRP Seg..
Figure 10: Example results for segmentations of cracks in sewer pipes generated with U-Net and our best performing config-
uration using LRP.
REFERENCES
Bach, S., Binder, A., Montavon, G., Klauschen, F., M
¨
uller,
K.-R., and Samek, W. (2015). On Pixel-Wise Ex-
planations for Non-Linear Classifier Decisions by
Layer-Wise Relevance Propagation. PLoS ONE,
10(7):e0130140.
Barredo Arrieta, A., D
´
ıaz-Rodr
´
ıguez, N., Del Ser, J., Ben-
netot, A., Tabik, S., Barbado, A., Garcia, S., Gil-
Lopez, S., Molina, D., Benjamins, R., Chatila, R.,
and Herrera, F. (2020). Explainable artificial intelli-
gence (xai): Concepts, taxonomies, opportunities and
challenges toward responsible ai. Information Fusion,
58:82–115.
Felzenszwalb, P. F. and Huttenlocher, D. P. (2004). Ef-
ficient Graph-Based Image Segmentation. Interna-
tional Journal of Computer Vision, 59(2):167–181.
Huang, Y., Qiu, C., Guo, Y., Wang, X., and Yuan, K. (2018).
Surface Defect Saliency of Magnetic Tile. 2018 IEEE
14th International Conference on Automation Science
and Engineering (CASE), 00:612–617.
Kass, M., Witkin, A., and Terzopoulos, D. (1988). Snakes:
Active contour models. International Journal of Com-
puter Vision, 1(4):321–331.
K
¨
unzel, J., M
¨
oller, R., Waschnewski, J., Werner, T., Eis-
ert, P., and Hilpert, R. (2018). Automatic Analysis of
Sewer Pipes Based on Unrolled Monocular Fisheye
Images. 2018 IEEE Winter Conference on Applica-
tions of Computer Vision (WACV), pages 2019–2027.
Kohlbrenner, M., Bauer, A., Nakajima, S., Binder, A.,
Samek, W., and Lapuschkin, S. (2020). Towards best
practice in explaining neural network decisions with
lrp. In Proceedings of the IEEE International Joint
Conference on Neural Networks (IJCNN), pages 1–7.
Linardatos, P., Papastefanopoulos, V., and Kotsiantis, S. B.
(2021). Explainable ai: A review of machine learning
interpretability methods. Entropy, 23.
Minaee, S., Boykov, Y. Y., Porikli, F., Plaza, A. J., Kehtar-
navaz, N., and Terzopoulos, D. (2021). Image Seg-
mentation Using Deep Learning: A Survey. IEEE
Transactions on Pattern Analysis and Machine Intel-
ligence, PP(99):1–1.
Montavon, G., Binder, A., Lapuschkin, S., Samek, W., and
M
¨
uller, K.-R. (2019). Layer-Wise Relevance Propa-
gation: An Overview, pages 193–209. Springer Inter-
national Publishing, Cham.
Pedregosa, F., Varoquaux, G., Gramfort, A., Michel, V.,
Thirion, B., Grisel, O., Blondel, M., Prettenhofer,
P., Weiss, R., Dubourg, V., et al. (2011). Scikit-
learn: Machine learning in python. Journal of ma-
chine learning research, 12(Oct):2825–2830.
Ronneberger, O., Fischer, P., and Brox, T. (2015). U-Net:
Convolutional Networks for Biomedical Image Seg-
mentation. arXiv.
Samek, W., Montavon, G., Vedaldi, A., Hansen, L. K., and
From Explanations to Segmentation: Using Explainable AI for Image Segmentation
625

M
¨
uller, K., editors (2019). Explainable AI: Interpret-
ing, Explaining and Visualizing Deep Learning, vol-
ume 11700 of Lecture Notes in Computer Science.
Springer.
Seibold, C., Hilsmann, A., and Eisert, P. (2021). Feature
focus: Towards explainable and transparent deep face
morphing attack detectors. Computers, 10(9).
Simonyan, K. and Zisserman, A. (2015). Very Deep Con-
volutional Networks for Large-Scale Image Recogni-
tion. CoRR, abs/1409.1556.
Smilkov, D., Thorat, N., Kim, B., Vi
´
egas, F. B., and Wat-
tenberg, M. (2017). Smoothgrad: removing noise by
adding noise. ArXiv, abs/1706.03825.
Sundararajan, M., Taly, A., and Yan, Q. (2017). Axiomatic
attribution for deep networks. ArXiv, abs/1703.01365.
Szeliski, R. (2011). Computer Vision, Algorithms and Ap-
plications. Texts in Computer Science. Springer.
Umbaugh, S. E. (2017). Digital Image Processing and
Analysis with MATLAB and CVIPtools, Third Edition.
CRC Press.
Vincent, L. and Soille, P. (1991). Watersheds in digital
spaces: an efficient algorithm based on immersion
simulations. IEEE Transactions on Pattern Analysis
and Machine Intelligence, 13(6):583–598.
VISAPP 2022 - 17th International Conference on Computer Vision Theory and Applications
626
