
Cross-lingual Detection of Dysphonic Speech for Dutch and
Hungarian Datasets
Dávid Sztahó
1
, Miklós Gábriel Tulics
1
, Jinzi Qi
2
, Hugo Van Hamme
2
and Klára Vicsi
1
1
Department of Telecommunication and Media Informatics,
Budapest University of Technology and Economics,
Budapest, Hungary
2
KU Leuven, Department Electrical Engineering ESAT-PSI, Leuven, Belgium
Keywords: Dysphonia, Speech, Machine Learning, Speech Disorder, SVM.
Abstract: Dysphonic voices can be detected using features derived from speech samples. Works aiming at this topic
usually deal with mono-lingual experiments using a speech dataset in a single language. The present paper
targets extension to a cross-lingual scenario. A Hungarian and a Dutch speech dataset are used. Automatic
binary separation of normal and dysphonic speech and dysphonia severity level estimation are performed and
evaluated by various metrics. Various speech features are calculated specific to an entire speech sample and
to a given phoneme. Feature selection and model training is done on Hungarian and evaluated on the Dutch
dataset. The results show that cross-lingual detection of dysphonic speech may be possible on the applied
corpora. It was found that cross-lingual detection of dysphonic speech is indeed possible with acceptable
generalization ability, while features calculated on phoneme-level parts of speech can improve the results.
Considering cross-lingual classification test sets, 0.86 and 0.81 highest F1-scores can be achieved for feature
sets with the vowel /E/ included and excluded, respectively and 0.72 and 0.65 highest Pearson correlations
can be achieved or severity prediction using features sets with the vowel /E/ included and excluded,
respectively.
1 INTRODUCTION
Speech is becoming more and more popular as a
biomarker for detecting diseases. There are numerous
disorders that affect speech production (either by
changing the organs or affecting the neuro-motor
aspect) and therefore can be identified by acoustic-
phonetic features. Almost one third of the population
is, at some point in their life, affected by dysphonia
(Cohen et al., 2012). The term dysphonia is often
inter-charged with hoarseness, nevertheless this
terminology is inaccurate because hoarseness is a
symptom of altered voice quality reported by patients,
while dysphonia is typified by a clinically recognized
disturbance of voice production (Johns et al., 2010).
The concepts of voice disorder and dysphonia are not
the same. A voice disorder occurs when somebody’s
voice quality, pitch, and loudness are inappropriate
for an individual’s age, gender, cultural background,
or geographic location, while dysphonia considers
only the auditory-perceptual symptoms of these
(Boone et al., 2005).
There are numerous works that deal with the
automatic separation of dysphonic and normal speech
by means of machine learning methods. There exist
corpora containing sustained vowels, such as the
Arabic Voice Pathology Database (AVPD), the
German Saarbrücken Voice Database (SVD) and the
Massachusetts Eye and Ear Infirmary (MEEI) speech
database. However, speech databases containing
continuous dysphonic speech are not easy to find.
Various results have been shown on various datasets.
In Ali et al. (2017) researchers use the MEEI voice
disorder database to test their designed and
implemented health care software for the detection of
voice disorders in non-periodic speech signals. The
classification was done with a support vector machine
(SVM) and the maximum obtained accuracy was
96.21%. In their experiment, the sustained vowel /ah/
was used, vocalized by dysphonic patients and
healthy controls. In Al-Nasheri et al. (2017)
accuracies are reported to be 99.54%, 99.53%, and
96.02% for MEEI, SVD, and AVPD. In their study a
SVM was applied as a classifier on sustained vowel
/a/ extracted from the databases for both normal and
Sztahó, D., Tulics, M., Qi, J., Van Hamme, H. and Vicsi, K.
Cross-lingual Detection of Dysphonic Speech for Dutch and Hungarian Datasets.
DOI: 10.5220/0010890200003123
In Proceedings of the 15th International Joint Conference on Biomedical Engineering Systems and Technologies (BIOSTEC 2022) - Volume 4: BIOSIGNALS, pages 215-220
ISBN: 978-989-758-552-4; ISSN: 2184-4305
Copyright
c
2022 by SCITEPRESS – Science and Technology Publications, Lda. All rights reserved
215

pathological voices. Some of the works presented on
the MEEI voice disorder database reveal very high
results that led researchers to question the usefulness
of the database. Muhammad et al. in (Muhammad et
al., 2017) argue that the normal and pathological
voices are recorded in two different environments in
this database. Therefore, it is hard to distinguish
whether the system is classifying voice features or
environments. Using continuous speech is a different
matter. Vicsi and her colleagues (Vicsi et al., 2011)
used acoustic features measured from continuous
speech to classify 59 speakers into healthy (26
speakers) and dysphonia (33 speakers) groups. Their
classification accuracies were in the range of 86%-
88%. Thus, these evaluations aiming for automatic
separation of dysphonic and normal speech are hard
to compare, because of the different datasets they
used.
Multilingual evaluation of such experiments and
methods is rare. In (Shinohara et al., 2017), dysarthric
speech is considered for corpora in three languages.
The research uses only pitch related features and the
experiments are monolingual, meaning that detection
possibilities are evaluated on each dataset separately,
but not done in a cross-lingual way. The aim of this
work is to introduce a cross-language detection
evaluation done on dysphonic speech from Hungarian
and Dutch corpora. Beside the two-class decision,
cross-lingual experiments are done also for
estimating the severity of dysphonia. A support
vector machine is used for classification and support
vector regression (SVR) is used for severity
estimation.
In the next Section, the corpora and the methods
used are introduced along with the evaluation
scenarios. In Section 3, the results are detailed
followed by their discussion.
2 METHODS
2.1 Database
Two dysphonic speech datasets were used for the
study: a Hungarian and a Dutch containing the same
short tale (‘The North Wind and the Sun’) in each
language. All patients gave signed consent for their
voices to be recorded. Hungarian voice samples were
collected from patients during their appointments at
the Department of Head and Neck Surgery of the
National Institute of Oncology. Each patient was a
native speaker of Hungarian. A total of 148 patients
were recorded (75 females and 73 males). The RBH
scale (Wendler et al., 1986) was used for assessing
the state of the patients, which gives the severity of
dysphonia, where R stands for roughness, B for
breathiness and H for overall hoarseness. H was used
for severity labels for the Hungarian samples, ranging
from 0 to 3: 0 - no hoarseness, 1 - mild hoarseness, 2
- moderate hoarseness, 3 - severe hoarseness. Beside
the patient samples, 160 healthy samples were
recorded with the same age distribution. The
distribution of the H value in the dataset is shown in
Table 1.
Dutch samples were recorded at the university
hospital of KU Leuven, Belgium, from a total of 30
patients visiting their speech therapist. Samples were
assessed according to the GRBAS (Grade - overall
judgement of hoarseness, Roughness, Breathiness,
Asthenia, Strain) scale by Hirano’s study in 1981 in
the Anglo-Saxon and Japanese territory (Omori,
2011). The value G was used as severity labels, which
ranges from 0 to 3, where 0 is the lack of hoarseness
(normal), 1 is a slight degree, 2 is a medium degree,
and 3 is a high degree of hoarseness. Beside the
patient samples, 30 healthy samples were recorded
with the same age distribution. The distribution of the
G value in the dataset is shown in Table 1. Both H and
G values mean the hoarseness of the voice in the
different assessment protocols. For the sake of clarity,
throughout the paper we will use the notation ‘H’ for
the severity of both datasets.
Automatic segmentation of the corpora was done
by force-alignment automatic speech recognition
(ASR) using the available transcription for both
languages (Kiss et al., 2013).
Table 1: Hoarseness distribution of datasets.
hoarseness assessment
0 1 2 3
dataset
Hungarian 160 46 57 45
Dutch 30 10 17 3
2.2 Acoustic Features
The list of acoustic features used in the study is shown
in Table 2. It shows how each feature is summarized
for a sample (its mean value, standard deviation or
range). The calculation frame is also shown for each
feature. A feature can be calculated on the entire
sample without segmentation or only on phoneme /E/
(SAMPA alphabet) using phoneme level
segmentation. /E/ was selected because, apart from
the unstable schwa, it is the most frequent vowel in
Dutch and Hungarian. The exact calculation place is
BIOSIGNALS 2022 - 15th International Conference on Bio-inspired Systems and Signal Processing
216

Table 2: List of acoustic features and their calculation details.
Feature Calculation function for a sample Calculation frame Calculated on
intensity
mean, standard deviation, range
(full, 1, 5, 10, 25 percentile)
100 ms full sample, vowel /E/
pitch
mean, standard deviation, range
(full, 1, 5, 10, 25 percentile), slope
64 ms full sample, vowel /E/
mfcc mean 25 ms full sample, vowel /E/
jitter mean, standard deviation 64 ms full sample, vowel /E/
shimmer mean, standard deviation 64 ms full sample, vowel /E/
HNR mean, standard deviation 64 ms full sample, vowel /E/
SPI - 25 ms full sample, vowel /E/
first two formants and
their
b
andwi
d
ths
mean, standard deviation 25 ms vowel /E/
IMF_ENTROPY_RATIO full vowel vowel /E/
Table 3: Dysphonia classification results using model trained on Hungarian samples.
features case acc sens spec F1 AUC
with /E/
feature selection on Hun
g
arian sam
p
les 0.88 0.85 0.90 0.87 0.92
evaluation on Dutch samples 0.86 0.86 0.87 0.86 0.95
without /E/
feature selection on Hungarian samples 0.82 0.77 0.88 0.81 0.90
evaluation on Dutch samples 0.81 0.83 0.80 0.81 0.91
Table 4: Dysphonia severity estimation results using model trained on Hungarian samples.
features case Spearman Pearson RMSE
with /E/
feature selection on Hungarian samples 0.73 0.75 0.75
testing on Dutch samples 0.74 0.72 0.79
without /E/
feature selection on Hungarian samples 0.71 0.73 0.79
testing on Dutch samples 0.66 0.65 0.88
also noted in the table. Each feature was calculated
with a 10 ms timestep.
2.3 Classification and Regression
Binary classification (healthy vs. dysphonic speech)
was done by support vector machines (Chang & Lin,
2011) (c-SVM). SVM was chosen as it is a common
baseline classifier with appropriate performance and
generalization ability achieved on limited number of
data (Tulics et al., 2019). A linear kernel function was
used and the hyperparameter C (cost) was set to 1.
Severity of dysphonia was estimated by support
vector regression (epsilon-SVR). Also here, a linear
kernel function was applied with C set to 1. Cross-
lingual experiment scenarios were created in which
the Dutch corpus was applied as an independent test
dataset and the corpus of the Hungarian samples was
used as a training-development set in a 10-fold cross-
validation setup (folds are disjoint over the speaker
set). Because the Dutch corpus had a limited number
of samples, training a model with these samples is not
yet possible. Feature selection was done on the
training-development set by applying an evolutionary
algorithm (Jungermann, 2009) (parameters: 5 as
population size, 1 as minimum number of features, 30
as maximum number of generations). The
experiments were carried out in RapidMiner 9.2
(RapidMiner).
Performance of classification was evaluated by
the following metrics: accuracy, sensitivity,
specificity, F1-score and are under the curve (AUC)
score. Severity score estimation (regression) was
evaluated by Spearman and Pearson correlation and
root mean square error (RMSE).
Cross-lingual Detection of Dysphonic Speech for Dutch and Hungarian Datasets
217
3 RESULTS
Classification and regression tests were carried out to
evaluate the cross-lingual detection possibilities of
speech samples of dysphonia. The automatic
separation possibility of dysphonic speech was
examined through binary classification and automatic
severity level estimation was investigated by
regression. Due to the cross-lingual nature of the
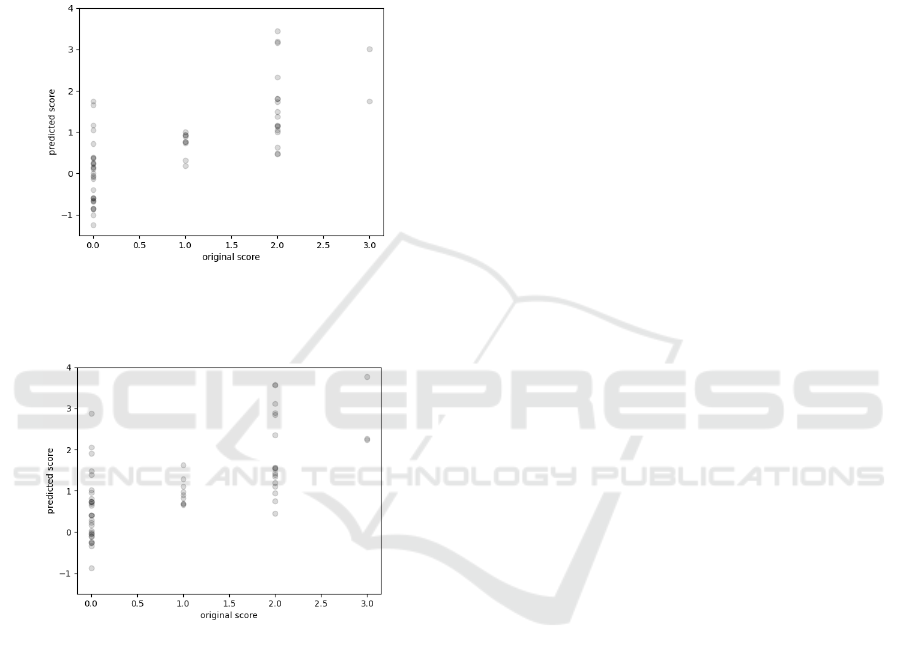
Figure 1: Scatter plot of original and the estimated H scores
for Hungarian-Dutch cross-lingual scenario with features
derived from the vowel /E/.
Figure 2: Scatter plot of original and the estimated H scores
for Hungarian-Dutch cross-lingual scenario without
features derived from the vowel /E/.
experiments, training and test samples differ in
language, so language specific features may reduce
performance. Therefore, two sets of initial feature sets
were applied: one including all features calculated
both on the entire sample and on the vowels /E/ (listed
in Table 1), and the other set was a reduced set
including only the features calculated on the entire
sample without applying any features resulting from
language specific pre-processing. Our aim was to
examine if language-dependent processing such as
phoneme-level segmentation and calculation of
features of phoneme /E/ could improve or worsen the
results.
3.1 Dysphonic Speech Classification
Results of classification evaluation are shown in
Table 3 for the two feature sets (with and without
features derived from vowel /E/, respectively).
Accuracy, sensitivity, specificity, F1-score and AUC
values are shown, in this order. Results on both the
training-development and the test sets are shown. If
both are equal or close, the generalization ability of
the trained model can be considered good in the
targeted language. As the table shows, training on
Hungarian samples, both feature sets have a good
generalization. Features using vowel /E/ performed
better in this case. Considering test sets, 0.86 and 0.81
highest F1-scores can be achieved for feature sets
with the vowel /E/ included and excluded,
respectively.
3.2 Dysphonic Severity Estimation
Similar to classification, results of severity score
estimation (regression) are shown in Table 4 for the
two feature sets (with and without features derived
from vowel /E/, respectively). Spearman, Pearson
correlations and root mean square error (RMSE)
values are shown, in this order. As expected, similar
tendencies can be observed for both cross-lingual
directions and feature sets. Training the model with
Hungarian samples and evaluating it on Dutch
samples shows a high generalization ability and a
reasonable accuracy, with better results using all
features. Considering test sets, 0.72 and 0.65 highest
Pearson correlations can be achieved for features sets
with the vowel /E/ included and excluded,
respectively. Figures 1 and 2 show the scatter plots of
original and the estimated H scores for the two
features sets. Markers are plotted with transparent
colours in order to see their distribution.
4 DISCUSSION
As the results show, cross-lingual detection of
dysphonic speech may be possible. There are two
main statements that can be derived from the analysis:
(1) an acceptable generalization ability can be
achieved and (2) phoneme-level features measured on
/E/ can enhance cross-lingual results.
The Hungarian sample set contains much more
samples than the Dutch set (~5 times more). This
surely has a significant effect on performance.
Results here are obtained by building models using
Hungarian samples and evaluating them on the Dutch
corpus, while the other direction is not possible due
BIOSIGNALS 2022 - 15th International Conference on Bio-inspired Systems and Signal Processing
218

to the low number of Dutch samples. It is clear that
30 samples are not enough for building a model, let
alone a model sufficient for cross-lingual purposes. It
may lead to overfitting and low generalization.
Training the model with the Hungarian set results in
comparable evaluation metrics on the development
and the test sets, showing a good generalization
ability. About 300 samples (the used Hungarian
corpus) seems to be sufficient to train a model for
cross-lingual usage. Here, the goal was not to
maximize the performance of one language, but to do
a preliminary study on cross-lingual detection
possibilities using the dataset. A comprehensive
study on the Hungarian sample set has been carried
out by Tulics et al. (2019).
Features calculated on phonemes also seem to
have an effect on cross-lingual performance. These
features can increase performance, as was seen with
models built on Hungarian samples. Segmentation
was done automatically by force-alignment ASR.
Naturally, this automatic method may have errors, but
it seems that performance increase is possible even
with such a fully automatic pipeline.
Regression results show the same tendency as
classification. A higher level of severity increases the
dysphonia separation ability of features.
Two languages are considered here, Dutch and
Hungarian, mainly because there were speech
samples available with same linguistic content.
However, we acknowledge that this somewhat limits
the cross-lingual generalization ability due to the
spectral similarities of the two languages. As a future
research, it would be good to extend the study with
languages with larger differences.
5 CONCLUSIONS
In the present work, cross-lingual experiments of
dysphonic voice detection and dysphonia severity
level estimation are carried out. The results show that
this is possible using the datasets presented. Various
acoustic features are calculated on the entire speech
samples and at the phoneme level.
It was found that cross-lingual detection of
dysphonic speech is indeed possible with acceptable
generalization ability and features calculated on
phoneme-level parts of speech can in improve the
results. Support vector machines and support vector
regression are used as classification and regression
methods. Feature selection and model training is done
on dataset using 10-fold cross validation of one
(source) language and evaluated on the other (target)
language. Considering cross-lingual classification
test sets, 0.86 and 0.81 highest F1-scores can be
achieved for features sets with the vowel /E/ included
and excluded, respectively and 0.72 and 0.65 highest
Pearson correlations can be achieved for features sets
with the vowel /E/ included and excluded,
respectively. In the future, cross-linguistic
experiments are considered using more language
independent feature extraction techniques and
extended datasets.
ACKNOWLEDGEMENTS
Project no. K128568 has been implemented with the
support provided from the National Research,
Development and Innovation Fund of Hungary,
financed under the K_18 funding scheme. The
research was partly funded by the CELSA
(CELSA/18/027) project titled: “Models of
Pathological Speech for Diagnosis and Speech
Recognition”.
REFERENCES
Ali, Z., Talha, M., & Alsulaiman, M. (2017). A practical
approach: Design and implementation of a healthcare
software for screening of dysphonic patients. IEEE
Access, 5, 5844–5857.
Al-Nasheri, A., Muhammad, G., Alsulaiman, M., Ali, Z.,
Malki, K. H., Mesallam, T. A., & Ibrahim, M. F. (2017).
Voice pathology detection and classification using
auto-correlation and entropy features in different
frequency regions. Ieee Access, 6, 6961–6974.
Boone, D. R., McFarlane, S. C., Von Berg, S. L., & Zraick,
R. I. (2005). The voice and voice therapy.
Chang, C.-C., & Lin, C.-J. (2011). LIBSVM: A library for
support vector machines. ACM Transactions on
Intelligent Systems and Technology, 2(3), 27:1-27:27.
Cohen, S. M., Kim, J., Roy, N., Asche, C., & Courey, M.
(2012). Prevalence and causes of dysphonia in a large
treatment-seeking population. The Laryngoscope,
122(2), 343–348.
Johns, M. M., Sataloff, R. T., Merati, A. L., & Rosen, C. A.
(2010). Shortfalls of the American Academy of
Otolaryngology–Head and Neck Surgery’s Clinical
practice guideline: Hoarseness (dysphonia).
Otolaryngology-Head and Neck Surgery, 143(2), 175–
177.
Jungermann, F. (2009). Information extraction with
rapidminer. Proceedings of the GSCL
Symposium’Sprachtechnologie Und EHumanities, 50–
61.
Kiss, G., Sztahó, D., & Vicsi, K. (2013). Language
independent automatic speech segmentation into
phoneme-like units on the base of acoustic distinctive
features. 2013 IEEE 4th International Conference on
Cross-lingual Detection of Dysphonic Speech for Dutch and Hungarian Datasets
219

Cognitive Infocommunications (CogInfoCom), 579-
582.
Muhammad, G., Alsulaiman, M., Ali, Z., Mesallam, T. A.,
Farahat, M., Malki, K. H., Al-nasheri, A., & Bencherif,
M. A. (2017). Voice pathology detection using
interlaced derivative pattern on glottal source
excitation. Biomedical Signal Processing and Control,
31, 156–164.
Omori, K. (2011). Diagnosis of voice disorders. JMAJ,
54(4), 248–253.
RapidMiner (9.2). (n.d.). [Computer software]. https://
rapidminer.com/
Shinohara, S., Omiya, Y., Nakamura, M., Hagiwara, N.,
Higuchi, M., Mitsuyoshi, S., & Tokuno, S. (2017).
Multilingual evaluation of voice disability index using
pitch rate. Adv. Sci. Technol. Eng. Syst. J, 2, 765–772.
Tulics, M. G., Szaszák, G., Mészáros, K., & Vicsi, K.
(2019). Artificial neural network and svm based voice
disorder classification. 2019 10th IEEE International
Conference on Cognitive Infocommunications
(CogInfoCom), 307–312.
Vicsi, K., Viktor, I., & Krisztina, M. (2011). Voice disorder
detection on the basis of continuous speech. 5th
European Conference of the International Federation
for Medical and Biological Engineering, 86–89.
Wendler, J., Rauhut, A., & Krüger, H. (1986).
Classification of voice qualities**Dedicated to Prof.
Dr. Med. Peter Biesalski on the occasion of his 70th
birthday. Journal of Phonetics, 14(3), 483–488. https://
doi.org/10.1016/S0095-4470(19)30694-1
BIOSIGNALS 2022 - 15th International Conference on Bio-inspired Systems and Signal Processing
220
