
Influence of Texture Fidelity on Spatial Perception in Virtual Reality
Andrei Iuliu Lucaci, Morten Trier Bach, Poul Anker Jensen and Claus Brøndgaard Madsen
a
Computer Graphics Group, Department of Architecture and Media Technology, Aalborg University, Aalborg, Denmark
Keywords:
Virtual Reality, Spatial Perception, Verbal Assessment, Architectural Visualization.
Abstract:
In this paper, we investigate the influence of texture fidelity on spatial perception in a standalone virtual reality
application. To investigate this, we implemented a detailed virtual representation of an actual physical environ-
ment, namely a small one-bedroom apartment. The virtual apartment representation was tested in two different
visual styles: high fidelity realistic textures, and a ”paper model” texture. Some test subjects experienced the
virtual models using the actual physical apartment as transitional environment, other subjects experienced the
model at an unrelated physical location. The environments were evaluated with 20 participants aged 20 to 61
and results indicated a systematic overestimation of distances in virtual reality for all conditions. The results
showed that a higher texture fidelity had a positive influence on precision but no significant influence on accu-
racy. It was also showed that transitional environments negatively influenced precision, but had no significant
influence on accuracy. Self assessments of presence from the experiment supported previous claims about a
correlation between the level of detail in an environment and presence, but not a correlation between presence
and distance perception.
1 INTRODUCTION
Architectural visualization, in its essence, is a pro-
cess that transports a concept from a two dimensional
perspective to a three dimensional image or a physi-
cal mockup. Due to the advancement of computers,
there are also a plethora of software solutions that can
facilitate creating a computer generated architectural
model. Recently, the idea of combining Virtual Re-
ality (VR) and game engines brings a new level of
creativity and control to achieve high-realism scenes
(Team, 2018).
Standalone VR headsets increases the potential of
VR by affording greater flexibility than computer-
tethered devices, and have more features than a
browser or a mobile phone. In recent years, advance-
ments in Head-mounted Display (HMD) technology
has made the idea of owning a VR headset without
the need of a VR Ready computer more palpable, as
is indicated by the popularity of the Oculus Quest 2
(Lang, 2021).
While HMDs show promise, they still have some
issues. One such issue is that spatial perception in VR
has repeatedly been shown to be inaccurate, which
brings into question the use of VR as a medium for
architectural visualisation (Loyola, 2018).
a
https://orcid.org/0000-0003-0762-3713
On the other hand, studies researching spatial per-
ception in VR suggests that a high fidelity, low la-
tency, immersive environment can decrease the in-
accuracies in user’s distance perception (Interrante
et al., 2006) (Phillips et al., 2009a) (Phillips et al.,
2009b).
With this in mind, the aim of this study was to
“investigate the influence of texture fidelity on spatial
perception in standalone virtual reality for architec-
tural visualization.”
2 SPATIAL PERCEPTION IN
VIRTUAL REALITY
Spatial perception in Virtual Reality (VR) has been
extensively studied and the consensus appears to be
that spatial perception in VR is compressed compared
to spatial perception in the real world (Interrante et al.,
2006) (Loyola, 2018). I.e., in VR people generally
feel that the space is smaller than its real physical
counterpart. If such spatial mis-perception is indeed
the case, the concept of using VR as a tool in archi-
tectural design and validation processes is obviously
compromised, as it can lead to misrepresentation by
architects and clients alike (Loyola, 2018).
244
Lucaci, A., Bach, M., Jensen, P. and Madsen, C.
Influence of Texture Fidelity on Spatial Perception in Virtual Reality.
DOI: 10.5220/0010890100003124
In Proceedings of the 17th International Joint Conference on Computer Vision, Imaging and Computer Graphics Theory and Applications (VISIGRAPP 2022) - Volume 1: GRAPP, pages
244-251
ISBN: 978-989-758-555-5; ISSN: 2184-4321
Copyright
c
2022 by SCITEPRESS – Science and Technology Publications, Lda. All rights reserved
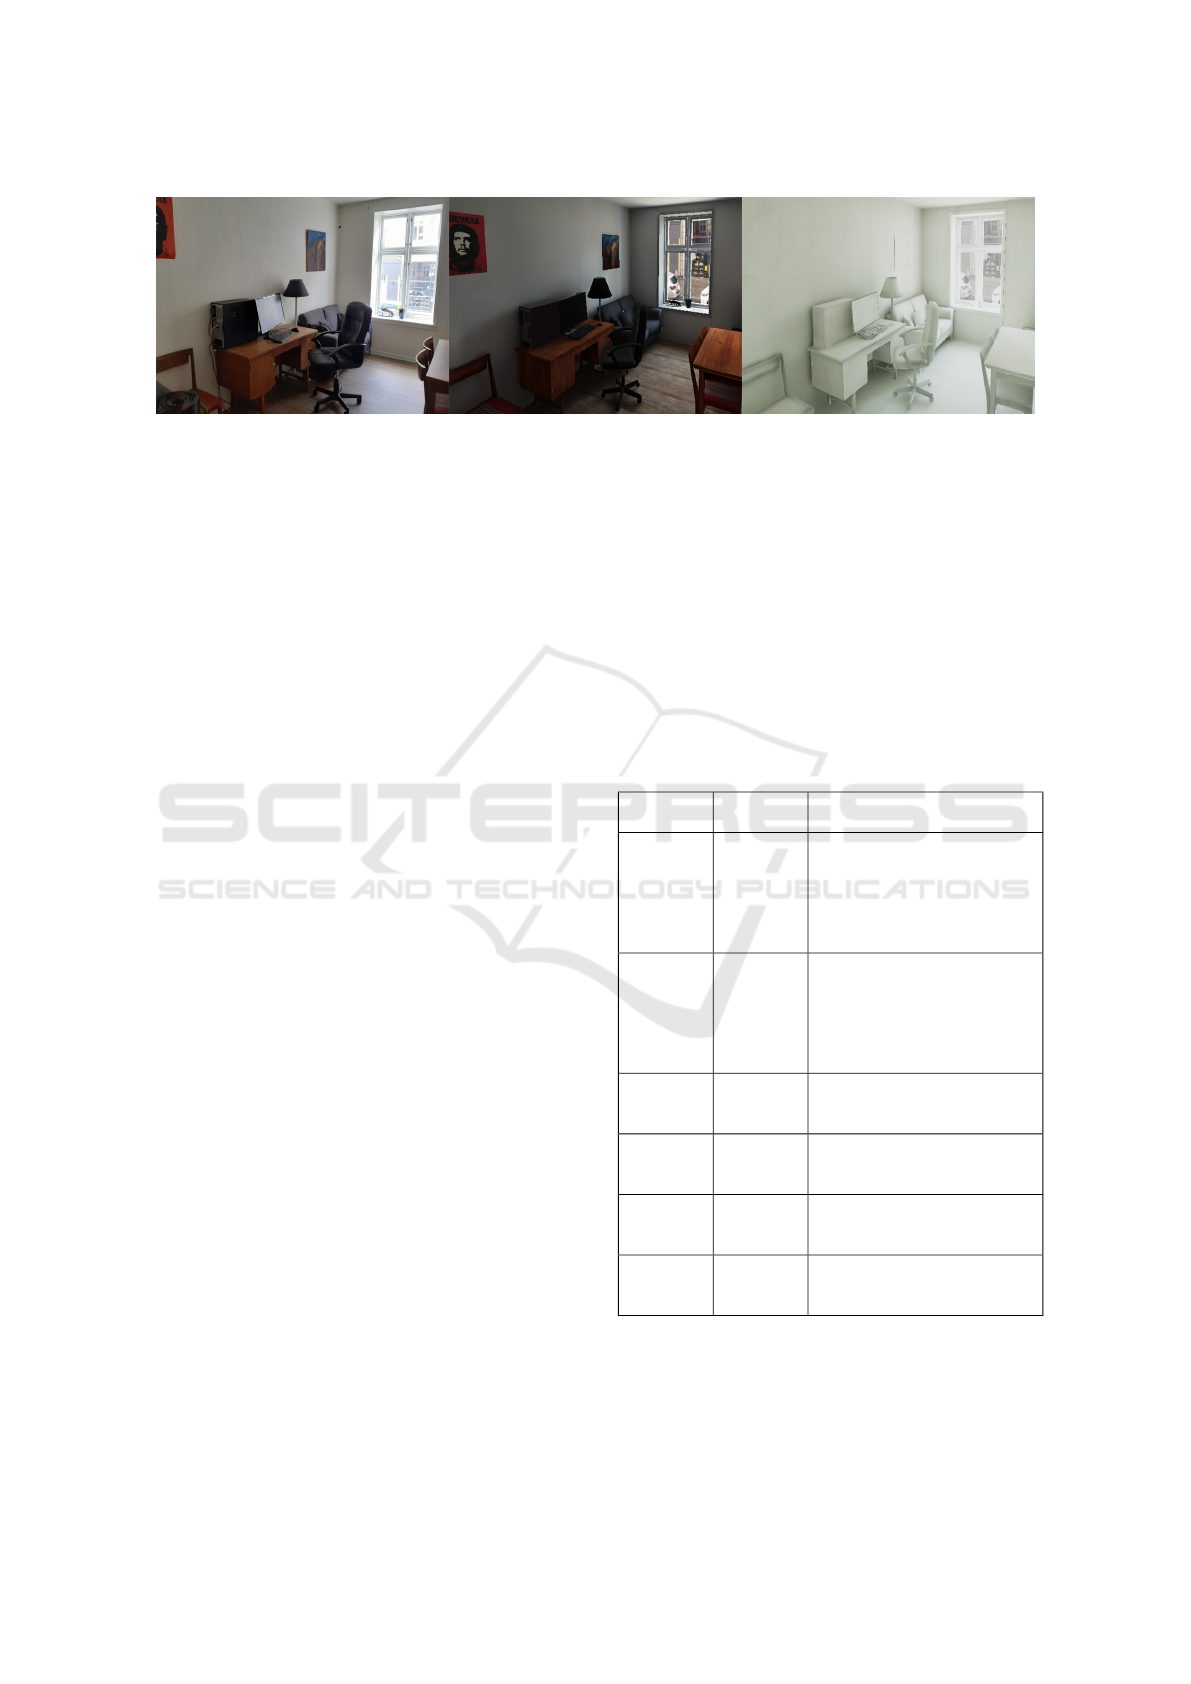
Figure 1: Spatial perception was assessed with verbal assessment in virtual environments with different texture fidelities
modelled after a real life room (left image).
A series of studies by Interrante et al. investigates
the influence of immersion and fidelity on spatial per-
ception in VEs (Interrante et al., 2006) (Phillips et al.,
2009a). Their main findings were that distance per-
ception appears to not be significantly compressed
in high fidelity, low latency, immersive environments
and even less if the VE represents an exact replica of
the room in which the user is located in, in the real
world (Interrante et al., 2006) (Phillips et al., 2009a).
In their initial paper on the subject, they also suggest
that the user’s sense of presence might have an influ-
ence on their estimates (Interrante et al., 2006).
In a more recent study by Interrante et al. they in-
vestigated distance estimation in a non-photorealistic
VE against a photorealistic VE (Phillips et al., 2009b).
The findings of their study supports their previous
findings as the participants were significantly better at
assessing distances in the photorealistic environment
than in the non-photorealistic environment.
In their paper it is also discussed that a possi-
ble explanation for their findings could be that the
unrealistic nature of their representation of a non-
photorealistic environment possibly interfered with
the participants’ presence in the environment, as it de-
viates a lot from the real world (Phillips et al., 2009b).
Hornsey and Hibbard further support the find-
ing that distance estimation is biased towards un-
derestimation, (Hornsey and Hibbard, 2021). They
also found that the more pictorial cues are added to
a scene, the better the distance estimation will be
(Hornsey and Hibbard, 2021). Finally, they found
that texture gradients have a positive influence on dis-
tance estimation, especially at very short distances
(Hornsey and Hibbard, 2021).
Based on the above, we found it interesting to in-
vestigate whether the texture fidelity alone has an in-
fluence on distance assessment even if applied to the
same geometry. In order to measure the participants
perceived distances a few methods for this were re-
viewed.
2.1 Measurement Methods for
Perceived Distance
To evaluate the users’ spatial perception of our VE, a
measurement method was needed. Choosing a mea-
surement method for perceived distance can be diffi-
cult as perception is very abstract. Table 1 shows the
prominence of various different approaches in previ-
ous studies on spatial perception in VR.
Table 1: Measurement methods for perceived distance from
previous studies including whether they can measure ego-
centric or exo-centric distances.
Method Ego or
Exo
References
Verbal
Assess-
ment
Both (Loyola, 2018) (Peer and
Ponto, 2017) (Ng et al.,
2016) (Armbr
¨
uster et al.,
2008) (Gagnon et al., 2020)
(Klein et al., 2009) (Kelly
et al., 2017)
Blind
Walking
Ego (Interrante et al., 2006) (Peer
and Ponto, 2017) (Kelly
et al., 2018) (Li et al., 2015)
(Kelly et al., 2017) (Klein
et al., 2009) (Phillips et al.,
2009b)
Resizing
Objects
Both (Kelly et al., 2018) (Kelly
et al., 2017) (Jensen et al.,
2020)
Time
Imagined
Walking
Ego (Peer and Ponto, 2017)
(Klein et al., 2009)
Resizing
Environ-
ment
Both (Jensen et al., 2020)
Blind
Throw-
ing
Ego (Peer and Ponto, 2017)
Having explored the methods shown in Table 1,
we chose to use verbal assessment as our measure
method. Even though some studies have suggested
that blind walking is more reliable (Ng et al., 2016),
Influence of Texture Fidelity on Spatial Perception in Virtual Reality
245
evidence found by Klein et. al suggests that this is
only the case in larger outdoor areas and that the
methods have similar reliability in indoor scenarios
such as ours(Klein et al., 2009).
3 IMPLEMENTATION OF THE
VIRTUAL ENVIRONMENT
In a mobile Virtual Reality (VR) context, Unity’s
built-in Universal Rendering Pipeline (URP) appears
to be the optimal render pipeline. Since the Oculus
Quest platform can be considered a mobile platform,
the ease-of-use and mobile centered optimizations of
URP make it a solid foundation to achieve the level of
quality desired, considering the computational limita-
tions of the platform.
3.1 Virtual Reality Implementation
VR Implementation for the application was done us-
ing Unity’s XR Interaction Toolkit, which affords
adding an XR Rig to the environment. The XR Rig
is automatically connected to the Head-Mounted Dis-
play (HMD) being used by a user and the camera
follows the HMD position, while controller objects
follow the controllers being used. The Field-of-View
(FOV) set for the rendered camera is 98 degrees Ver-
tical, and 128 degrees Horizontal.
3.2 Modelling the Virtual Environment
Recreating a real indoor environment in VR required
us to create 3D models of the environment and furni-
ture. The foundation of the environment for our ex-
periment was created with a method similar to what
was previously explored by Ozacar et al. (Ozacar
et al., 2017), starting with a floor plan made in Sweet
Home 3D, which was exported to Unity as a 3D
model with walls, floors and ceilings.
3D models representing furniture recreated from
the real world were placed in the environment in ac-
cordance with scale and distance translated from the
metric system to Unity’s measuring system. These
models were created in either Blender or Maya and
textured with Substance Painter. For details like text,
logos or stickers some manipulation of the textures
were done in Adobe Photoshop. The models were
created with a relatively low amount of polygons to
limit the memory usage of the application as we are
working with standalone headsets, as was also high-
lighted by Unity as an important factor in optimizing
performance of applications (Technologies, 2020). To
accurately represent the chosen apartment, pictures
of the furniture were taken and used as reference, as
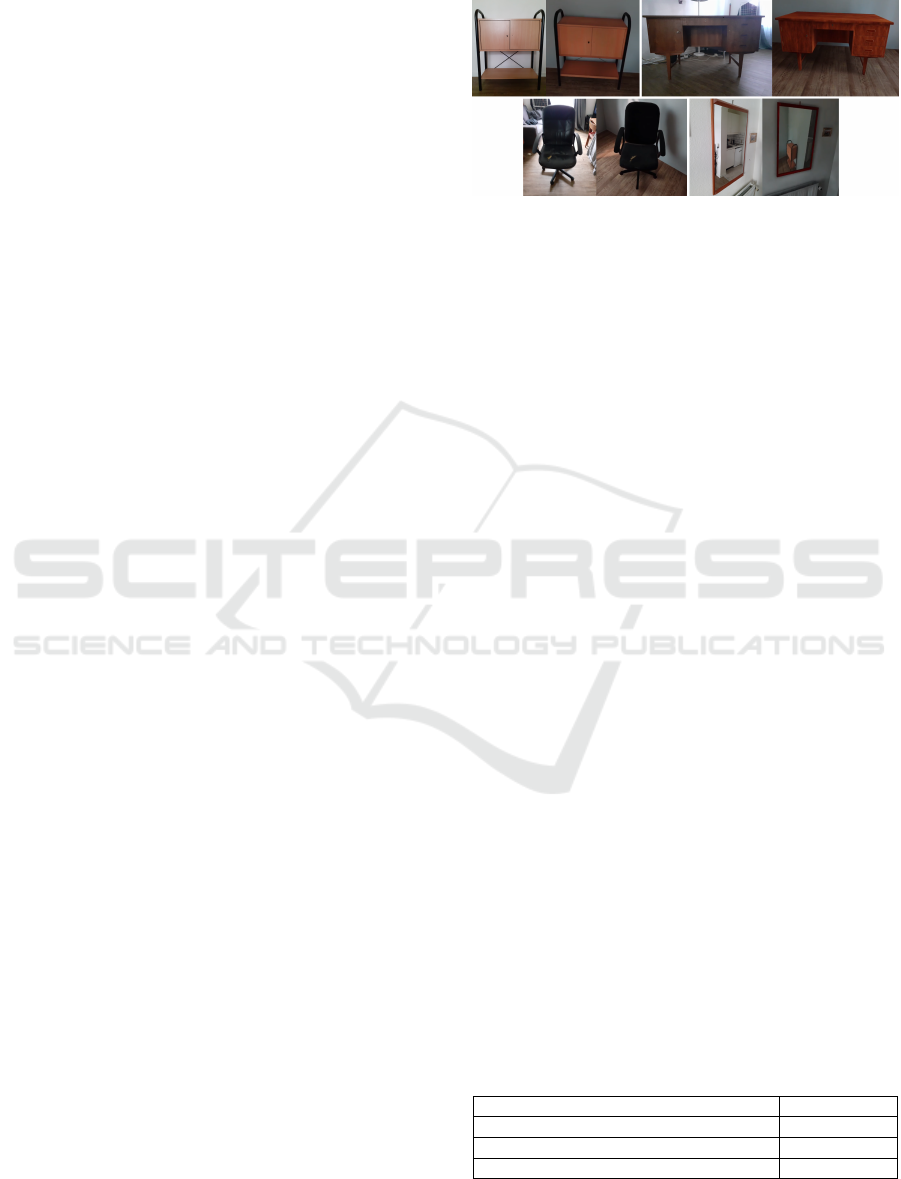
shown in Figure 2.
Figure 2: A sample of the modelled furniture, with the left
image being the real life version, in the respective order a
cupboard, a desk, an office chair and a mirror.
3.3 Virtual Environment Illumination
Lighting in the environment was achieved by combin-
ing a mixed directional light source (baked indirect
lighting and real-time shadows), a baked area light
source, and global illumination (GI). The directional
light was chosen to simulate direct sunlight with a
downwards facing angle entering through the win-
dow, and the area light was used to simulate the effect
of light from the sky. The sky area light was placed
just outside the window, facing into the room. In com-
bination these two types of light sources constitute a
typical, and efficient, approach to emulating exterior
daylight affecting an indoor scenario, (Birn, 2014).
The reflectivity of a material in a virtual world has
a significant effect on the aesthetics of the object that
it is applied to (Manson and Sloan, 2016). To increase
the materials ability to react to light in a realistic way,
Physically Based Rendering (PBR) was utilized. To
simplify the computation of reflections in the envi-
ronment, a reflection probe was used.
The reflection probe had a resolution of 256 pix-
els, and was used to ensure that light reflections (with
colours corresponding to objects they bounce off)
were present in the environment (see Figure 3).
Additionally, shadows were computed as shadow
maps, and ambient occlusion was applied to all ob-
jects. Finally a global volume for post processing ef-
fects was applied to the environment, allowing the in-
corporation of white balancing, gamma and gain al-
tering and tone mapping. The parameters for these
were set as shown in Table 2.
Table 2: Parameters used for Global Volume Post Process-
ing Effects.
Effect Parameter
Tonemapping ACES
Gamma 1.32
Gain 1.29
GRAPP 2022 - 17th International Conference on Computer Graphics Theory and Applications
246
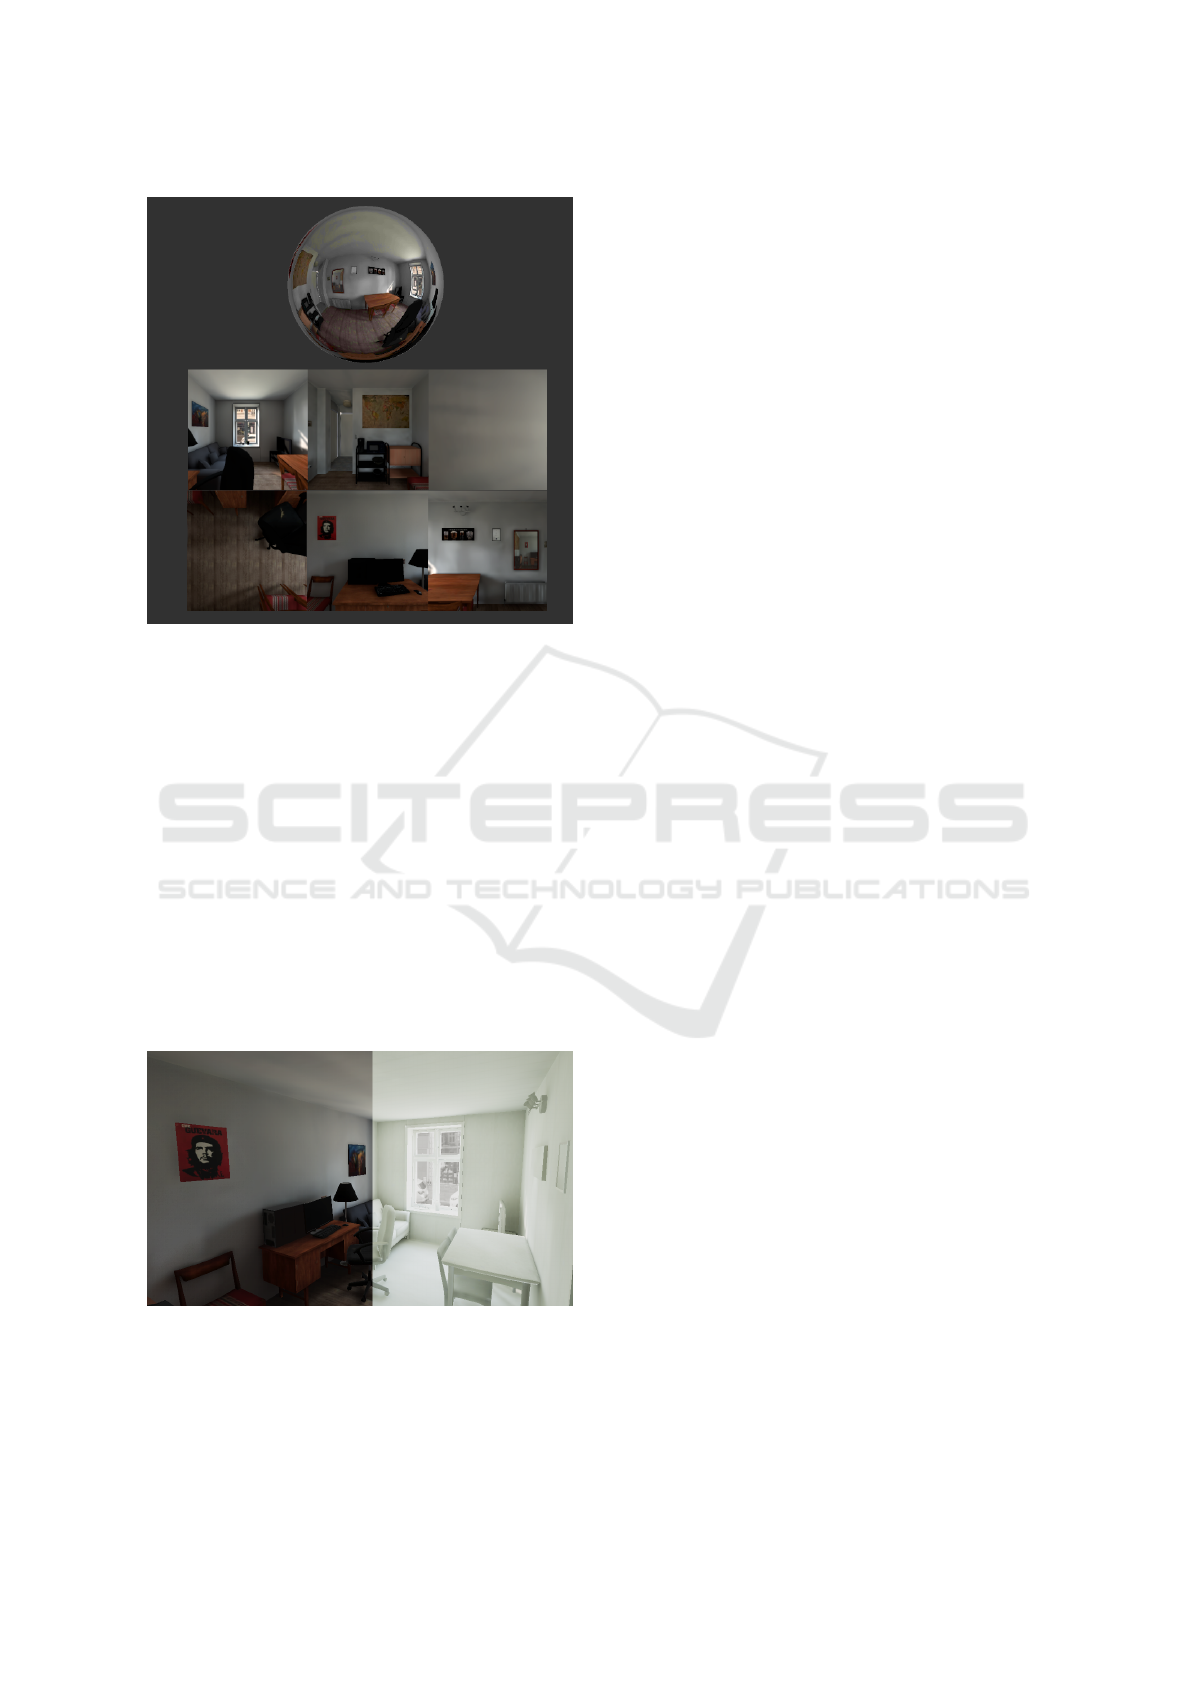
Figure 3: A reflection probe from the environment. Top part
is the probe itself, with the bottom part being the cubemap.
4 EXPERIMENTAL DESIGN
The independent variable in the experiment was the
texture fidelity of the environment with the two con-
ditions being: convincing textures and paper textures.
We used a between group design with two groups of
participants, each assigned to one of the conditions.
These conditions can be seen in Figure 4.
In the experiment we measured the participants’
spatial perception of the room, by asking them about
certain distances and getting them to verbally assess
them. The measurement method was chosen based on
the small size of the room as described in Section 2.1,
while other viable methods were presented in Table 1.
Figure 4: Side-by-side comparison of the two conditions,
with the left side being convincing textures and the right
side being the paper textures.
The primary interest of the study was to investi-
gate if convincing textures have an influence on the
user’s spatial perception of a Virtual Environment
(VE). To investigate the influence we came up with
the following set, “A”, of hypotheses.
Hypothesis A1: Participants experiencing the
scenario with convincing textures should assess
distance with higher accuracy and precision than
the ones experiencing the paper textures.
Hypothesis A2: Participants experiencing the
scenario with convincing textures should assess
distance with lower accuracy and precision than
the ones experiencing the paper textures.
Null Hypothesis A0: There is no significant dif-
ference in the accuracy or precision of assessing
distance, between participants experiencing con-
vincing textures and paper textures.
Previous research done by (Steinicke et al., 2009)
(Interrante et al., 2006) (Phillips et al., 2009a), have
explored the effects of ”transitional environments”.
This phenomenon implies that depth perception is
positively affected by entering a VE from the phys-
ical environment it represents. Thus, in the design
of our experiment, half of the participants entered the
VE from the modelled apartment, with the other half
entering the VE from an unrelated location. The sub-
set, “B”, of hypotheses is as follows:
Hypothesis B1: Participants entering the VR
scenario from the real-life equivalent of the vir-
tual environment should assess distance with
higher accuracy and precision than the ones who
enter from a unrelated location.
Hypothesis B2: Participants entering the VR
scenario from the real-life equivalent of the vir-
tual environment should assess distance with
lower accuracy and precision than the ones who
enter from an unrelated location.
Null Hypothesis B0: There is no significant dif-
ference in the accuracy or precision of assessing
distance, between participants entering from the
real-life equivalent of the virtual room and an un-
related location.
4.1 Participants
Participants for the experiment were contacted and re-
cruited through social media or email. For each of the
sub-experiments 10 participants were recruited - giv-
ing the experiment a total of 20 participants. The age
of the participants ranged from 20 to 61 - all with nor-
mal (20/20) or corrected vision.
Influence of Texture Fidelity on Spatial Perception in Virtual Reality
247
4.2 Apparatus
As we focused on standalone VR - the Oculus Quest
2 Head-Mounted Display (HMD) was used in the ex-
periment, as it has a higher resolution than the original
Quest (Technologies, 2021).
The inter-pupilary distance (IPD) of the Quest
2 can be physically set as 58, 63 or 68mm, which
was set to fit each individual participant, as a wrong
IPD can result in the view being blurry (Corporation,
2020). The Quest 2 further supports a 89 degree hor-
izontal Field-of-View (FOV), 90 degree vertical FOV
and 127 degree diagonal FOV (Brown, 2021).
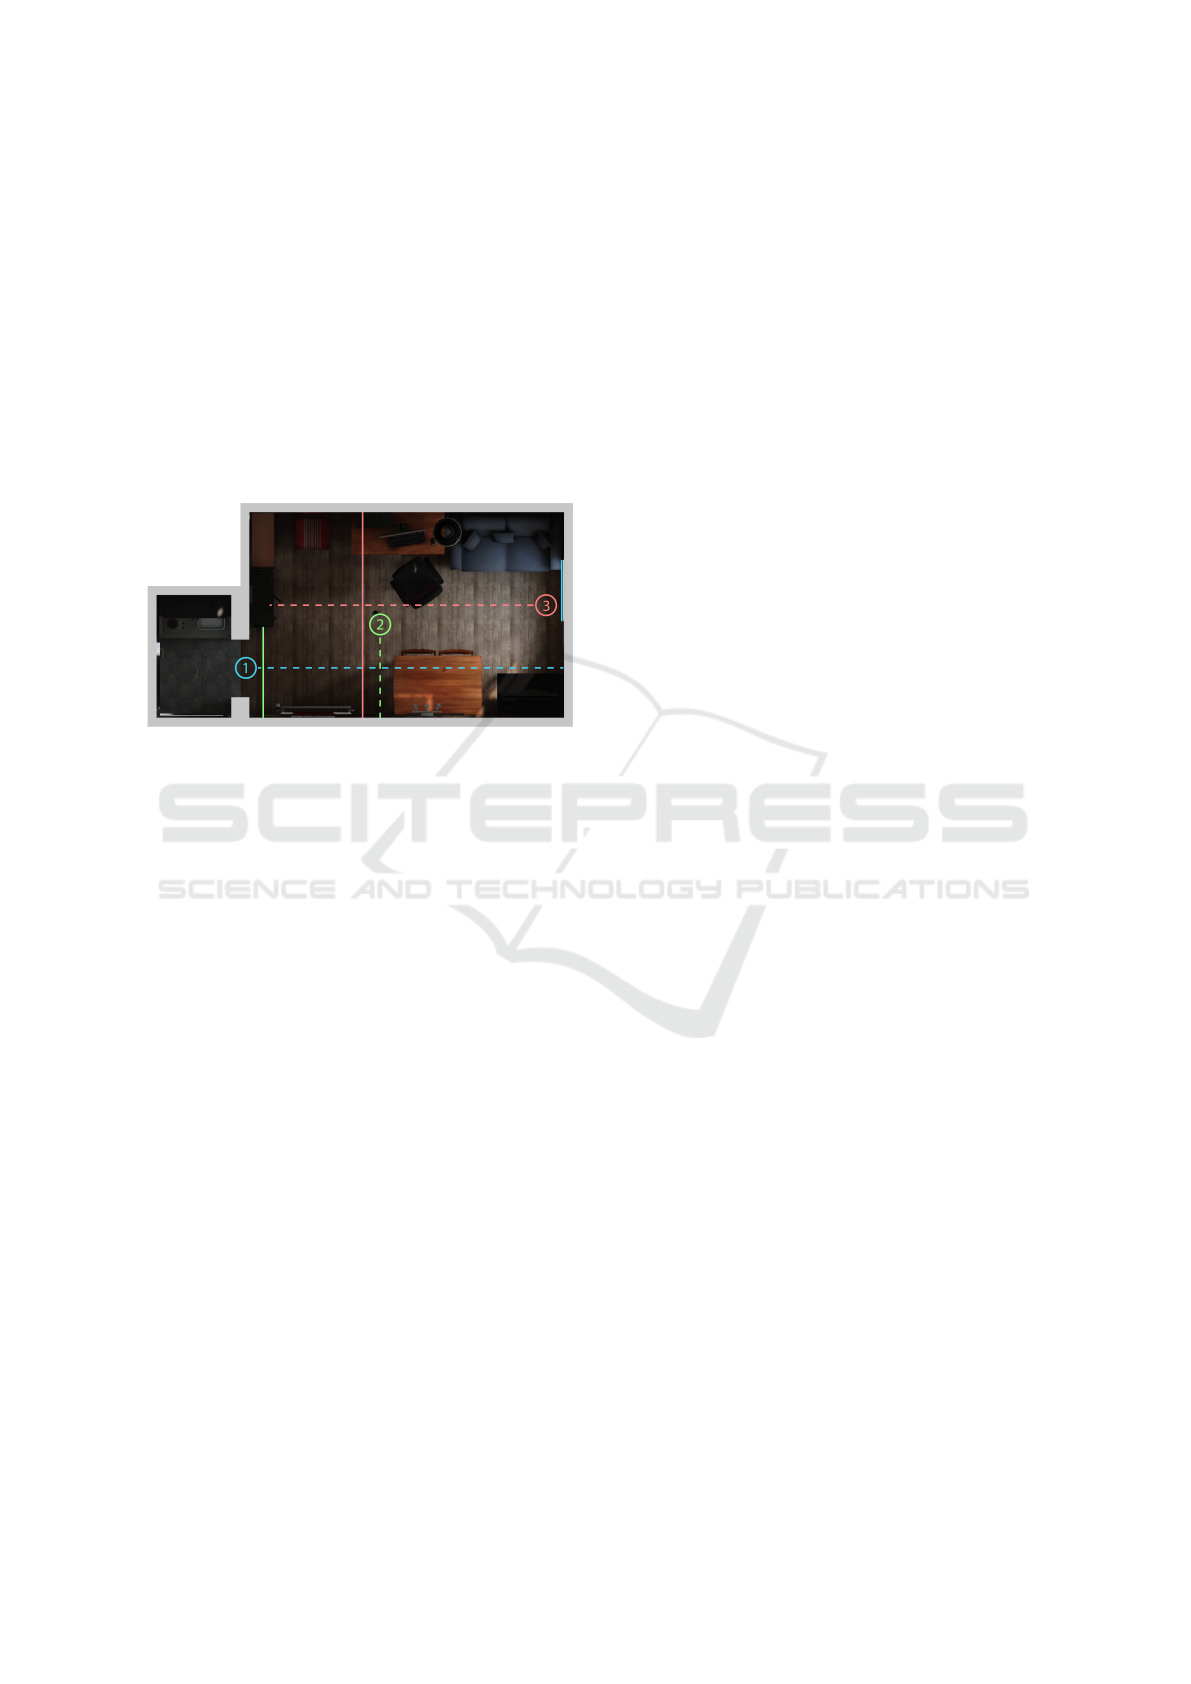
Figure 5: The teleportation spots are shown with a circle,
color-coded to match the distances assessed from them. The
ego-centric distances are shown with dotted lines, while the
exo-centric distances are shown with full lines.
4.3 Procedure
Firstly, the facilitators informed the participants about
the course of the experiment and ensured that they
were familiar with the HMD and the buttons they
would have to use on the controllers during the ex-
periment. In this introduction the physical IPD on
the HMD was also set to the best fitting state for the
participants. Once the participants were ready they
would enter the environment matching the respective
condition they were assigned to.
The participants would be asked to walk around
and explore the room for 1 minute, as it has been
proven to improve spatial perception in VEs (Kelly
et al., 2018), before beginning the distance assess-
ment tasks.
After exploring the room, the participants would
be asked to press the trigger to teleport to the first
spot in the room, which they had to assess distance
from. After teleporting, they were told to hold the
Oculus button until their position and orientation was
reset. This ensured that all participants were assess-
ing distances from the same location in the VE. After
assessing two distances in a spot, they would be asked
to teleport to the next spot following the same proce-
dure.
The spots and the distances are illustrated in a top-
down view of the environment in Figure 5. In total the
participants had to assess six distances ranging from
105cm to 440cm within the VE. While each partici-
pant was assessing distances, the facilitator would log
the assessments manually.
After finishing the assessments in Virtual Reality
(VR), the participants’ sense of presence in the en-
vironment was measured with the Igroup Presence
Questionnaire (IPQ) (igroup.org, 2016).
The questionnaire was included in the experiment
to see if the conditions had any influence on presence,
as it was suggested by Interente et al. that the fidelity
of the environment, presence and depth perception
is correlated (Interrante et al., 2006) (Phillips et al.,
2009a).
Following the questionnaire, a follow-up unstruc-
tured feedback session was initiated using the follow-
ing inquiry:
Did you think any of the objects looked less or
more believable than others?
The purpose was to elicit the participants’
thoughts on the environment and the perceived dis-
tances.
5 RESULTS
The presentation of the results from the experiment,
described above in Section 4, is split into three cate-
gories: Distance Assessment, Presence and Feedback
on the Environment. To validate that the results of the
experiment were minimally influenced by the perfor-
mance of the application on the Head-Mounted Dis-
play (HMD), the framerate was logged. This showed
that the condition with convincing textures had a me-
dian framerate of 48fps, which is marginally less than
the paper condition which had a median framerate of
52fps.
5.1 Distance Assessments
In order to visualize and analyze the distance assess-
ments from the experiment, the amount of error in the
participants’ assessments for all distances were ex-
pressed in percentage making them comparable - sim-
ilarly to what was done in prior research by Loyola et.
al (Loyola, 2018). For our analysis of significant dif-
ference between the groups, we chose to analyze the
absolute values to focus purely on their difference in
accuracy. Accuracy being defined as: ”how much the
assessments deviate from the actual distances”. In the
plots, however, we will use the relative errors to show
GRAPP 2022 - 17th International Conference on Computer Graphics Theory and Applications
248
the precision of the assessments. Precision is here de-
fined as: “how similarly participants within a certain
group assessed the distances”.
5.1.1 Distance Assessment Compared Between
the Conditions
The experiment showed no significant difference (p-
value = 0.83 > 0.05) in the absolute error deviations
from the participants’ distance assessment between
the two conditions, convincing textures and paper tex-
tures. There is therefore no evidence that the condi-
tions influenced accuracy in distance assessment.
Figure 6: Visualization of the precision within each condi-
tion showed with relative error deviation in percentage.
The standard deviation of the relative error in per-
centage for the condition with convincing textures
was 23.17 percent, whereas standard deviation for
condition with paper textures was 58.98 percent. As
the standard deviation was lower for the condition
with convincing textures, compared to the condition
with paper textures, it shows that the condition with
convincing textures has increased precision of assess-
ment within the sample.
The plot in Figure 6 shows a comparison of the
relative error deviation in percentage between the
conditions.
5.1.2 Distance Assessment Compared between
Apartment and Unrelated Location
The experiment also did not show significant differ-
ence (p-value = 0.25 > 0.05) in the absolute error
deviations from the participants’ distance assessment
between the locations. In our experiment there is
therefore also no evidence that being in the real life
equivalent of the Virtual Environment (VE) during the
experience has an influence on the accuracy of dis-
tance assessments.
The standard deviation of the relative error in per-
centage for the participants who experienced the ex-
periment in the real life equivalent of the VE was
Figure 7: Visualization of the precision within each location
showed with relative error deviation in percentage.
55.32 percent, whereas the standard deviation for the
ones who tried it in the unrelated location was 31.18
percent. As the standard deviation was lower for the
ones experiencing the experiment in the unrelated lo-
cation, compared to the ones experiencing it in the
real life equivalent of the VE, it shows that experienc-
ing it from the unrelated location has increased preci-
sion of assessment within the sample.
The plot in Figure 7 shows a comparison of the
relative error deviation in percentage between the
conditions.
5.2 Presence
The results from the presence questionnaires were av-
eraged and made into visual representations as pres-
ence profiles. No significant difference in presence
was found between the participants who tried the ex-
perience in the real life equivalent of the VE (i.e apart-
ment) or in the unrelated location.
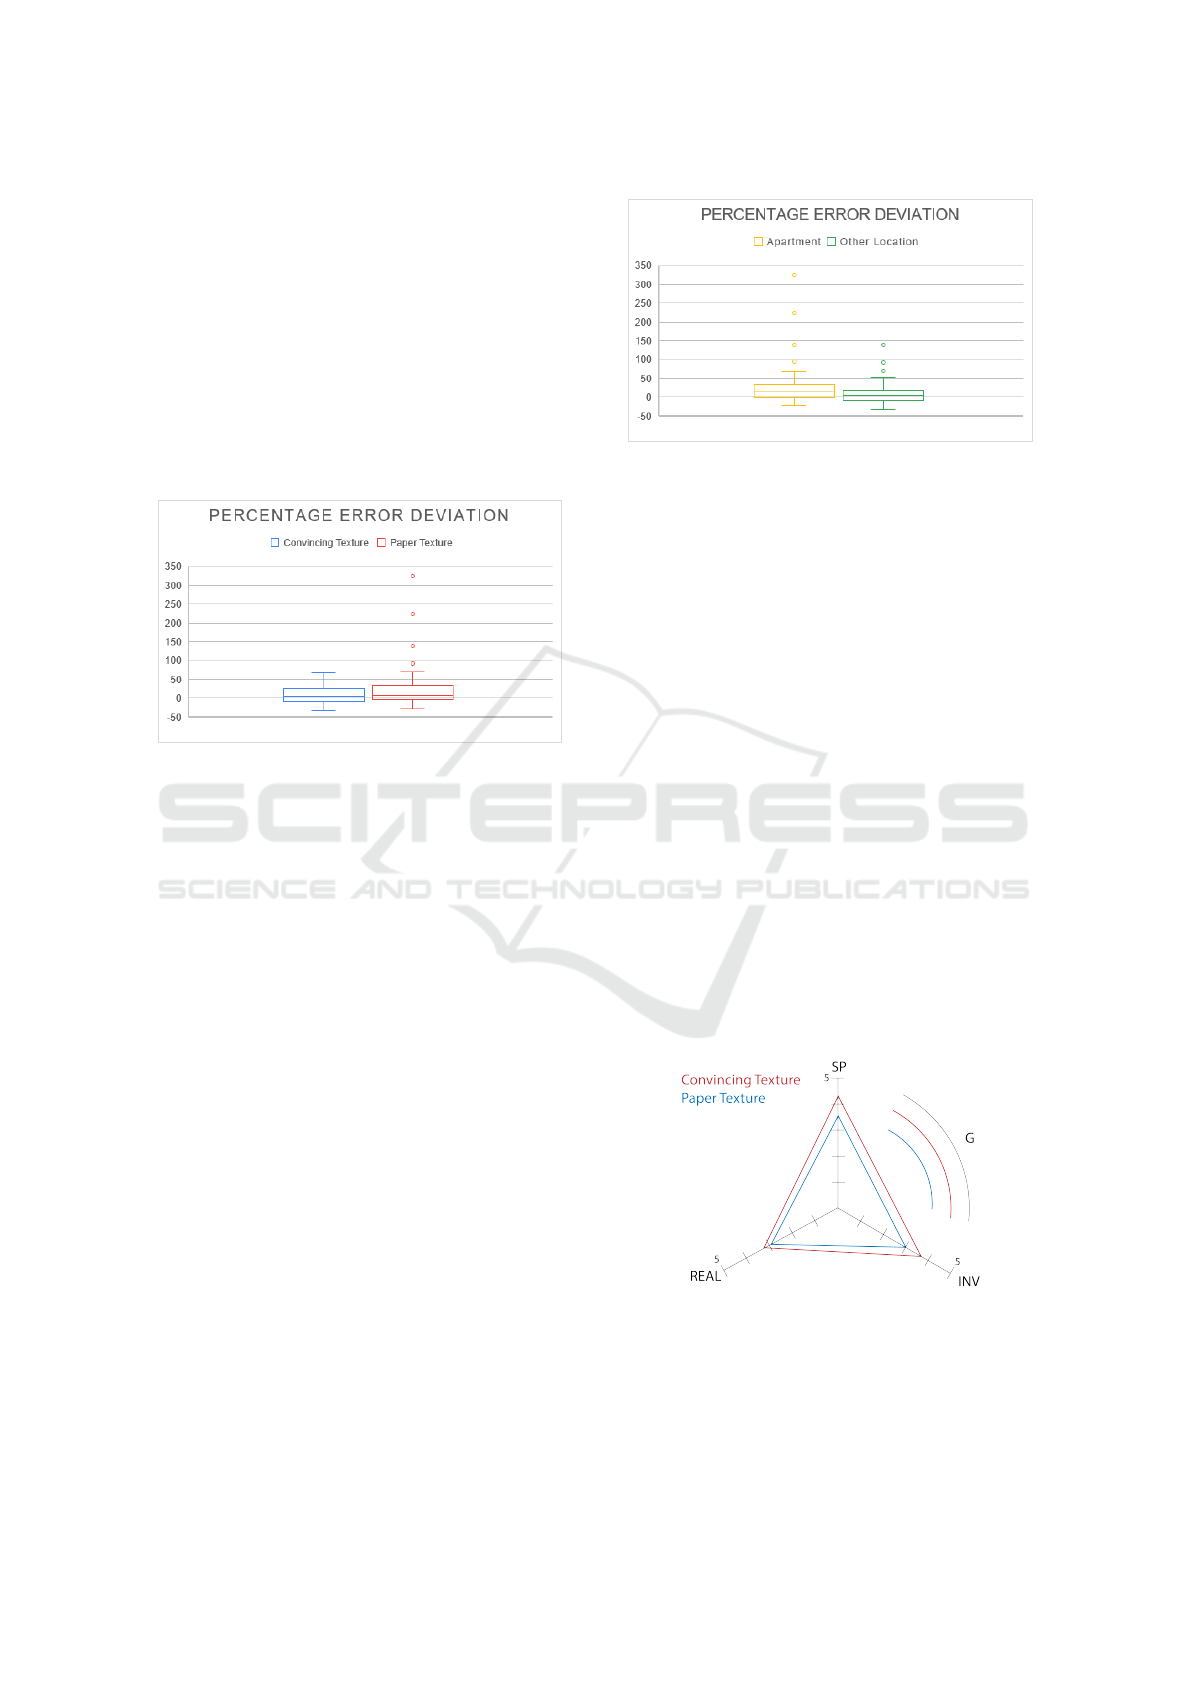
The means of the sub-scales of presence between
the conditions (i.e. convincing textures and paper tex-
tures) as shown in the presence profile in Figure 8.
Figure 8: The presence profile showing how the means of
each condition between the conditions are distributed for
each presence sub-scale.
The self-assessments of presence showed statis-
tically significantly higher scores in the sub-scales
Spatial Presence (SP) and Involvement (INV) within
Influence of Texture Fidelity on Spatial Perception in Virtual Reality
249

the convincing textures condition compared to the pa-
per textures. Although for the general “sense of be-
ing there” (G) and sub-scale Experienced Realism
(REAL) there was no significant difference between
the conditions.
5.3 Feedback on the Environments
Visuals
Seven of the participants stated that the outside of
the window looked slightly more “blurry” than the
rest. One participant described it as being immersion
breaking as it was flat compared to the rest of the envi-
ronment and two others stated that the window frame
was jagged as well.
The mirror was also mentioned by multiple peo-
ple. Four participants stated that it was in accordance
with real life and one participant even stated that it
gave a him a better affordance of depth view. Al-
though, three participants stated that the mirror was
a bit jagged compared to the environment, while two
participants noted that it was weird to not see them-
selves in the mirror, and a single person stated that he
did not even recognise it as a mirror at first.
Another interesting finding was that five of the
participants, who tried the experience from within the
real life equivalent of the VE, stated that the room
seemed smaller within the VE compared to real life.
This is particular interesting as most participant over-
estimated the distances. One participant also stated
that the VE was not as lit as the real life counterpart.
6 DISCUSSION
Our findings suggest, that the condition with convinc-
ing textures results in a higher precision than the pa-
per texture condition, however, no significant differ-
ence was observed in terms of accuracy between these
conditions. This contradicts research by Interrante et
al. (Interrante et al., 2006) (Phillips et al., 2009a)
(Phillips et al., 2009b). A difference between the tex-
ture conditions that might have had an influence on
this is the illuminance levels. In the version with pa-
per textures, the white material being reflected by the
reflection probe illuminated the room more than the
colours from the convincing textures did. So even
though the lighting setup and parameters were the
same, the environment with the paper textures was
more illuminated. This can be seen in Figure 4.
Furthermore, the precision between locations was
found to be higher when experiencing the Virtual En-
vironment (VE) from the unrelated location than the
apartment, with accuracy being unaffected. This is in
contrast to previous research done by Steinicke et al.
(Steinicke et al., 2009).
Another interesting finding was that participants
in general seemed to overestimate the distances,
which contradicts previous research that has shown
tendencies of general underestimations in Virtual Re-
ality (VR), as presented in Section 2. It is also in-
teresting to note that five of the participants entering
the experience from the real life equivalent of the VE,
stated that the room seemed smaller in the VE, but
still overestimated the distances in their assessments.
In terms of the users’ sense of presence, the con-
vincing textures scored significantly higher in spatial
presence and involvement. This correlates to prior
research which suggests that a higher visual fidelity
of an environment positively influences presence (see
Section 2). However, the correlation does not, as
previous research have suggested, significantly corre-
late with the distance assessments as described above.
There was no significant change in any of the pres-
ence sub scales between the entering locations, which
contradicts previous research into the effect of transi-
tional environments on presence.
A possible threat to both validity and reliability,
as has been eluded to earlier in Section 2.1, is the
measurement method of verbal assessment in metrics,
which in a few earlier studies been suggested to be un-
reliable. It is likely that some of our outliers in the
experiment is due to the verbal assessment method
being unreliable for some individuals, since verbal
assessments in metric is not something that is com-
monly used in everyday life for most people. A few
participants also stated that they for some of their dis-
tance assessments, such as with the window frame,
used knowledge of familiar sizes of window frames,
instead of na
¨
ıvely evaluating the distance in the VE.
Another threat to the reliability of the test is that the
experiment only had 20 participants. This makes it
impossible to properly generalize our findings.
However, since the majority of our findings con-
tradict previous research, we explored some of the
differences in methods between previous studies and
ours, and concluded that the main difference was that
we used a relatively small room compared to research
in this field. We hypothesize that these size differ-
ences in the VEs may have been the main cause be-
hind the contradictions. We suggest an investigation
of this through a large-scale validation study with a
number of VEs of various sizes rather than just one,
and a larger sample of participants. This could be
done using the method we applied in this study, or,
more interestingly, a variety of the methods presented
in Table 1.
GRAPP 2022 - 17th International Conference on Computer Graphics Theory and Applications
250

7 CONCLUSION
The aim of the study was to investigate the influence
of texture fidelity on spatial perception of a Virtual
Environment (VE). An experiment was conducted
with participants assessing distance in two different
VEs: one environment having convincing textures
and one having paper textures, both with the same ge-
ometry. The experiment was split into two sub exper-
iments investigating whether the location from where
you enter the VE has an influence on the assessments,
with one of the locations being the real life equivalent
of the VE.
The findings suggested that the environment with
convincing textures had higher precision than the one
with paper textures. However, there was no signifi-
cant difference between the accuracy of assessments
in neither the texture fidelities nor the entering loca-
tions. The entering locations also did not have any
influence in accuracy, while the precision of assess-
ments were higher for participants entering from an
unrelated location than the real life equivalent of the
VE. Both of these findings contradict previous re-
search into transitional environments.
A more interesting finding was the consistent
overestimations in distance assessments which con-
tradicts previous studies, which we hypothesize could
be caused by the evaluated VE being smaller in size
than those used in previous research. We suggest
that this is researched further by evaluating distance
perception in VEs of various sizes, using either the
method used in this paper, or a variety of those pre-
sented in Table 1.
REFERENCES
Armbr
¨
uster, C., Wolter, M., and Kuhlen, T. W. (2008).
Depth perception in virtual reality: Distance estima-
tions in peri- and extrapersonal space.
Birn, J. (2014). Digital Lighting and Rendering. New Rid-
ers, San Francisco, California, 3rd edition.
Brown, R. (2021). Oculus quest 2: Full specification.
Corporation, H. (2020). Adjusting the ipd on the headset.
Gagnon, H. C., Buck, L., Smith, T. N., Narasimham, G.,
Stefanucci, J., Creem-Regehr, S. H., and Bobby, B.
(2020). Far distance estimation in mixed reality.
Hornsey, R. L. and Hibbard, P. B. (2021). Contributions of
pictorial and binocular cues to the perception of dis-
tance in virtual reality. Virtual reality : the journal of
the Virtual Reality Society, 1.
igroup.org (2016). igroup presence questionnaire (ipq)
overview.
Interrante, V., Ries, B., and Anderson, L. (2006). Distance
perception in immersive virtual environments, revis-
ited. In Proceedings of the IEEE Conference on Vir-
tual Reality, VR ’06, page 3–10, USA. IEEE Com-
puter Society.
Jensen, T., Kasprzak, F., Szekely, H.-G., Nikolov, I.,
Høngaard, J., and Madsen, C. (2020). Preliminary
study on the influence of visual cues, transitional en-
vironments and tactile augmentation on the perception
of scale in vr. In HCI International 2020 – Late Break-
ing Posters, Communications in Computer and Infor-
mation Science, pages 156–164. Springer.
Kelly, J. W., Cherep, L. A., Klesel, B., Siegel, Z. D., and
George, S. (2018). Comparison of two methods for
improving distance perception in virtual reality.
Kelly, J. W., Cherep, L. A., and Siegel, Z. D. (2017). Per-
ceived space in the htc vive.
Klein, E., Swan, J. E., Schmidt, G. S., Livingston, M. A.,
and Staadt, O. G. (2009). Measurement protocols for
medium-field distance perception in large-screen im-
mersive displays.
Lang, B. (2021). Quest 2 continues to grow by leaps and
bounds among vr headsets on steam.
Li, B., Zhang, R., Nordman, A., and Kuhl, S. A. (2015).
The effects of minification and display field of view
on distance judgments in real and hmd-based environ-
ments.
Loyola, M. (2018). The influence of the availability of vi-
sual cues on the accurate perception of spatial dimen-
sions in architectural virtual environments. Virtual Re-
ality, 22:235–243.
Manson, J. and Sloan, P.-P. (2016). Fast filtering of reflec-
tion probes. Computer Graphics Forum, 35(4):119–
127.
Ng, A. K. T., Chan, L. K. Y., and Lau, H. Y. K. (2016).
Depth perception in virtual environment: The effects
of immersive system and freedom of movement.
Ozacar, K., Ortakei, Y., Kahraman, I., Durgut, R., and
Karas, I. R. (2017). A low-cost and lightweight 3d
interactive real estate-purposed indoor virtual reality
application. ISPRS Annals of the Photogrammetry,
Remote Sensing and Spatial Information Sciences, IV-
4/W4:307–310.
Peer, A. and Ponto, K. (2017). Evaluating perceived dis-
tance measures in room-scale spaces using consumer-
grade head mounted displays.
Phillips, L., Ries, B., Interrante, V., Kaeding, M., and An-
derson, L. (2009a). Distance perception in npr immer-
sive virtual environments, revisited.
Phillips, L., Ries, B., Interrante, V., Kaeding, M., and An-
derson, L. (2009b). Distance perception in npr immer-
sive virtual environments, revisited.
Steinicke, F., Bruder, G., Hinrichs, K., Lappe, M., Ries, B.,
and Interrante, V. (2009). Transitional environments
enhance distance perception in immersive virtual re-
ality systems.
Team, D. (2018). What is architectural visualization?
Technologies, F. (2021). Oculus compare headsets. https:
//www.oculus.com/compare/.
Technologies, U. (2020). Optimizing graphics performance.
https://docs.unity3d.com/2017.4/Documentation/
Manual/OptimizingGraphicsPerformance.html.
Influence of Texture Fidelity on Spatial Perception in Virtual Reality
251
